

In the not too distant past, Chicago was known as the center of black capitalism in America, and within the city, the Chatham neighborhood reflected the heart of black middle-class aspirations. In recent years, residents of Chatham and other south side neighborhoods have confronted a barrage of challenges to their once stable communities. In hopes of stanching this tide, Congressman Bobby Rush, whose district includes the Chatham neighborhood, and scores of civic leaders, helped launch the Greater Chatham Initiative (GCI) in June 2016,1 to mobilize resources for a comprehensive set of interventions. As part of this initiative, the GCI Leadership Committee commissioned and published a report called The Comprehensive Plan for Economic Growth and Neighborhood Vitality, with the objective of augmenting investment in the people, firms, and places of Greater Chatham, and reconnecting them to the economic growth of the regional economy.
In this article, we conduct a case study of Greater Chatham in which we analyze key themes related to neighborhood demographics, employment, and business conditions to better understand the issues for supporting small businesses, expanding employment, and making quality of life investments in the Greater Chatham area. We also include insights and policy recommendations from community leaders, residents and other experts for increasing prosperity in Greater Chatham and other south side neighborhoods of Chicago, based on discussions during a 2017 symposium organized by the Federal Reserve Bank of Chicago in collaboration with the GCI and World Business Chicago.2
The analysis reveals important issues, including an exodus of young people and rising rates of unemployment, that make it clear why investing in Greater Chatham’s economic development is so important at this time. But it also points to opportunities, like the growing share of minority-owned businesses, the existence of industrial clusters with large numbers of jobs, and the creation of first rate cultural spaces, which offer a foundation for leveraging new investments in place. As presenters at the symposium noted, a comprehensive set of responses has begun to take shape with the launch of the GCI and other efforts, as local residents and business owners, in partnership with civic leaders and the city of Chicago’s economic and workforce development teams, redefine the vision for their community.
Figure 1. Map of Greater Chatham area

Figure 2.
A. Total population

B. Change in population

Trends in demographic indicators
Greater Chatham is a 15-square-mile area including the communities of Avalon Park, Auburn Gresham, Greater Grand Crossing and Chatham (figure 1).3 These are neighborhoods where more than 95 percent of the population identifies as black, but they are also places that have experienced precipitous declines in their populations in recent years. Greater Grand Crossing, for example, saw a more than 20 percent decline in population between 2000 and 2015. This runs contrary to the trend in other parts of Chicago, which have seen some reversal in population losses from previous decades (figure 2).4
The educational composition of people living in Greater Chatham suggests a mixed picture regarding the ability of Greater Chatham to retain valuable human capital. On one hand, the communities of Chatham and Avalon Park have relatively high educational attainment, as 20 percent or more of their populations have a bachelor’s degree or higher. These rates are on par with, for example, the neighborhood surrounding the University of Chicago.5 On the other hand, looking at changes in the education distribution of residents over time suggests some degree of human capital loss may be accompanying the decline in population. The share of residents with a bachelor’s degree or more has fallen at various rates in communities in Greater Chatham 6(figure 3). In addition, the young adult population in the age range of 19 to 34 – so called ‘millennials,’ who make up the largest share of the labor force, and who tend to be more educated7 – is a lower and decreasing proportion of the population in Greater Chatham. This same age cohort constitutes a larger and increasing group in the city of Chicago overall (figure 4).
Figure 3. Percent of population with a bachelor's degree or higher
Employment and income indicators
An increasing segment of the Greater Chatham population is not in the labor force. This proportion went from about 25 percent to close to 30 percent between 2010 and 2015, representing 16 percent more people in these neighborhoods who were either not employed or looking to be employed. By contrast, in Chicago, the share of the city population that was not in the labor force dropped slightly from 22 percent in 2010 to 21 percent in 2015. Even for the population that did count itself in the labor force, high rates of unemployment have remained perhaps one of the most vexing issues affecting these predominantly black communities. Unemployment rates have hovered around 20 percent in the Greater Chatham communities in spite of the general tightening of labor that has taken place nationwide (from 9.3 percent in December 2010 to 5 percent in December 2015), as well as in the greater Chicago metropolitan (statistical) area (from 10.7 percent to 6 percent) (figure 5).
Labor market woes, in addition to the age profile of the population in the area, are among the factors that have contributed to lower median household incomes and higher poverty in these neighborhoods. Median income was between 60 percent and 80 percent of the city median in the neighborhoods of Greater Chatham in 2015 – a gap that had grown since 2010. The higher percentage of older adults in Greater Chatham, perhaps in retirement, likely contributed to the lower streams of income.
Figure 4. Percent distribution of population by age cohorts.
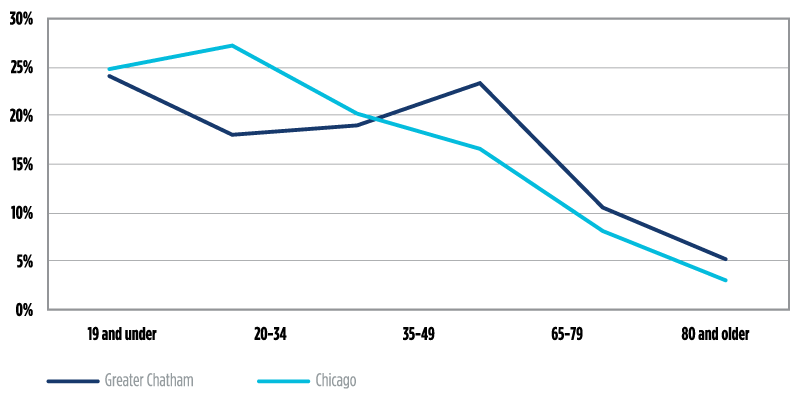
Figure 5.
A. Percent not in labor force (population, 25-64)

B. Unemployment rate

Figure 6.
A. Median income

B. Poverty rate

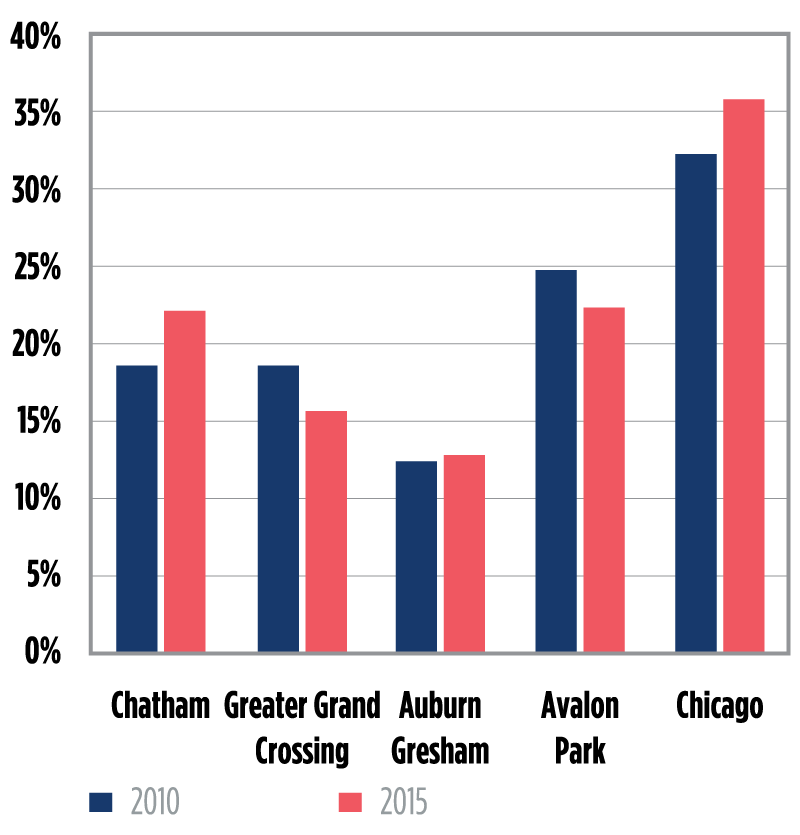
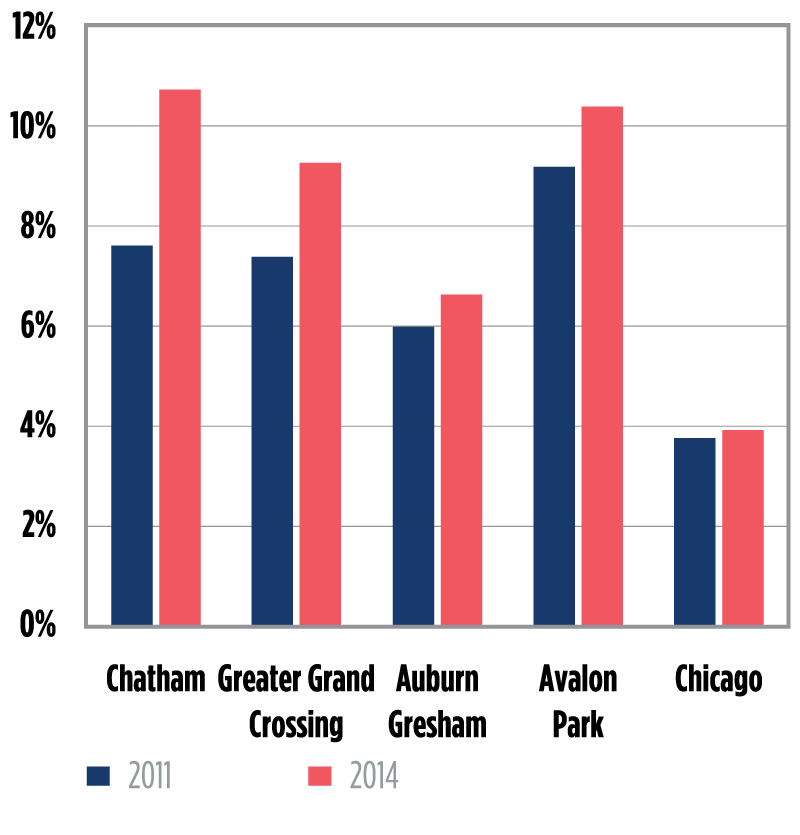
Relatedly, the Greater Chatham area has been affected by high poverty rates, which seem to have worsened in recent years. In 2015, more than 30 percent of households in places like Greater Grand Crossing and Auburn Gresham lived in poverty, compared to just above 10 percent for the city of Chicago (figure 6).
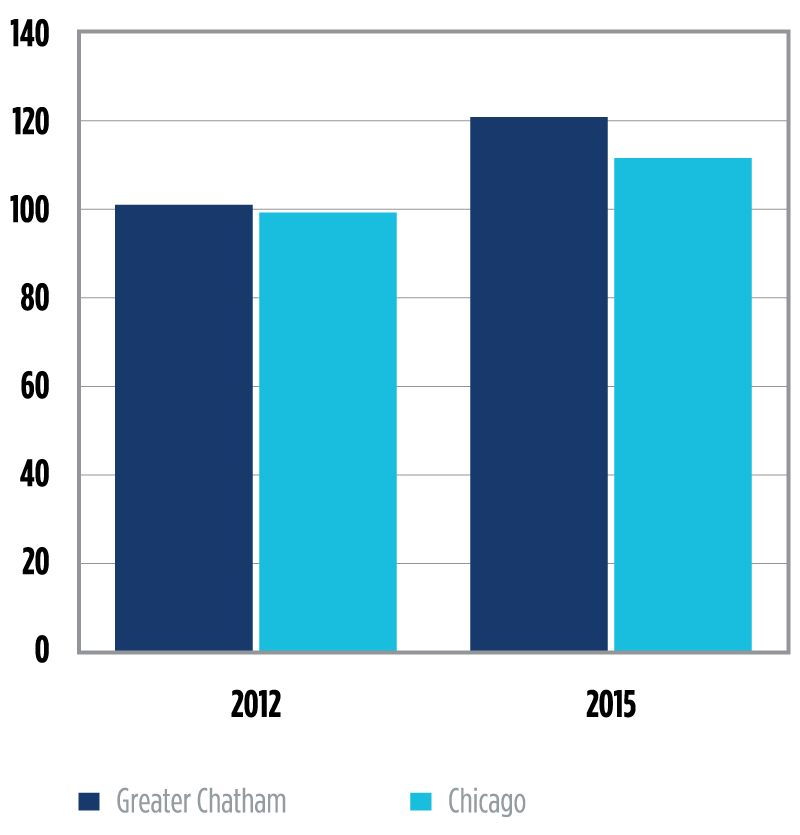
Such conditions are perhaps one of the reasons for the almost twice-as-high rate of violent crimes (per capita) in Greater Chatham compared to the rest of the city. Although violent crimes decreased in Greater Chatham between 2003 and 2016, the per-capita rate remained higher than in the city as a whole (figure 7). Joblessness and falling incomes may also help explain Greater Chatham’s lingering foreclosure rates (as of July 2017) – ranging from 3 percent to 10 percent in the surrounding zip codes8 – compared to a rate of less than 1 percent for the city of Chicago.
Recent trends in occupational and industry composition of the workforce provide an additional indicator of the near-term prospects for job growth in Greater Chatham. A relatively high proportion of workers are employed in sales and office occupations, as well as in service, management, business, science, and arts occupations, mirroring the occupational composition of the Chicago labor force as a whole (figure 8). The concentration of transportation and manufacturing traded clusters, and the presence of local clusters with retail trade businesses, as well as major anchor institutions including hospitals and universities, are also reflected in the data for employer industries.9 A relatively high proportion of workers in Chatham are employed in education, health services, transportation, and warehousing11 (figure 8). The data, however, suggest a loss of competitiveness in Greater Chatham following the 2008-2010 recession, when comparing job growth in these neighborhoods to job growth in the city as a whole. From 2011 to 2015, even the sectors which traditionally employed the highest share of workers in Greater Chatham shed jobs. While the city of Chicago has seen job growth in most of its major industries, Greater Chatham has experienced job declines for its residents in each of those industries (figure 9).
Figure 7. Violent crimes per 100 people
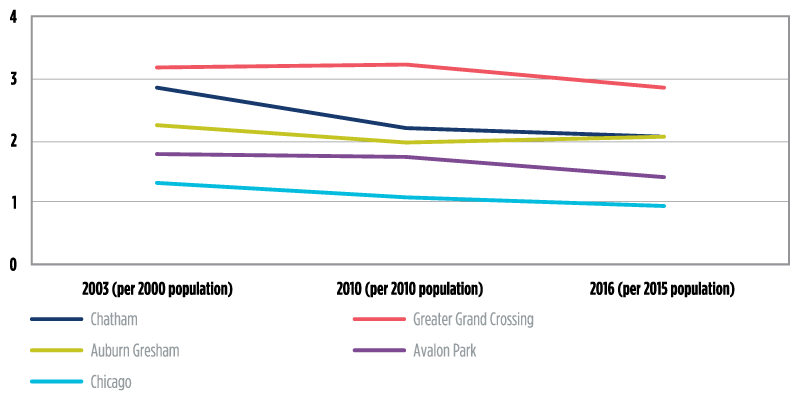
Figure 8. Share of employed population by occupation
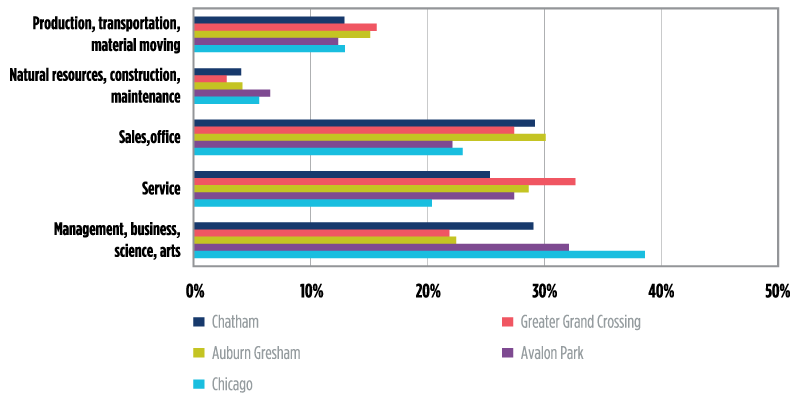
Figure 9.
A. Share of employed people by industry, 2015

B. Change in number of employed people by industry, 2011-2015

The business landscape
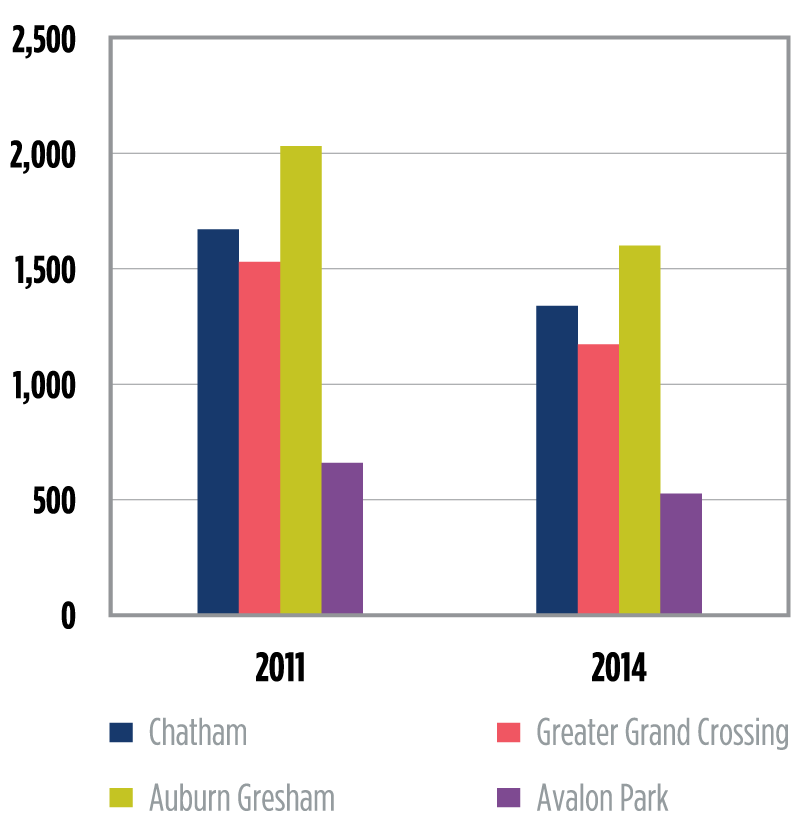
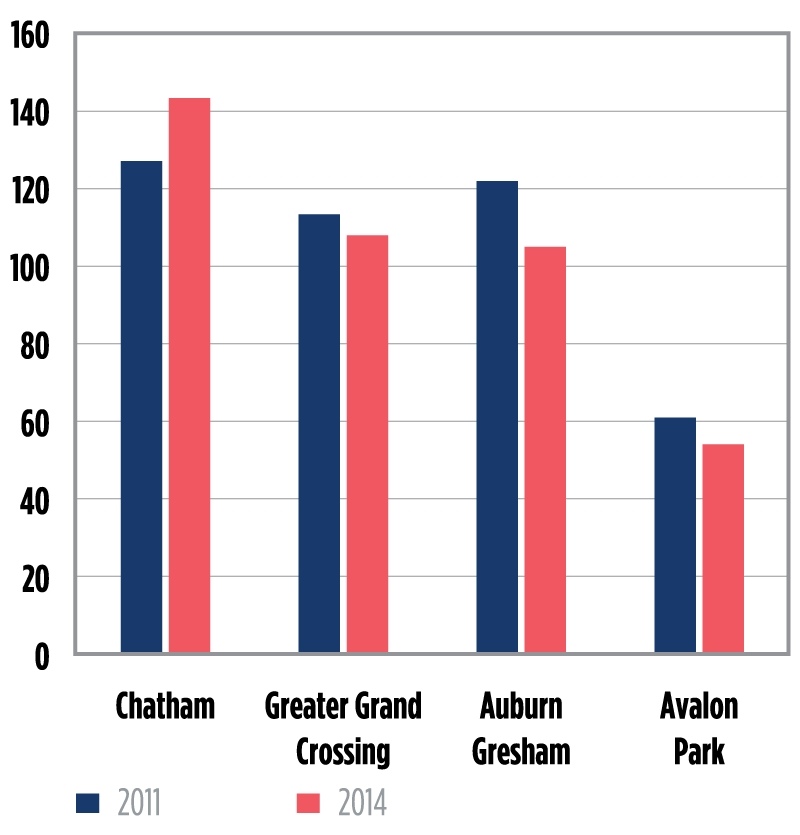
The decline in population and income in Greater Chatham has coincided with weakening business performance.11 Establishment (i.e., business) counts have fallen in Greater Chatham since the 2008-2010 recession, as they did in the city of Chicago overall. The number of businesses fell by 22 percent between 2011 and 2014 (the latest year available), compared to a drop of about 15 percent in the city of Chicago. This means that Greater Chatham went from having more than 6,000 businesses to having fewer than 5,000 businesses, though places within Greater Chatham varied with respect to the number of businesses per capita compared to the city of Chicago. As of 2014, Avalon Park had five businesses per 100 people – on par with the rate for the city as a whole. By contrast, the communities of Auburn Gresham and Greater Grand Crossing had between three and four businesses per 100 people. This signals some potential gaps in the presence of business in those communities.12
Figure 10.
A. Number of establishments
B. Small businesses as a share of all businesses and per 100 residents

In addition, businesses in Greater Chatham tend to be of different sizes or types compared to the city as a whole. For example, as of 2014, about 95 percent of businesses in Greater Chatham were small (defined as businesses with revenues under $1 million), compared to 85 percent in the city of Chicago. Interestingly, comparing the percent of small businesses in 2014 and 2011 reveals some important dynamics occurring in the small business landscape, which extend beyond the specific communities of Greater Chatham. In each of the communities and in the city of Chicago as a whole, we note a shrinking proportion of small businesses, suggesting a potential shift in the composition of businesses in the region toward larger-scale operations13 (figure 10).
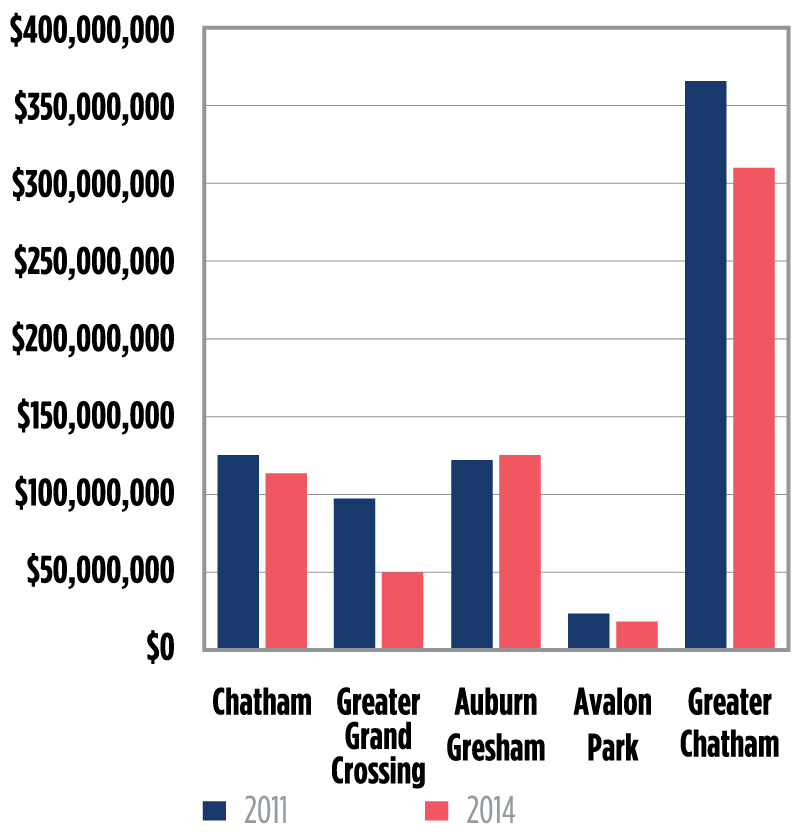
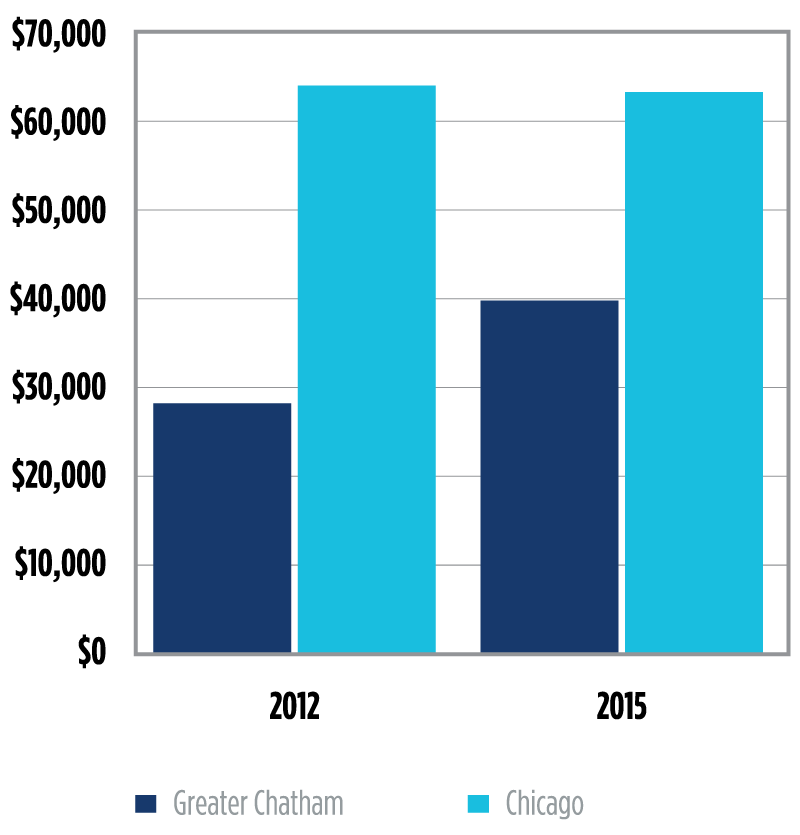
Post-recession, average business revenue has increased in communities in Greater Chatham, although revenue per business in Greater Chatham has tended to be about half of that per business in Chicago overall. Normalizing revenue by business size shows a reduced but still marked gap in revenue (20 percent) between small businesses in Greater Chatham and those in the city of Chicago. These small businesses serve a community, which, as the data on income and poverty suggest, may have relatively more income constraints (figure 11).
Figure 11.
A. Average revenue per business

B. Average revenue per small business

An equally important question is the extent to which minority-owned businesses operate in this predominantly majority-minority area, and how they are performing.14 According to census data, the percent of self-employed individuals in Greater Chatham went from somewhat close to that in the city of Chicago (about 9 percent) in 2010 to about half that rate as of 2015. To the extent that self-employment or entrepreneurship coincides with greater income and wealth for households, as suggested by the research,15 this could also explain in part weaker economic conditions in the Greater Chatham area vis-a-vis its region, and would suggest that there is room to stimulate and support entrepreneurship (figure 12).
Self-employment declines notwithstanding, minority-owned businesses have been well represented in the Greater Chatham area, at least in comparison to the city overall. Greater Chatham had more than 400 minority-owned businesses as of 2014, representing 7 percent of minority-owned businesses in Chicago. (By comparison, 12 percent of the minority population in Chicago lived in Greater Chatham.) While the overall count of minority businesses fell slightly compared to 2011, the percent of these establishments rose as a share of all businesses. Within each of the Greater Chatham neighborhoods, between 7 percent and 11 percent of businesses were minority-owned, compared to 4 percent of all businesses in Chicago (figure 13).
Figure 12. Households with self-employment income

Figure 13.
A. Minority-owned businesses
B. Minority-owned businesses as a share of all businesses
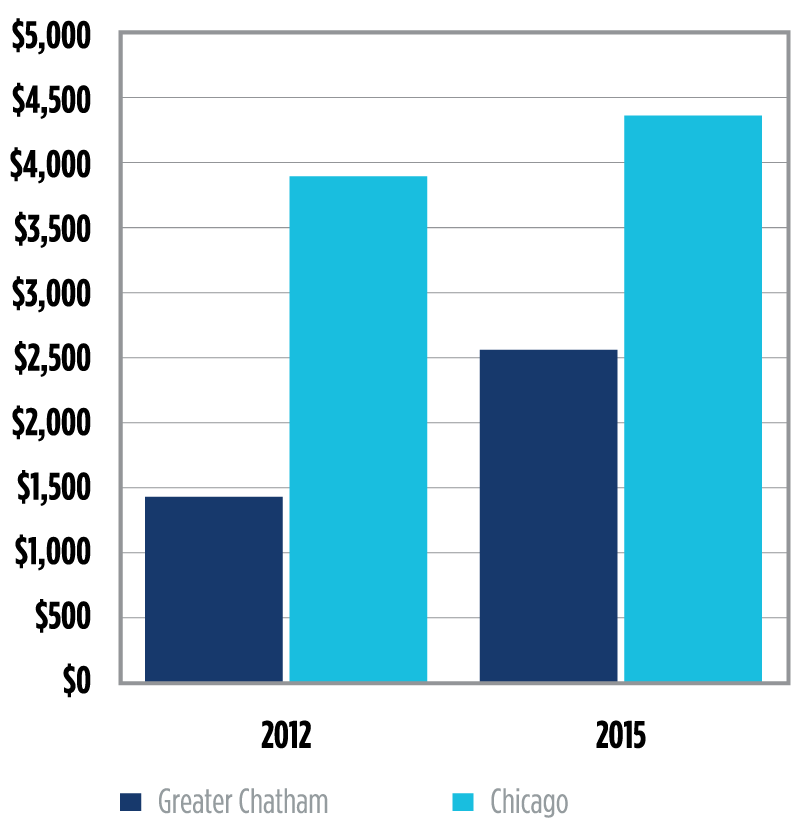
A look at revenue generated by minority-owned businesses, totaling more than $300 million in 2014, makes it clear why the Greater Chatham area is known as one of the most frequent destinations for shopping at minority-owned establishments in Chicago. The average revenue of minority businesses in Auburn Gresham, for example, was higher than the average revenue of minority business for the city of Chicago as a whole, suggesting that businesses in this particular community are larger and ostensibly provide a more substantial source of employment than is representative of minority businesses elsewhere in the city. Moreover, average revenue per business increased in Auburn Gresham between 2011 and 2014, in contrast to the stagnant trend for minority businesses in the city overall. The picture is somewhat reversed for Chatham and Greater Grand Crossing, where the average revenue generated by minority-owned businesses declined between 2011 and 2014, suggesting that some of those businesses may have found it more difficult to grow compared to other minority businesses in Chicago (figure 14).
An analysis of new business formation suggests some potential degree of positive dynamics in the business landscape of Greater Chatham. Based on data from 2014 alone (the latest available), more than 120 new businesses were formed in Greater Chatham, which represents 2.5 percent of new businesses created in the city of Chicago. Three percent of small businesses created that year in the city of Chicago were in the Greater Chatham area, and more than 8 percent of newly formed minority businesses in the city were established in Greater Chatham (figure 15).
Figure 14.
A. Revenue generated by minority-owned businesses
B. Average revenue of minority-owned businesses

Figure 15. Business formation in Greater Chatham, 2014.

Figure 16.
A. Total number of CRA business loans in Greater Chatham

B. Total volume of CRA business loans in Greater Chatham (in 000s)

Finally, an important issue has to do with business financing. Indeed businesses at different stages are in need of or utilize various and different sources of funding. Previous research has shown that businesses and entrepreneurs or households in ethnic minority neighborhoods like Chatham use both informal and formal financing; and in some cases, they have less access to the latter given greater liquidity constraints.17 In addition, high rates of denial and perceived or experienced discrimination may discourage people from even applying for credit.17 Even so, bank lending remains an important component of funding sources for businesses, and access to formal sources of capital is vital for local businesses to thrive and enhance the health of a community.
An analysis of business lending in Chatham suggests that post financial crisis, banks have expanded their lending to Greater Chatham communities, as they have been doing for businesses throughout Chicago, although still below the levels from before 2008 (figure 16). After normalizing lending by business size (revenues less than or greater than $1 million), lending per business in Greater Chatham trails that of the city, however (figure 17). Businesses in the Greater Chatham area may find it harder to expand due to difficulties accessing the credit market, an issue which is exacerbated when small businesses operate in markets where individuals are themselves more income- and credit-constrained. The changing banking landscape, whereby bank branches have closed and many small and mission-oriented banks that specialized in business lending are no longer in operation, may also contribute to decreased credit access to small businesses. These results suggest that initiatives to understand the credit needs of the community and address the factors affecting credit may offer additional ways to strengthen and expand local businesses.
Figure 17.
A. CRA loans per 100 small businesses

B. CRA loans per 100 large businesses
C. CRA lending volume per small business
D. CRA lending volume per large business
Recommendations
Making Greater Chatham more competitive
Presenters at the June 2017 symposium nearly unanimously acknowledged that south side communities, including Greater Chatham, have the assets, including both physical infrastructure and community-based institutions, which provide a strong basis for economic growth and development. The Greater Chatham area has freight rail and interstate highway access, large tracts of land that are available for industrial and manufacturing purposes (GCI, 2016), and a collection of long-established black-owned businesses, as seen in the data.
What would make Chatham an even more competitive and prosperous community, according to some of the speakers, would be for community developers to focus on industrial development and to pursue strategies that align neighborhood job creation with job growth in the regional economy. From this perspective, focusing on traded industry clusters with large numbers of jobs, clusters of businesses in the Chicago region that export goods and services to other places in the country and the world, would be one method for directing investment towards south side employment.
An additional employment strategy on a more micro level would be to train people for jobs who have a demonstrable career ladder, including those in the manufacturing sector. At the front end, this strategy entails encouraging certain employers to institute wage thresholds – that is, making the case to employers to build enough margin in their plans so that they can pay wages that incentivize good employees and minimize job turnover. Enabling employees to work their way up the job ladder also takes credentialing, such that high-quality training resources need to be available to workers. Presenters noted that the organizations that make up the public workforce training system18 are equipped to teach specific technical skills, and that many employers do not realize that this essentially free system is available to them at no direct cost.
Spreading the word about the changing nature of manufacturing employment is another facet of getting more south side residents – especially younger workers – into manufacturing jobs. Exposure to this information needs to take place as early as grammar school, so that young workers know that these jobs might align with their skill sets and passions, and that many of these companies offer entry level employment right out of high school.
Strategies for stimulating small business growth
Small business activity is another important piece of economic development in Chatham, and the expansion of anchor procurement programs has become a growing area of opportunity for small businesses on the South Side. Corporate headquarters, hospitals, and educational institutions offer broad-based procurement opportunities for small businesses – from high-end legal work and accounting to bookkeeping, laundry, and food services. By participating in the Chicago Anchors for a Strong Economy (CASE),19 for example, the University of Chicago shifted its procurement rubric from one of business diversity to one of support for the surrounding community, and in doing so, opened up opportunities for working with business-to-business firms, as well as traditional business-to-consumer and ‘mom and pop’ establishments. Presenters noted that this model has the potential to be replicated in other neighborhoods, where middle- and small-sized organizations, including chambers of commerce or social service agencies, can reframe their roles and develop or facilitate local purchasing programs.
Additional programs from anchors, nonprofits, the city, and foundations are also presenting small businesses in these underinvested neighborhoods new sources of capital and assistance. The Polsky Exchange20 at the University of Chicago is a business incubator that draws about 600 of its 3,000 members from the surrounding community, most of whom have had no previous affiliation with the university. Through a change in the zoning code, Chicago developers doing projects in the central business district are now paying into a fund – called the Neighborhood Opportunity Fund21 – to which businesses along designated (underinvested) corridors can apply for commercial and cultural projects. In addition, the mayor and city treasurer’s office have created the Chicago Community Catalyst Fund (also called Fund 77),22 a “fund-of-funds” administered by a board of trustees acting as investment managers, that uses $35 million in public money to leverage investment dollars from the private sector. Benefit Chicago23 is another newly-created vehicle from foundations and social impact investors to address financing needs among nonprofits and startups, and provides loans and investments to mission-oriented businesses and social enterprises. And Chicago Neighborhood Initiatives,24 The Chicago Community Loan Fund,25 and others are also lending to small businesses in Chatham, Auburn Gresham, and other south side neighborhoods.
While banks have always been a traditional source of business capital, community banks are contributing to business development in other ways as well.26 Illinois Service Federal Bank, whose representative spoke at the symposium, is one of the few remaining black-owned banks in Illinois, and provides business owners with technical assistance for preparing social security taxes, financial statements, and tax returns as a free service to its borrowers.27 As presenters also noted, the latest update of the Interagency Questions and Answers Regarding Community Reinvestment, published in July 2016,28 re-affirmed that bank support for business startups, entrepreneurship, and technical assistance are CRA-eligible activities, as are bank activities related to job creation, job retention, and workforce development. The most recent update also added revitalization of main streets in urban and rural markets as examples of CRA-eligible bank activity.
Strengthening infrastructure and networks to promote community development and economic growth
Presenters acknowledged that there is no single solution to address all of the employment and business challenges facing Chatham and the surrounding neighborhoods. In addition to the programs and strategies enumerated above, the city must invest more in public infrastructure – transportation, parks, schools, and public safety – because these too draw both people and private investments to neighborhoods. Funds for environmental remediation are also needed to enable smaller businesses and investors to buy property and vacant land. Many south side businesses could also benefit from better access to broadband infrastructure,29 as well as to information about programs that offer capital to minority-owned businesses or distressed neighborhoods.
Last but not least, there are core principles that planners, policymakers, and investors may need to adhere to, according to presenters, in order to ensure that programs remain funded and that investments have a positive impact on community members. Guidance on what neighborhoods need – what amenities or infrastructure make residents want to be near each other – should include the residents’ perspectives, and not just those of city government or outside developers. Imaginative thinkers should collaborate with experienced local developers, including community development financial institutions (CDFIs) and local nonprofits, who are already involved in building out the spaces within these neighborhoods, to help ensure their ideas translate into reality. Purposeful activities that encourage communication and build empathy across community residents are also needed to engage more people in the community development process. More precisely, efforts to build social capital between different groups of people – contact networks and relationships of trust – may be as important as building financial capital. Social capital allows local business owners and community members to have a seat at the decision-making table, and when economic development projects get underway, to make that case that they too can deliver high quality products, services, or engagement.
Conclusion
In this article, we conduct an analysis of the most recent available data to understand key elements of neighborhood stability and employment conditions in Greater Chatham. This majority-minority community is grappling with significant challenges, including losses in its black population (as is the city as a whole), high unemployment, and lower labor force participation, reflecting the relatively low pool of 19- to 34-year-old residents who live in the area. The Greater Chatham community is still lagging in the recovery of its housing market.
Yet Greater Chatham remains a community with relatively high levels of human capital, where more than 20 percent of its residents have at least a college education. The area also remains strong in various traded and local industry clusters, including manufacturing, transportation, health, education, and retail trades, in which a large portion of residents are employed, at rates that are more highly representative of the workforce for the city. While there is room for increasing and stimulating entrepreneurship in the community, the area remains a stronghold for minority-owned business activity, as well as a destination for newly formed minority-owned businesses. As the recent convening at the Federal Reserve Bank at Chicago made clear, leaders from the community and throughout the city are investing substantial effort and resources in reversing the declines in this once-stable, middle-class neighborhood. They are leveraging existing clusters of industry assets with employee training and other company assistance, adding new sources of capital for corridor development, and adding training and supplier opportunities for local businesses. They are also opening channels of communication between residents and planners to build social capital and networks that promote economic and financial inclusiveness.
1 See http://www.greaterchathaminitiative.org.
2 For a summary of the symposium, see Newberger and Toussaint-Comeau (2017). The Community Development and Policy Studies department of the Federal Reserve Bank of Chicago has long been interested in understanding patterns of utilization of financial services and credit access in Chicago’s black neighborhoods and the Seventh District, including Chatham. (See for example Bond and Townsend, 1996). More recent work has focused on neighborhoods in Detroit (e.g., Toussaint-Comeau and Newberger, 2014a). For data, resources, and research on the banking and financial infrastructure in Detroit, see CDPS Resources for Small Business and Growth in Detroit at https://www.chicagofed.org/region/community-development/community-economic-development/detroit-project/index.
3 Residents not only identify with these four community areas, but also with the neighborhoods within them such as West Chatham, Park Manor, and Chesterfield. The analysis here is at the level of the four communities based on the census tracts that make up these communities.
4 While the black population of Chicago has contracted, the white and Hispanic populations of the city have been growing (e.g., Eltagouri, 2016; Loury, 2017).
5 By comparison, less than 10 percent of residents in many other black neighborhoods on the South Side of Chicago have graduated from college. Source: Statistical Atlas https://statisticalatlas.com/place/Illinois/Chicago/Educational-Attainment.
6 Some of the observed changes in education rates may reflect the in-migration of residents from neighborhoods after the closing of public housing in those neighborhoods.
7 See Fry (2015) for an analysis of the labor force composition by generation.
8 Based on foreclosure data from McDash Analytics and includes first lien prime/near prime, first lien subprime, second lien prime/near prime and second lien subprime. Data is based on zip codes 60617, 60619, 60620, 60621, and 60637.
9 “Traded clusters” are groups of related industries that serve markets beyond the region in which they are located. According to the U.S. Cluster Mapping Project website, companies within traded clusters are free to choose where they operate (unless the location of natural resources drives where they can be), but are highly concentrated in a few regions, tending to only appear in regions that afford specific competitive advantages. Examples of traded clusters include financial services in New York City, information technology in Silicon Valley, and video production in Los Angeles. Traded clusters are the "engines" of regional economies; without strong traded clusters it is virtually impossible for a region to reach high levels of overall economic performance. This is in contrast to “local clusters,” which consist of industries that serve the local market. They are prevalent in every region of the country, regardless of the competitive advantages of a particular location. Examples include local entertainment, retail trades, and local health services such as drug stores and hospitals. Local clusters provide necessary services for the traded clusters in a region, and both are needed to support a healthy and prosperous regional economy. For a review of the importance of clusters in inner cities, see Toussaint-Comeau, Newberger, and Augustine (2016).
10 The top five employers in of Greater Chatham residents are University of Chicago, University of Chicago Medical Center, Advocate Trinity Hospital, Saint Bernard Hospital and Health Care Center, South Shore Hospital, and Finkl Steel. Source: MNI, Hoovers (accessed 4/26/17).
11 We use census data as well as proprietary data from the National Establishment Time-Series Database (NETS) to analyze business data.
12 The scope of this research is not accounting for demand for goods and services.
13 Literature from both the banking and finance fields, and the health and environmental fields, point to increased risks for small scale businesses operating in today’s financial and regulatory environment (e.g., Reed, 1999, and Gates et al., 2006).
14 The data does not allow us to break down minority ownership by ethnicity and race.
15 See for example Friedline and West (2016).
16 See Bond and Townsend (1996).
17 Bates and Robb (2016).
18 See http://www.workforceboard.org/ and https://www.doleta.gov/business/pws.cfm.
19 See http://www.chicagoanchors.com.
20 See https://polsky.uchicago.edu/polsky-exchange.
21 See https://neighborhoodopportunityfund.com.
22 See http://www.chicagocitytreasurer.com/treasurer-summers-announces-125-million-in-investment-portfolio-earnings-for-fy-2016-57-million-more-than-budgeted.
23 See http://www.benefitchi.org.
24 See https://www.cnigroup.org/neighborhood-lending.
25 See http://cclfchicago.org.
26 For more information on the changing bank infrastructure in high-minority areas and the closing of African-American-owned banks, see Toussaint-Comeau and Newberger (2014b), and Toussaint-Comeau and Newberger (2017).
27 See https://www.isfbank.com.
28 See https://www.ffiec.gov/cra/qnadoc.htm.
29 See Toussaint-Comeau and Newberger (2015).


