

Risk Management in a Lower Interest Rate Environment
Introduction
Thank you, Dr. Winfree, for that kind introduction. It is a great pleasure to be here.
The past ten years have been challenging for the global economy. That’s certainly been true in the U.S. The Federal Reserve Act charges the Fed with promoting financial conditions that will help the economy achieve maximum employment and price stability. In pursuit of these goals during the financial crisis, the Federal Open Market Committee (FOMC) drastically reduced the short-term interest rate that it controls, the federal funds rate. Indeed, we brought the rate all the way to its zero lower bound (ZLB) in December 2008.1 With the economy improving and inflation moving back toward target, the Committee has been able to move the federal funds rate off the ZLB. Admittedly, these adjustments have been small so far. We’ve only made two moves — one in December 2015 and one this past December2 — and the target range for the funds rate is still just 1/2 to 3/4 percent.
What about the future? In my remarks today, I will discuss my outlook for the U.S. economy and share my views on U.S. monetary policy.
Naturally, the views I express will be my own and do not necessarily reflect those of my colleagues on the FOMC or in the Federal Reserve System.
To begin, let me lay out my main points:
1. I envision the U.S. will experience sound economic growth and a healthy labor market over the next several years. The achievement of the Fed’s employment goal looks to be on course.
2. Inflation has been too low for too long, but we’ve seen some promising signs that it may be poised to return to the 2 percent target that the Fed judges to be consistent with its price stability mandate.3 Still, downside risks remain.
3. An important structural feature to keep in mind when calibrating the future path for monetary policy is that the so-called equilibrium, or neutral, level of interest rates4 is likely a good deal lower than it has been in the past.
4. In a world characterized by lower equilibrium interest rates, there is less room to reduce policy rates when, sometime in the future, the need will inevitably arise. Accordingly, risk-management considerations point policy toward lowering the chance that policymakers again will face difficult ZLB outcomes in the future. This is an important reason why I favor taking a gradual path for the adjustment of the funds rate back toward its long-run level.
Now, for the details.
Economic outlook
Let me start by briefly sharing my outlook for the U.S. economy. After a sluggish first half in 2016, economic activity accelerated in the second half, and real gross domestic product (GDP) ended up increasing 1.9 percent over the year (on a fourth-quarter-to-fourth-quarter basis). I expect growth to run a bit higher over the next couple of years — somewhere in the 2 to 2-1/2 percent range, boosted in part by expansionary fiscal policies.
1. Moderate GDP growth

A strong U.S. consumer is the linchpin of this forecast. The most important factor supporting household spending is the substantially improved labor market over the past four years. The unemployment rate currently stands at 4.7 percent — less than half its 2009 peak. Over the past year, job growth has averaged around 180,000 per month. This is well in excess of what my staff estimates to be the pace necessary to keep up with population growth. Wage growth has picked up, too. These gains have raised incomes and buoyed consumer confidence. Accommodative monetary policy has provided additional backing to the spending wherewithal of households. All of these factors should continue to support consumer spending over the medium term. In addition, households may be seeing a cut in taxes before very long.
Outside the consumer sector, improvement has been more uneven. Business fixed investment has been weak. There are understandable reasons for this: The rising value of the U.S. dollar has been an obstacle to manufacturers and other firms with an international presence, and low and variable oil prices have held back energy exploration and drilling. Even after accounting for these factors, recent capital spending has still been weak. Fortunately, incoming indicators are pointing to some recovery in spending, and business optimism generally has increased of late, which could further boost capital spending.
As I said earlier, I see growth in the U.S. running in the range of 2 to 2-1/2 percent for the next two to three years. For reference, this pace is modestly stronger than my assessment of the underlying growth trend, and this will support continued improvement in the labor market.
2. Further reduction in the unemployment rate
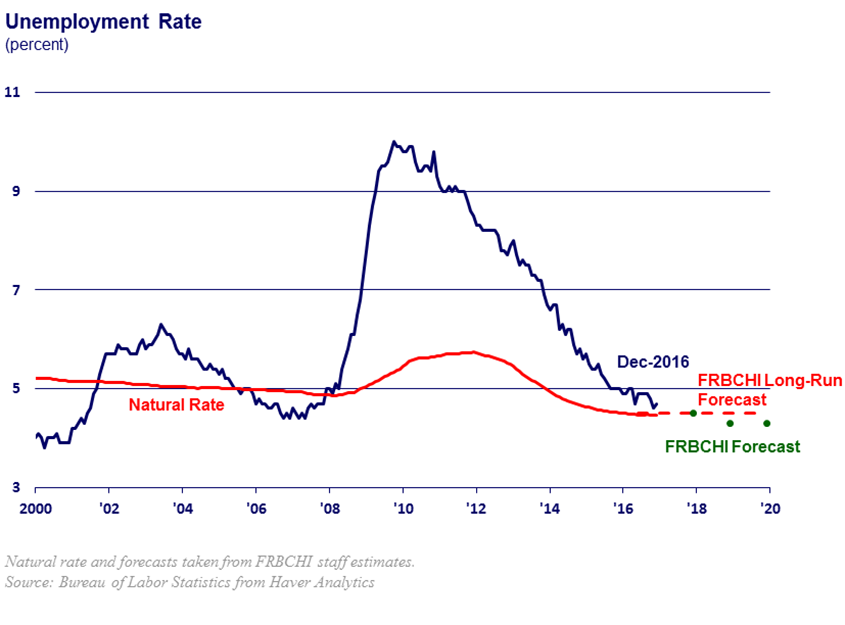
In particular, I expect the unemployment rate to decline further over the next three years, to reach 4-1/4 percent by the end of 2019. My current estimate of the natural, or equilibrium, rate of unemployment is 4.7 percent;5 I think demographic factors will steadily lower this natural rate to about 4-1/2 percent by 2020. Therefore, I expect that under appropriate monetary policy the unemployment rate will undershoot the natural rate a bit over the medium term. Modestly undershooting the unemployment goal for a time will help boost inflation toward its target.
There are risks to my growth outlook. On the downside, the weak international economy could weigh further on exports. But on the upside, most analysts expect the new administration and Congress to enact a set of fiscal policy changes that will be stimulative on net. That is the main reason why I boosted my projection for growth in 2017 and 2018 by about 1/4 percentage point per year. My staff and I only made a modest change. It is early in the legislative process, and we need more details. Nevertheless, there certainly is a possibility of larger temporary stimulus, as well as some policies that might influence longer-run growth.
Inflation outlook and risks
Turning to my outlook for inflation, I am more cautious. The FOMC has an inflation target of 2 percent as measured by the annual change in the Price Index for Personal Consumption Expenditures (PCE). However, over the course of the recovery, PCE inflation has averaged only 1-1/2 percent. To get a sense of where total inflation is likely to be headed over the next year or so, I look at so-called core inflation, which strips out the volatile food and energy components. And here the record is not any better. Core PCE inflation also has averaged about 1-1/2 percent since the recovery began.6 And although core inflation moved up some last year, it has been stuck around 1.7 percent for the past several months.
3. Gradual rise in inflation to 2% target

Still, inflation expectations, which tend to anchor future inflation, may be headed back up to a range more consistent with our 2 percent objective. Also, tighter labor markets are feeding into somewhat higher wage growth. I expect this development to continue given the modest undershooting of the natural rate of unemployment in my economic outlook. Indeed, this undershooting is a positive feature of my forecast: It should help inflation move up to 2 percent. I also expect the effects of dollar appreciation to dissipate over the projection period. Given these factors, and assuming continued support from monetary policy, my baseline forecast is that both core and total inflation will move up to reach our 2 percent inflation target over the next three years.
With all that said, I see some downside risks to this inflation forecast. The U.S. and other advanced economies have experienced below-target inflation rates for several years. Given the disinflationary forces across the globe and the growth challenges faced by many countries, international developments may result in additional appreciation of the dollar. And while inflation expectations in the U.S. have moved up in recent months, they remain quite low when measured against historical norms. Similarly, despite some nascent evidence of rising wage growth, progress has been slow.
I would note that my outlook is pretty mainstream. Notably, four times a year the FOMC releases its Summary of Economic Projections (SEP), which presents FOMC participants’ forecasts of key economic variables over the next three years and for the longer run.7 The median FOMC forecast from the December SEP had real GDP growing slightly above its longer-run rate for the next three years and the unemployment rate running at about 4.5 percent from late this year through 2019 — a bit below the SEP’s median estimate of 4.8 percent for its longer-run rate. My colleagues are a tad more optimistic about inflation than I am, with the median participant expecting core PCE inflation to reach 2 percent by the end of 2018, about a year before I do.
Monetary policy in a low interest rate world
What does this outlook mean for monetary policy? In the December SEP, the median FOMC participant’s assumption for appropriate monetary policy has three 25 basis point increases in the federal funds rate in each of the next three years, finishing 2019 close to its long-run neutral level of 3 percent.8 It will be a welcome development to end this low interest rate cycle by 2019. But the low 3 percent neutral level still presents challenges.
4. Gradual policy normalization

Business cycles are intrinsic to the economy. So, at some future date — hopefully, far in the future — the U.S. will find itself at risk of heading into a recession. When this has happened in the past, the FOMC has used its conventional policy tools and cut the federal funds rate by 500 basis points or more. Just look at the policy cycles beginning in 1983, 1990–92, 2000–03 and 2007–08.
What’s different today is that there is a near consensus among economists that the trend rate of economic growth in the U.S. is much lower now than it was during those earlier episodes. For example, our Chicago Fed estimate for trend growth is currently 1-3/4 percent.9 Standard economic theory teaches that, all else being equal, in a low-trend-growth environment, short-term real interest rates will be lower. At the moment, the assumption that the equilibrium, or neutral, real rate is as high as 1 percent may be optimistic. But let’s go for now with that 1 percent number for the sake of discussion. Together, this value and the FOMC’s symmetric 2 percent inflation target point to a nominal neutral federal funds rate of around 3 percent.10
5. Federal funds rate

If monetary policy begins the next easing cycle from this 3 percent neutral rate, monetary policymakers would be able to cut the federal funds rate by only 300 basis points before hitting the zero lower bound — 200 basis points short of the 500 or so reduction implemented in other slowdowns. To be fair, most of these earlier rate cuts started with the fed funds rate above its long-run neutral level. But that doesn’t change the fact that a 3 percent neutral funds rate presents an enormous challenge if conventional monetary policy alone is deployed to help return the economy to target inflation and maximum employment.
Of course, at the zero lower bound, central banks have unconventional policy tools that can provide additional policy accommodation. In the U.S., we dealt with the ZLB impediment in a number of ways, including the purchases of large volumes of Treasury bonds and government-sponsored enterprise (GSE) securities and the provision of forward guidance about how long the federal funds rate would stay very low.11 These were done to lower long-term borrowing rates — which never fell to zero — and to assure the public that we were committed to meeting our dual mandate goals.
I think the evidence strongly supports the effectiveness of the Fed’s use of unconventional policy tools during the Great Financial Crisis. An eminent Great Depression scholar, former Federal Reserve Chairman Ben Bernanke, concluded that the shocks hitting the U.S. economy in 2007–08 were likely larger than those faced in 1929–32.12 But with the help of the extraordinary monetary, fiscal and supervisory policies made in response to crisis, the unemployment rate’s disastrous increase to 10 percent by 2009 was still much smaller than the 25 percent peak rate of the 1930s.
Nevertheless, the effects of nonconventional policies on the real economy are more uncertain than those of our conventional tools. So too are their potential costs. Indeed, the recent aggressive use of unconventional tools has also highlighted differential effects of our actions on households and businesses and other potential collateral costs, which have led to wide criticism of these tools. All in all, while extremely useful when necessary, the nonconventional policies are second-best relative to our usual instruments. But as long as equilibrium interest rates remain low, central bankers will face uncomfortably large odds of having to cut conventional policy rates to zero and then turn to these second-best tools. So unless equilibrium real interest rates move up substantially, ZLB risks will remain higher than we policymakers should feel comfortable with.
Let me amplify on these points.
Potential output growth is lower
As I mentioned earlier, my research staff estimates that potential GDP growth is currently about 1-3/4 percent, with only a little upside potential over the next few years as various economic headwinds fade. For U.S. living standards and global prospects, this is a remarkably troublesome assessment. By comparison, the Congressional Budget Office (CBO) estimates that over the 1960s, ’70s, ’80s and ’90s, real potential output growth averaged 3.5 percent.13
6. Slower potential output growth rate

What would it take to achieve such sustainably high growth today? The long-run sustainable growth rate in an economy is determined by the growth rates in its labor input and the productivity of that labor. This is simple arithmetic. So, if you want 3 percent or 4 percent economic growth to be sustainable, you need more sustainable growth in labor input and in productivity.
Now, unfortunately, we’ve seen a decline in both of these factors relative to the 1982–2007 period. The trend in labor force participation has been declining for over 15 years. Baby boomers are retiring. Men have less attachment to the workforce as they grow older. Female participation rates that were increasing for so long have plateaued. And participation by 18 to 24 year olds has declined. This won’t turn around soon. It just isn’t possible to instantly birth a large cohort of qualified 25 year olds.
We’ve also seen slower growth in labor productivity. Improvements in labor quality are no longer adding much to productivity in the aggregate. Gains in educational attainment and experience in the labor force have plateaued. Business investment has been relatively weak, resulting in only modest capital deepening. And the pace of technological increase appears to have slowed. After a surge in capital embodied technological change in the late 1990s and strong gains from incorporating that technology and better business practices in the early 2000s, total factor productivity14 growth seems to have reverted back toward the slow pace of the 1973–95 period.15
Of course, the U.S. economy could experience a burst of 4 percent GDP growth for a year or two, maybe more, for a variety of reasons. But unless that’s accompanied by a sustainable structural improvement in labor and productivity growth, such GDP growth would eventually put strong pressure on resources and drive up wages and prices. Clearly, in this situation, financial markets and the Fed’s focus on our dual mandate responsibilities would ultimately lead to more restrictive financial conditions.
Slower growth implies lower short-term real interest rates
Why did I spend so much time on lower potential output growth in a monetary policy discussion? Well, it’s because of what I noted earlier and many others have pointed out too: Standard economic theory indicates that all else being equal, real neutral interest rates will be lower in a lower-trend-growth regime. This is because the long-run average rate of return on investment projects is tied to the trend rate of growth of the economy. In turn, these returns determine the interest rates borrowers are willing and able to pay to finance those projects. So lower trend growth means lower returns and lower equilibrium interest rates.
7. Lower equilibrium real interest rates

There are other forces that influence equilibrium interest rates, both lower and higher. For example, strong global demand for safe assets relative to the supply of those assets has been pushing rates lower. Even before the lower trend in U.S. economic growth was evident, the unmet demand for safe assets was noted as a factor driving down long-term interest rates. I can refer you to then Fed Governor Bernanke’s (2005) global saving glut hypothesis and then Fed Chair Alan Greenspan’s (2005) comments on the long-term Treasury rate conundrum for details about how the lack of safe investment opportunities in high-saving emerging markets has contributed to reduced interest rates in advanced economies.
Of course, it’s possible that fiscal expansion, lower tax collections and bigger U.S. government budget deficits could increase the supply of safe assets. But unless these deficits are very large, the effect on equilibrium rates would likely be modest. An increase in stable and safe investment opportunities in emerging market economies could also boost rates, and so could a strong global economy, though such developments likely would be slow to unfold.
Note that I did not mention monetary policy as a primary determinant of the equilibrium real interest rate. This is because the effects of monetary policy on the long-run growth potential of the economy or the saving preferences of economic players are small and indirect. True, the Fed sets the federal funds rate, but with the economy at full employment and inflation at target, the Fed's job is to simply guide the target fed funds rate to the equilibrium determined by these nonmonetary factors.
And, for now, the balance of these nonmonetary factors remains tilted toward lower real rates. For example, by one estimate made by colleagues Thomas Laubach and John Williams and shown here, the real neutral federal funds rate averaged 3.4 percent over the 1970s, 1980s and 1990s in the U.S.;16 today, the real neutral fed funds rate is estimated to be only 20 basis points and will likely remain low for some time to come.17 That’s a 325 basis point difference. Taken at face value, this means that from comparable starting points, conventional monetary policy has 325 basis points less room to react to negative aggregate demand shocks than it had during the earlier period. Now, it is true that there are many reasons why the equilibrium real rate is likely unusually low right now. Still, under many forecasts, including those by the FOMC, the equilibrium real fed funds rate is expected to rise only to about 1 percent over the next few years. That’s still almost 250 basis points lower than the Laubach–Williams estimates for the 1970s. This is a big deal. And it demands an approach to policy setting that explicitly entertains contingency planning against the risk of running back into the zero lower bound.
Managing risks in setting monetary policy
Many policy analysts feel highly confident of their views, even when economic conditions are unusual by historical standards. I’m no exception. However, when navigating in uncharted territory, I think it’s important for everyone trying to market their policy proposals to ask themselves publicly the following questions: What if I’m wrong about my projection? What kind of robust policies can I consider to manage against the risks associated with unexpected outcomes?18
8. Risk management considerations
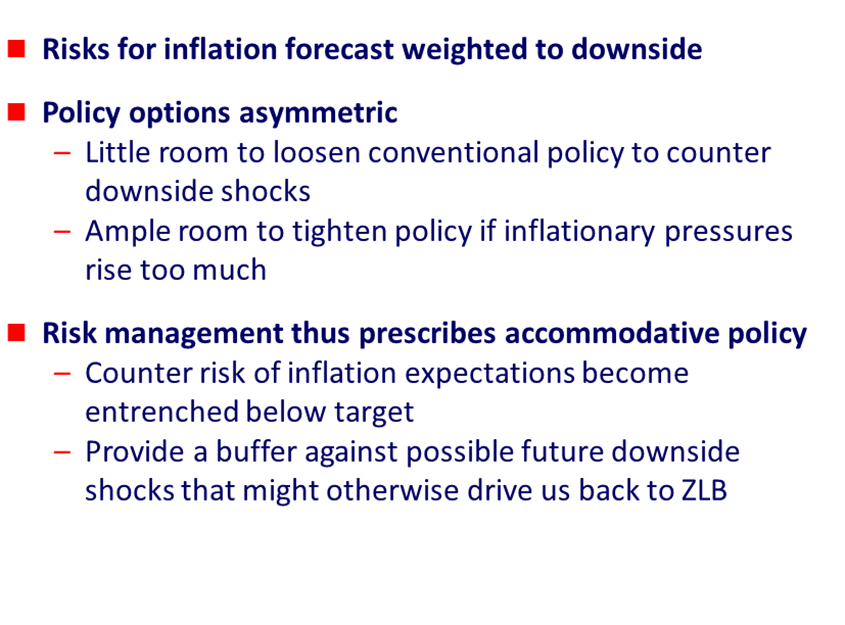
With regard to current risk-management issues, many have made the following argument, and so I’ll just state it briefly. Central bankers have a pretty good handle on how to address rising inflation concerns: Use conventional policies and raise short-term policy interest rates. But when inflation is too low inflation and our policy rate is stuck at the zero lower bound, we struggle to provide adequate accommodation with unconventional policies. Because of this asymmetry, risk-management policies would favor skewing policy today to lower the chances of facing more difficult zero-lower-bound outcomes in the future. I think this strategy is important now. And it will likely continue to be important as we adjust to a low equilibrium interest rate environment. With these considerations in mind, I believe that appropriate policy calls for a slow pace of normalization in order to give the real economy an adequate growth buffer to withstand downside shocks that might otherwise drive us back down to the ZLB.
There is another facet to consider, namely, Fed credibility. When making their decisions, economic agents — households and businesses alike — depend on the ability of policymakers to reliably obtain their objectives. If policymakers are unable to achieve their mandated objectives within a reasonable period of time, then credibility will suffer and make those goals even more difficult to achieve. Today, given how long we have been below our inflation objective, I believe the risks are greater that the public doubts our resolve to bring inflation up to 2 percent than they question our will to bring it back down if we were to overshoot 2 percent by a meaningful amount. So, in my opinion, preserving the Fed’s credibility currently requires providing sufficient accommodation to achieve our symmetric inflation objective and maximum employment. One aspect of this strategy is the willingness to accept a modest undershooting of our unemployment goal in order to insure meeting our inflation target. I think the international experiences in Japan and the eurozone show that it is cheaper and more effective to follow policies that establish this credibility before the ZLB looms large.
Of course, we would be in a better place if we had stronger sustainable output growth — both in the U.S. and abroad. Hopefully, nonmonetary policymakers, innovative businesses and hardworking households throughout the world will implement the new policies, develop the new technologies and gain the education and workplace skills that will support stronger growth in structural labor inputs and productivity. The resulting boost to potential output growth would yield rising equilibrium interest rates and important improvements in our many nations’ standards of living. Such success would also better allow monetary policy to become boring again and let monetary policymakers recede further into the background — something that I very much look forward to.
Thank you.
Notes
1 See Federal Open Market Committee (2008).
2 See Federal Open Market Committee (2015, 2016b).
3 This was first acknowledged in Federal Open Market Committee (2012b).
4 Equilibrium real interest rates are the rates consistent with the full employment of the economy’s productive resources. The equilibrium interest rate is sometimes called the “natural” or “neutral” interest rate.
5 The natural rate of unemployment is the unemployment rate that would prevail in an economy making full use of its productive resources. Consequently, it is the rate of unemployment that would predominate over the longer run in the absence of shocks to the economy.
6 Specifically, except for a brief period at the beginning of 2012, core PCE inflation has been below 2 percent since the third quarter of 2008.
7 See Federal Open Market Committee (2016a).
8 The neutral, or equilibrium, federal funds rate is the funds rate associated with a neutral monetary policy (policy that is neither expansionary nor contractionary).
9 The median FOMC participant’s longer-run projection for growth is 1.8 percent. See Federal Open Market Committee (2016a).
10 The median FOMC participant placed the longer-run federal funds rate at 3.0 percent in December 2016. See Federal Open Market Committee (2016a).
11 Board of Governors of the Federal Reserve System (2015a, 2015b).
12 Financial Crisis Inquiry Commission (2011, p. 354).
13 Congressional Budget Office (2016).
14 Total factor productivity refers to the technologies and operational systems that businesses use to combine various inputs into outputs. In other words, it captures the residual growth in total output of the national economy that cannot be explained by the accumulation of measured inputs, such as labor and capital.
15 See Fernald (2016) for a discussion of changes in total factor productivity growth over time.
16 See Laubach and Williams (2003, 2016).
17 Laubach and Williams (2016) updated estimates of the baseline model described in Laubach and Williams (2003). The implications of a permanently lower rate until another shock arrives is a consequence of the I(1) statistical framework being estimated.
18 I like to think that the FOMC’s December 2012 threshold expansionary forward guidance with an inflation safeguard was a good example of such a policy design. As stated in the Federal Open Market Committee (2012a) press release announcing the policy, the “Committee decided to keep the target range for the federal funds rate at 0 to 1/4 percent and currently anticipates that this exceptionally low range for the federal funds rate will be appropriate at least as long as the unemployment rate remains above 6-1/2 percent, inflation between one and two years ahead is projected to be no more than a half percentage point above the Committee’s 2 percent longer-run goal, and longer-term inflation expectations continue to be well anchored.” See the press release introducing the policy for further details.
References
Bernanke, Ben, 2005, “The global saving glut and the U.S. current account deficit,” remarks of Federal Reserve Governor at the Sandridge Lecture, Virginia Association of Economists, Richmond, VA, March 10.
Board of Governors of the Federal Reserve System, 2015a, “What were the Federal Reserve's large-scale asset purchases?,” Current FAQs, December 22.
Board of Governors of the Federal Reserve System, 2015b, “What is forward guidance and how is it used in the Federal Reserve's monetary policy?,” Current FAQs, December 16.
Congressional Budget Office, 2016, An Update to the Budget and Economic Outlook: 2016 to 2026, report, Washington, DC, August.
Federal Open Market Committee, 2016a, Summary of Economic Projections, Washington, DC, December 14.
Federal Open Market Committee, 2016b, press release, Washington, DC, December 14.
Federal Open Market Committee, 2015, press release, Washington, DC, December 16.
Federal Open Market Committee, 2012a, press release, Washington, DC, December 12.
Federal Open Market Committee, 2012b, press release, Washington, DC, January 25.
Federal Open Market Committee, 2008, press release, Washington, DC, December 16.
Fernald, John G., 2016, “Reassessing longer-run U.S. growth: How low?,” Federal Reserve Bank of San Francisco, working paper, No. 2016-18.
Financial Crisis Inquiry Commission, 2011, The Financial Crisis Inquiry Report, Washington, DC.
Greenspan, Alan, 2005, testimony of the Federal Reserve Chair before the U.S. Senate, Committee on Banking, Housing and Urban Affairs, Washington, DC, February 16.
Laubach, Thomas, and John C. Williams, 2016, Laubach and Williams Updated Estimates, Federal Reserve Bank of San Francisco, data file, November 29.
Laubach, Thomas, and John C. Williams, 2003, “Measuring the natural rate of interest,” Review of Economics and Statistics, Vol. 85, No. 4, November, pp. 1063–1070.


