

Summary
Farmland values for the Seventh Federal Reserve District were down 1 percent in the second quarter of 2019 from a year earlier. However, values for “good” agricultural land in the District were unchanged from the first quarter to the second quarter of 2019, according to a survey of 157 bankers. Excessive precipitation in the spring led to historic flooding and widespread planting delays across most of the Midwest. Reporting bankers indicated that 69 percent of their borrowers were at least modestly affected by extreme weather events in the first half of 2019. Despite concerns about the effects on farming from adverse weather and trade disruptions, 83 percent of survey respondents expected District agricultural land values to be unchanged during the third quarter of 2019 (only 2 percent expected them to increase, while 15 percent expected them to decrease).
In the second quarter of 2019, agricultural credit conditions for the District were weaker compared with a year ago once again. Repayment rates for non-real-estate farm loans were lower in the second quarter of 2019 than a year earlier. The portion of the District’s agricultural loan portfolio reported as having “major” or “severe” repayment problems (6.2 percent) had not been higher in the second quarter of a year since 1999. In addition, renewals and extensions of non-real-estate farm loans in the District were up from a year ago. For the April through June period of 2019, the demand for non-real-estate farm loans was higher than a year earlier, but the availability of funds for lending by agricultural banks was lower. For the second quarter of 2019, the District’s average loan-to-deposit ratio was 80.2 percent. Average nominal interest rates for agricultural real estate and operating loans moved down during the second quarter of 2019, while the average rate for feeder cattle loans edged up.
Farmland values
Overall, District farmland values were the same in the second quarter of 2019 as in the first quarter. Yet, there was a year-over-year decrease of 1 percent in District agricultural land values (the first such decline since the third quarter of 2017). Iowa and Michigan had year-over-year dips in their farmland values, but Illinois, Indiana, and Wisconsin farmland values held steady (see map and table below, but note that too few Michigan bankers responded to report a numerical change in farmland values). After being adjusted for inflation with the Personal Consumption Expenditures Price Index (PCEPI), District farmland values were down 2 percent in the second quarter of 2019 from the second quarter of 2018; the streak of year-over-year declines in real farmland values was extended to five full years (see chart 1).

1. Year-over-year real changes in Seventh District farmland values, by quarter
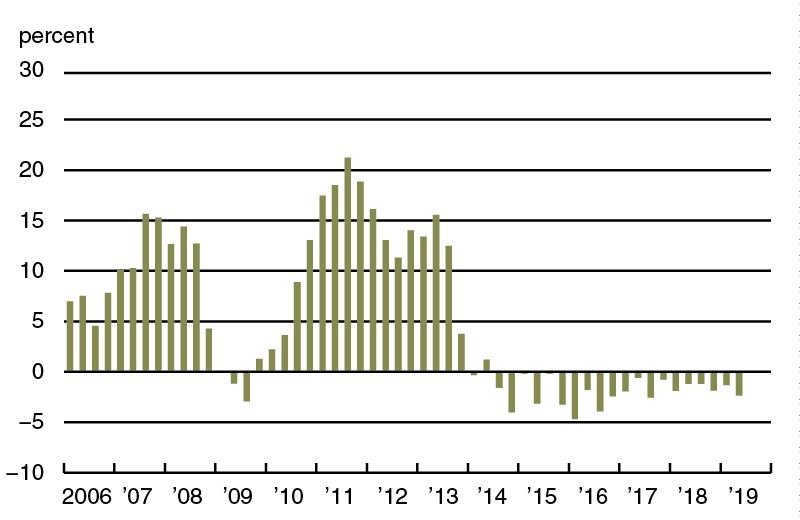
Muted expectations for farm income continued to be a factor in sliding real farmland values. A significant portion of Midwest farm income depends on the production of two primary crops: corn and soybeans. Because of unusual wetness, many farmers had to delay planting corn and soybeans this year, and a much higher share of fields than normal were not even planted in 2019. According to responding bankers, 45 percent of their agricultural borrowers were modestly affected by bad weather conditions in the first half of the year and another 24 percent were significantly affected. (Borrowers in Illinois, Indiana, and Michigan faced the worst of the weather-related repercussions.) So, corn and soybean yields are expected to drop this year to well below their long-term trends. The expected loss of corn and soybean output was made even worse by spotty early summer precipitation. Based on U.S. Department of Agriculture (USDA) data, District corn and soybean crop conditions in June and July were inferior compared with those of a year ago.
With lower yields expected across the Midwest, corn and soybean prices should adjust upward. Indeed, corn and soybean prices climbed 9.6 percent and 3.6 percent, respectively, in June from May (see final table). However, tariffs on agricultural exports are limiting how much these crop prices can increase. It seems unlikely that these prices will rise enough to compensate for lost output, so the profitability of many corn and soybean farms will almost surely fall from their 2018 levels—possibly by a lot for some. Moreover, feed costs have risen enough to squeeze the profitability of livestock producers. Many of them were already facing prices for their products that were lower than a year ago (with milk prices being an exception). The USDA’s June index of prices received for livestock products was down 2 percent from a year earlier (see final table). In response to falling exports due to the tariffs, the USDA announced another iteration of the Market Facilitation Program, which could provide up to $16 billion in payments to farmers with eligible acres or livestock.
Credit conditions
Agricultural credit conditions in the second quarter of 2019 deteriorated relative to a year earlier, continuing a pattern going back to the fourth quarter of 2013. Overall, repayment rates for non-real-estate farm loans were lower in the second quarter of 2019 compared with the second quarter of 2018, yet their index was at its highest value since the third quarter of 2014. The index of loan repayment rates was 74 for the second quarter of 2019 (7 percent of responding bankers noted higher rates of loan repayment than a year ago and 33 percent noted lower rates). At 6.2 percent of the District loan portfolio, the share of farm loans with “major” or “severe” repayment problems was last higher in 1999 (as measured in the second quarter of every year). Also, renewals and extensions of non-real-estate farm loans during the April through June period of 2019 were higher than during the same period of a year ago, as 40 percent of survey respondents reported more of them and 3 percent reported fewer of them.

bBankers responded to each item by indicating whether conditions in the current quarter were higher or lower than (or the same as) in the year-earlier quarter. The index numbers are computed by subtracting the percentage of bankers who responded “lower” from the percentage who responded “higher” and adding 100.
Note: Historical data on Seventh District agricultural credit conditions are available online.
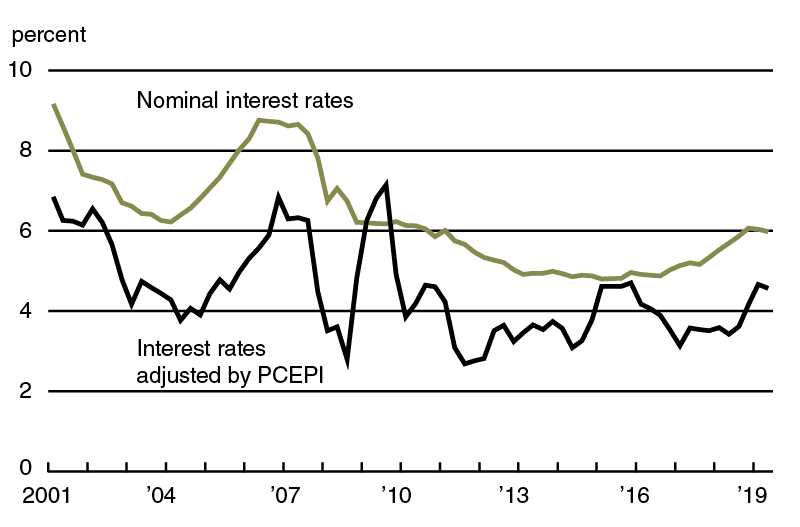
In the second quarter of 2019, demand for non-real-estate loans was still up from a year ago. With 34 percent of survey respondents noting demand for non-real-estate loans above the level of a year ago and 15 percent noting demand below that of a year ago, the index of loan demand was 119 for the second quarter of 2019. Notably, this index value was somewhat lower than those of the past few quarters. On the whole, District banks had less funds available to lend in the second quarter of 2019 than a year ago. Given that 8 percent of responding bankers reported their banks had more funds available to lend and 15 percent reported their banks had less, the index of funds availability was 93 for the second quarter of 2019. With demand for non-real-estate loans up from a year ago and funds available to lend down, the District’s average loan-to-deposit ratio for the second quarter of 2019 set a record for the survey at 80.2 percent (though it was still 2.7 percentage points below the average level desired by the responding bankers). Credit tightening continued unabated in the second quarter of 2019, as 25 percent of the survey respondents reported that their banks required larger amounts of collateral than a year ago and none reported that their banks required smaller amounts. As of July 1, 2019, the District’s average nominal interest rate on new feeder cattle loans had risen to 6.14 percent, while its average nominal interest rates on farm operating and real estate loans had fallen to 5.98 percent and 5.39 percent, respectively. After being adjusted for inflation with the PCEPI, average interest rates on farm operating and real estate loans decreased during the second quarter of 2019 for the first time since the second quarter of 2018. Indeed, since 2010, farm budgets have generally benefited from historically low real interest rates on operating loans, even though these rates, on average, have risen some from last year (see chart 2).
2. Quarterly average interest rates on Seventh District farm operating loans
Over the first half of 2019, District banks made a higher-than-normal amount of farm operating loans, but a lower-than-normal amount of agricultural real estate loans, according to responding bankers. In the first six months of 2019, merchants, dealers, and other input suppliers reportedly expanded their agricultural lending. According to survey respondents, during the January through June period of 2019, there were nearly normal levels of farm loans issued by the Farm Credit System and life insurance companies.
Looking forward
Even with crop output expected to fall, most survey respondents anticipated District farmland values would be stable in the short term, as 83 percent of responding bankers projected no change in farmland values for the third quarter of 2019 (15 percent projected them to decrease, while only 2 percent projected them to increase). Survey respondents projected volumes of non-real-estate farm loans (notably, operating loans and loans guaranteed by the Farm Service Agency of the USDA) to increase in the third quarter of 2019 from year-earlier levels; however, they projected the volume of farm real estate loans to decrease.
An Iowa respondent noted that “farmers are more optimistic with the recent surge in prices and the government payments.” Crop conditions in Iowa were looking much better than those in Illinois, Indiana, and Michigan, which may help explain the positive commentary. In contrast, an Illinois banker reported that the uncertainty surrounding how much smaller this year’s harvest will be compared with last year’s (along with the associated price responses) “has everybody in wait-and-see mode.”

Sources: Author’s calculations based on data from the U.S. Department of Agriculture, U.S. Bureau of Labor Statistics, and the Association of Equipment Manufacturers.
Improving Midwest Agriculture and the Environment
On November 20, 2019, the Federal Reserve Bank of Chicago will hold a conference to examine environmental issues related to Midwest agriculture. Details and registration are available online.


