

Summary
For 2018, annual farmland values in the Seventh Federal Reserve District were steady overall. Yet, values for “good” agricultural land in the fourth quarter of 2018 were up 1 percent from the third quarter, according to 183 survey respondents representing agricultural banks across the District. Although 75 percent of the responding agricultural bankers expected farmland values to be stable during the January through March period of 2019, nearly all of the rest expected farmland values to move down.
Deteriorating agricultural credit conditions continued to affect the District in the fourth quarter of 2018. Repayment rates on non-real-estate farm loans decreased in the October through December period of 2018 relative to the same period of 2017, and rates of loan renewals and extensions increased. Even so, about the same percentage (2.4 percent) of current agricultural borrowers were not likely to qualify for operating credit at the survey respondents’ banks in 2019 as in 2018. Non-real-estate loan demand in the fourth quarter of 2018 climbed from the previous year’s level, while funds available for lending were slightly lower than a year ago. The average loan-to-deposit ratio for the District (79.0 percent) was higher than a year earlier. Average interest rates on farm operating loans and farm real estate loans had moved up by the end of 2018 to levels not seen since 2010 and 2011, respectively.
Farmland values
For 2018, the District saw no annual change in “good” farmland values, on balance. That is, the District’s agricultural land values in the fourth quarter of 2018 were largely the same as a year ago (see table and map below). For the fourth quarter of 2018, there were no year-over-year changes in agricultural land values in Illinois, Indiana, and Wisconsin; Iowa’s farmland values moved down from a year earlier, while Michigan’s apparently moved up (too few Michigan bankers responded to report a numerical change in farmland values). The District’s farmland values were up 1 percent in the fourth quarter of 2018 relative to the third quarter. Illinois’s and Indiana’s agricultural land values rose in the fourth quarter of 2018 from the third quarter, but Wisconsin’s fell and Iowa’s were unchanged.

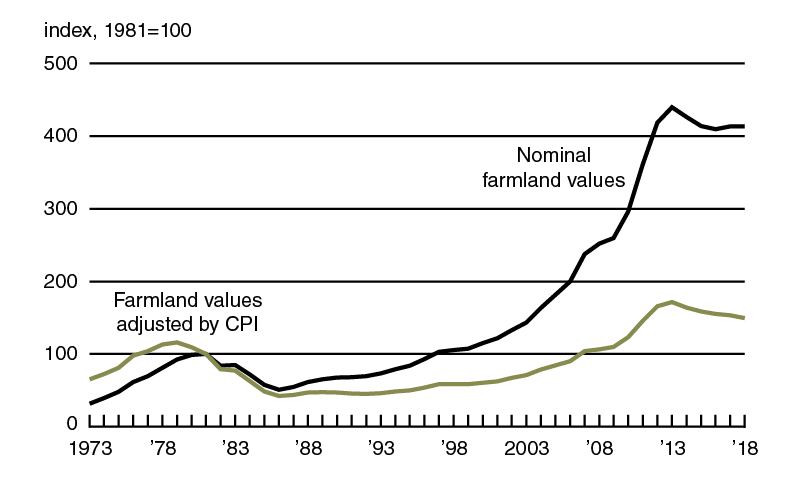
After accounting for inflation, the District actually experienced a yearly decrease of 2 percent in farmland values for 2018 (see chart 1). This was the fifth straight annual real decline in District farmland values—the longest downturn since the 1980s. The District’s farmland values fell 13 percent in real terms from their peak in 2013 to the end of 2018. But the decrease in agricultural land values over this span was just 6 percent in nominal terms (see chart 2).
1. Annual real change in Seventh District farmland values

2. Indexes of Seventh District farmland values
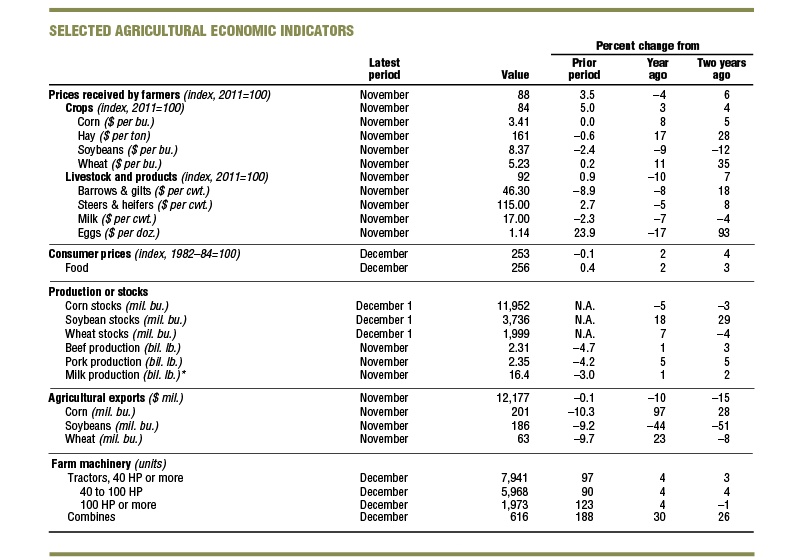
Stellar yields for District cropland supported farmland values in 2018. Based on calculations using U.S. Department of Agriculture (USDA) data, the District states’ corn yield set a record (195 bushels per acre in 2018, up 0.6 percent from 2017) for the third consecutive year. Moreover, the District states’ soybean yield bounced back to set a record (58.8 bushels per acre in 2018, up 7 percent from 2017). Harvested acreage for both crops was also up relative to 2017. Thus, corn and soybean production for the five District states rose 0.9 percent and 7.5 percent, respectively, in 2018.
According to updated USDA data, national soybean production in 2018 hit a record 4.54 billion bushels—3 percent higher than in 2017. U.S. corn output of 14.4 billion bushels for 2018 was the third largest ever, but down 1.3 percent from 2017. Given plentiful crop supplies and ongoing trade disputes, the USDA projected the following ranges of prices for the 2018–19 crop year: $3.35 to $3.85 per bushel for corn and $8.10 to $9.10 per bushel for soybeans. When calculated with the midpoints of these price intervals, the estimated revenues from the 2018 District harvest would be up 9.6 percent for corn relative to 2017, but down 1.7 percent for soybeans. This estimate for revenues from soybean production would improve when taking government assistance into account. An Iowa banker remarked, “The soybean payment as a result of the tariffs is a big help.” Under the Market Facilitation Program (MFP) administered by the USDA’s Farm Service Agency (FSA), soybean prices would essentially be raised by $1.65 per bushel (whereas corn prices would be bumped up only a penny per bushel). Given that 40 percent of 2018 soybean production was based in the District states, farm income in these five states should get an outsized boost from MFP payments.
Dairy operations continued to struggle, according to respondents primarily from Michigan and Wisconsin. One Wisconsin banker said, “Dairy is the most stressed sector—financial stress and the tough January weather have many of our farmers ready to sell out.” Another Wisconsin banker reported, “There was an increase in voluntary liquidations this past year.” Milk prices and livestock prices in general were down in November 2018 from a year earlier. Moreover, the index of prices for livestock and associated products in November 2018 was 10 percent lower than a year ago (see final table). There were some trends, however, counteracting the downward pull on farmland values from declining livestock prices: Survey respondents mentioned that available farmland for sale continued to be in limited supply, plus nonfarm investors were bidding up farmland values in some areas.
Credit conditions
District agricultural credit conditions deteriorated further in the fourth quarter of 2018. Repayment rates in the final quarter of 2018 were lower than in the same period of the previous year, with 3 percent of survey respondents reporting higher rates of loan repayment and 44 percent reporting lower rates. At 59 for the final quarter of 2018, the index of non-real-estate farm loan repayment rates has remained below 100 for five straight years. This means that repayment rates have been weakening for half a decade. Furthermore, the share of the District farm loan portfolio indicated as having “major” or “severe” repayment problems was 6.6 percent in the fourth quarter of 2018—the highest such share since 1999. With a growing percentage of borrowing encountering repayment problems, non-real-estate farm loan renewals and extensions in the fourth quarter of 2018 were higher than in the fourth quarter of 2017, as 40 percent of survey respondents reported more of them and just 2 percent reported fewer.
Some bankers linked financial difficulties to pressures from higher agricultural interest rates. An Iowa banker said, “The rising interest rate environment is beginning to cause repayment problems.” As of January 1, 2019, the average interest rates for farm operating loans (6.07 percent) and feeder cattle loans (6.13 percent) were at their highest levels since the second and third quarters of 2010, respectively. The average interest rate for agricultural real estate loans (5.61 percent) was last higher during the second quarter of 2011. Also, there was additional tightening of credit standards relative to a year ago, as 44 percent of the survey respondents reported their banks tightened credit standards for agricultural loans in the fourth quarter of 2018 relative to the fourth quarter of 2017 and 56 percent reported their banks kept credit standards essentially unchanged. Likewise, 23 percent of responding bankers noted that their banks required larger amounts of collateral for customers to qualify for non-real-estate farm loans during the October through December period of 2018 relative to the same period of a year ago, and none required smaller amounts.
Respondents indicated that demand for borrowing for farm operations shifted higher during the October through December period of 2018 relative to the same period of 2017. With 44 percent of survey respondents reporting an increase in the demand for non-real-estate loans from a year ago and 9 percent reporting a decrease, the index of loan demand was 135 in the fourth quarter of 2018. Yet, funds availability was below the level of a year ago for the sixth consecutive quarter: The index of funds availability stood at 88 in the final quarter of 2018, with funds availability higher than a year ago at 7 percent of the survey respondents’ banks and lower at 19 percent. In line with these results, the District’s average loan-to-deposit ratio was higher than a year earlier; but at 79.0 percent, this ratio was still 3.2 percentage points below the average level desired by the responding bankers.
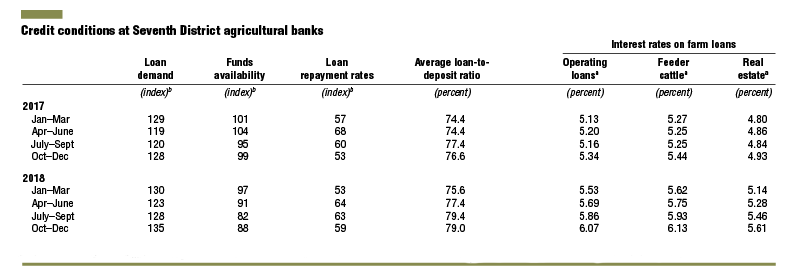
b Bankers responded to each item by indicating whether conditions in the current quarter were higher or lower than (or the same as) in the year-earlier quarter. The index numbers are computed by subtracting the percentage of bankers who responded "lower" form the percentage who responded "higher" and adding 100.
Note: Historical data on Seventh District agricultural credit conditions are available for download from the AgLetter webpage.
Looking forward
Somewhat surprisingly, at the start of 2019, survey respondents indicated that only 2.4 percent (a bit lower than a year ago) of their farm customers with operating credit in the year just past were not likely to qualify for new operating credit in the year ahead. Given record crop yields in Illinois and Indiana, these states had lower percentages of borrowers not likely to get new operating credit in 2019 (only 1.0 percent in Illinois and 2.2 percent in Indiana); however, this proportion was 2.8 percent in Iowa, 2.8 percent in Michigan, and 4.3 percent in Wisconsin. The struggles of dairies probably inflated this percentage for Wisconsin. Responding bankers expected non-real-estate agricultural loan volumes to be higher in the first quarter of 2019 relative to the same quarter of a year earlier, as volumes for operating loans and loans guaranteed by the FSA were forecasted to grow. By contrast, volumes for grain storage, farm machinery, feeder cattle, and dairy loans (as well as farm real estate loans to a lesser extent) were forecasted to be lower in the January through March period of 2019 relative to the same period of 2018. Reflecting this expected reduction in lending, as of the start of 2019, the majority of survey respondents anticipated capital expenditures by farmers would be lower in the year ahead compared with the year just ended (for the sixth year in a row).
The bulk of responding bankers (75 percent) expected farmland values to be stable in the first quarter of 2019, while 24 percent expected them to decline and only 1 percent expected them to rise. Hence, District agricultural land values are likely to be little changed in the first quarter of 2019.
* 23 selected states.
Sources: Author’s calculations based on data from the U.S. Department of Agriculture, U.S. Bureau of Labor Statistics, and the Association of Equipment Manufacturers.


