

Read our AgLetter Insights Q&A with author David Oppedahl for further insights into Seventh District farmland values and agricultural credit conditions described in this issue of AgLetter.
Summary
An annual increase of 6 percent in the Seventh Federal Reserve District’s agricultural land values in 2023 helped them reach a new peak, though the yearly gain shrank to a single digit. Values for “good” farmland in the District moved up 2 percent in the fourth quarter of 2023 from the third quarter, according to 129 agricultural bankers who responded to the January survey. Only 6 percent of the survey respondents expected farmland values to rise during the January through March period of 2024, with 17 percent expecting them to fall and 77 percent expecting them to be stable.
District agricultural credit conditions showed signs of deterioration during the fourth quarter of 2023. In the final quarter of 2023, repayment rates for non-real-estate farm loans were slightly lower than a year ago, plus loan renewals and extensions were higher than a year earlier. Just over 1 percent of agricultural borrowers were not likely to qualify for operating credit at the survey respondents’ banks in 2024 after qualifying in the previous year. Non-real-estate farm loan demand relative to a year ago picked up for the first time in 14 quarters. For the third time in a row, there were fewer funds available for lending than in the same quarter of the prior year at survey respondents’ banks in the final quarter of 2023. The average loan-to-deposit ratio for the District was nearly unchanged at 74.0 percent in the fourth quarter of 2023. At the end of 2023, the District’s average nominal interest rates on farm operating, feeder cattle, and farm real estate loans were roughly the same as at the end of the third quarter of last year and still at or near their highest levels in over 16 years. Even so, average real rates rose for all three kinds of loans tracked by the survey.
Farmland values
In 2023, the District saw an annual increase of 6 percent in its farmland values (see table and map below). With Illinois and Indiana having single-digit increases, annual agricultural land value changes for those two states were lower in 2023 than in 2022. Iowa had a small, single-digit annual decrease in farmland values for its first decline in the last five years. In contrast, Wisconsin had a double-digit annual increase in agricultural land values for 2023. Wisconsin bankers noted “nonfarm pressures still exist, notably solar” and “there is not a lot of farmland available for sale.” District farmland values increased 2 percent from the third quarter of 2023 to the fourth quarter.
Percent change in dollar value of “good” farmland
| October 1, 2023 to January 1, 2024 |
January 1, 2023 to January 1, 2024 |
|
|---|---|---|
| Illinois | +1 | +4 |
| Indiana | +2 | +7 |
| Iowa | –2 | –1 |
| Michigan | * | * |
| Wisconsin | +4 | +14 |
| Seventh District | +2 | +6 |
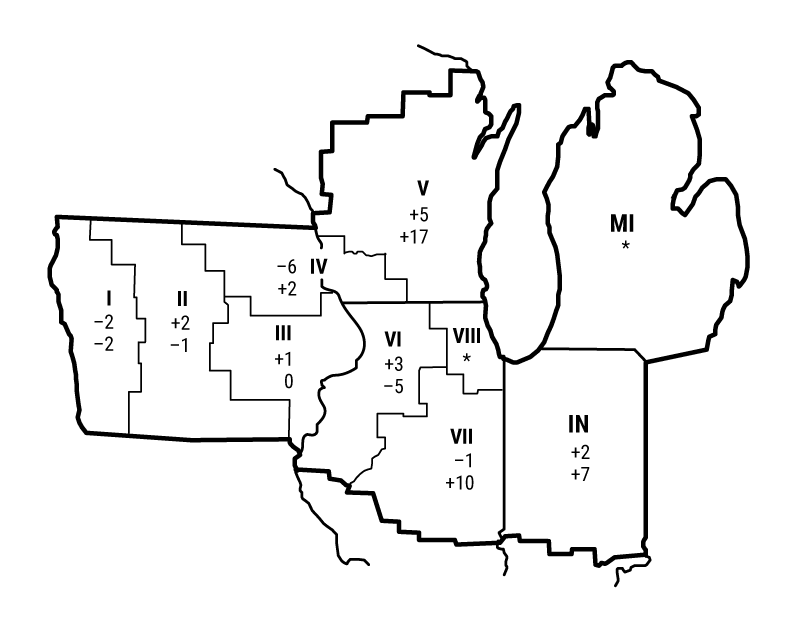
Top: October 1, 2023 to January 1, 2024
Bottom: January 1, 2023 to January 1, 2024
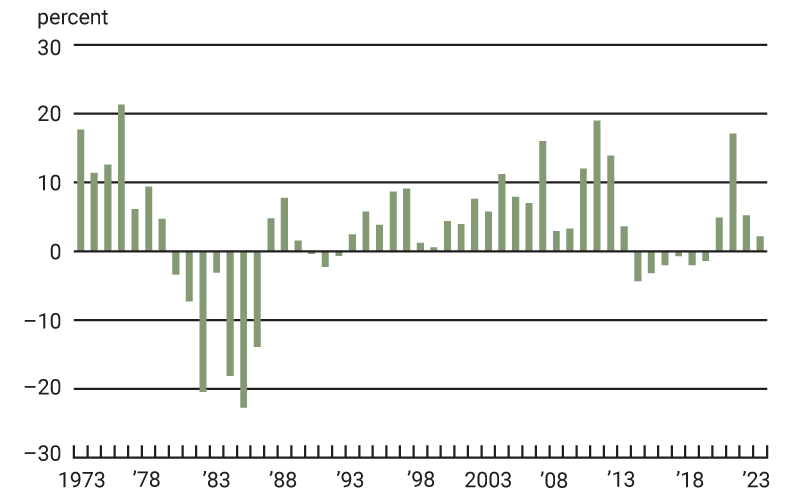
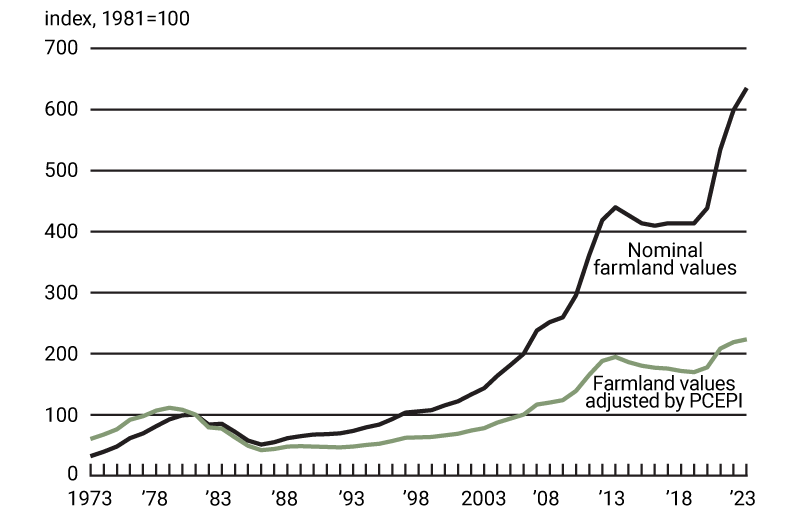
Adjusted for inflation by the Personal Consumption Expenditures Price Index (PCEPI), District farmland values had an annual increase of 2.2 percent in 2023, the smallest real increase seen after 2019 (see chart 1). District farmland values rose to a new peak in 2023, 15 percent above their 2013 peak in real terms and up 44 percent from their 2013 peak in nominal terms (see chart 2).
1. Annual real change in Seventh District farmland values
2. Indexes of Seventh District farmland values
A widespread drought in the District contributed to uncertainty about 2023 corn and soybean production, but the lack of moisture did not end up dramatically decreasing yields as had happened during the 2012 drought. Based on calculations using U.S. Department of Agriculture (USDA) data, District corn yields decreased slightly in 2023, down just 0.3 percent from 2022 yields; soybean yields actually edged up 0.4 percent. Harvested corn acres were up 3 percent in 2023 from 2022, while harvested soybean acres were down 4 percent. Corn production by District states increased 3 percent, reaching 6.78 million bushels, its highest level since 2016. Meanwhile, soybean production by District states fell almost 4 percent, to 1.75 million bushels. National corn stocks increased 12 percent from 2022, while soybean stocks decreased almost 1 percent (see final table). The increase in corn stocks led to a decline in the USDA projected prices for the 2023–24 crop year, which fell to $4.80 per bushel for corn (down 27 percent from the previous crop year). Soybean prices were projected to be $12.65 per bushel (down 11 percent), in part because of higher projections for global soybean production. Using these prices, estimated revenues for the District states’ 2023 harvest would be down 24 percent for corn and 14 percent for soybeans from their 2022 levels.
Prices for livestock products were lower at the end of 2023 as well. In December 2023, the index of prices for livestock and associated products was down 14 percent from 2022; the price of cattle was up 11 percent from a year earlier, while prices for hogs and milk were down 15 and 16 percent from a year earlier, respectively (see final table). Egg prices fell 58 percent from the year prior. Using the USDA’s February assessment for 2023, net farm income for the nation was projected to decline by 16 percent ($30 billion) from 2022, partly because of decreasing farm cash receipts and government payments, plus increasing materials expenses. Real farm income has come down from its high in 2022, remaining well above 2020 levels and just below 2021 levels. According to an Illinois respondent, “Ultimately, 2023 will end up as a profitable year, but because of the drought concerns during the summer, the amount of pre-priced grain was lower than it should have been.” So, even though the drought did not impact yields as much as anticipated, selling a portion of harvested crops at lower prices did negatively impact farm financial positions.
Credit conditions
Reversals in agricultural credit trends for the District were a dominant theme at the end of 2023. During the October through December period of 2023, demand for non-real-estate farm borrowing was higher relative to the same period of a year ago for the first time since the second quarter of 2020: With 28 percent of survey respondents reporting an increase in the demand for non-real-estate farm loans from a year earlier and 22 percent reporting a decrease, the index of loan demand was 106 in the fourth quarter of 2023. At 69 in the final quarter of 2023, the index of funds availability reflected a decline in the level of funds available for lending from a year ago; funds availability was higher than a year earlier at just 3 percent of the survey respondents’ banks and lower at 34 percent. At 74.0 percent in the fourth quarter of 2023, the District’s average loan-to-deposit ratio was nearly unchanged from that of the previous quarter.
The share of the District’s farm loan portfolio assessed as having “major” or “severe” repayment problems was 1.8 percent in the fourth quarter of 2023—higher than the share reported at the end of 2022, yet lower than the share reported at the end of 2021. For the first time in 13 quarters, non-real-estate loan repayments were, on the whole, down from a year earlier. With 7 percent of survey respondents reporting higher rates of loan repayment than a year ago and 15 percent reporting lower rates for the fourth quarter of 2023, the index of non-real-estate farm loan repayment rates was 92. Furthermore, non-real-estate farm loan renewals and extensions in the final quarter of 2023 were higher than in the final quarter of 2022, as 13 percent of survey respondents reported more of them and 2 percent reported fewer.
Up from the previous year’s reading, 25 percent of survey respondents’ banks tightened their credit standards for farm loans in the fourth quarter of 2023 compared with a year earlier, while 75 percent of the respondents’ banks kept their credit standards essentially unchanged. Also, 92 percent of responding bankers noted their banks did not change the amounts of collateral required for customers to qualify for non-real-estate farm loans during the final quarter of 2023 relative to a year ago, while 8 percent noted their banks required larger amounts.
Agricultural interest rates in nominal terms did not change much during the fourth quarter of 2023. As of January 1, 2024, the District’s average nominal interest rates were 8.51 percent on new operating loans, 8.49 percent on feeder cattle loans, and 7.60 percent on farm real estate loans. In real terms (after being adjusted for inflation with the PCEPI), the average interest rates for all three types of agricultural loans leaped higher in the fourth quarter of 2023. Average real interest rates on new operating and feeder cattle loans were last higher at the end of the third quarter of 2009, and the average real interest rate on new farm mortgages was last higher at the end of the fourth quarter of 2009. An Iowa respondent observed: “We have seen a decrease in working capital as a result of lower grain prices and higher interest rates. Higher interest rates have also reduced capital expenditures among our ag customers.”
Credit conditions at Seventh District agricultural banks
| Interest rates on farm loans | |||||||
| Loan demand | Funds availability | Loan repayment rates | Average loan-to-deposit ratio | Operating loansa |
Feeder cattlea |
Real estatea | |
|---|---|---|---|---|---|---|---|
| (index)b | (index)b | (index)b | (percent) | (percent) | (percent) | (percent) | |
| 2022 | |||||||
| Jan–Mar | 83 | 148 | 159 | 65.0 | 4.64 | 4.74 | 4.44 |
| Apr–June | 82 | 129 | 133 | 67.0 | 5.42 | 5.53 | 5.17 |
| July–Sept | 91 | 96 | 121 | 68.2 | 6.52 | 6.58 | 6.13 |
| Oct–Dec | 82 | 102 | 131 | 70.6 | 7.50 | 7.54 | 6.80 |
| 2023 | |||||||
| Jan–Mar | 78 | 102 | 123 | 70.3 | 7.97 | 7.93 | 7.14 |
| Apr–June | 77 | 83 | 105 | 72.8 | 8.24 | 8.19 | 7.33 |
| July–Sept | 81 | 72 | 100 | 74.3 | 8.50 | 8.47 | 7.70 |
| Oct–Dec | 106 | 69 | 92 | 74.0 | 8.51 | 8.49 | 7.60 |
Looking forward
Another Iowa banker succinctly warned of “tough times ahead.” In line with this thinking, survey respondents at the start of 2024 predicted capital expenditures by farmers would be lower in the year ahead than in the year just ended for land purchases or improvements, buildings and facilities, machinery and equipment, and trucks and autos.
According to survey respondents at the beginning of 2024, 1.3 percent of their farm customers with operating credit in the year just past were not likely to qualify for new operating credit in the year ahead (slightly above the survey’s level at the start of 2023). Farm real estate loan volumes were forecasted to be smaller in the first three months of 2024 compared with the same three months of 2023. However, non-real-estate loan volumes (specifically for operating loans and loans guaranteed through the USDA’s Farm Service Agency) were forecasted to be larger in the first three months of 2024 compared with the same three months of a year earlier. An Illinois banker commented that “the need for operating credit will increase with tighter working capital positions from a year ago.”
There were fewer responding bankers (6 percent) who projected agricultural land values to go up in the next quarter (in this case, the first quarter of 2024) than those who predicted them to go down (17 percent); 77 percent of the respondents projected them to be unchanged. Stable farmland values for the first quarter of 2024 were the consensus of survey participants, with 2024 looking to be a more challenging year for agriculture.
Selected agricultural economic indicators
| Percent change from | |||||
|---|---|---|---|---|---|
| Latest period | Value | Prior period | Year ago | Two years ago | |
| Prices received by farmers (index, 2011=100) | December | 114 | –0.4 | –18 | 1 |
| Crops (index, 2011=100) | December | 102 | 0.7 | –21 | –5 |
| Corn ($ per bu.) | December | 4.80 | 3.0 | –27 | –12 |
| Hay ($ per ton) | December | 191.00 | –2.1 | –19 | –1 |
| Soybeans ($ per bu.) | December | 13.10 | 0.8 | –9 | 5 |
| Wheat ($ per bu.) | December | 6.79 | 4.0 | –24 | –21 |
| Livestock and products (index, 2011=100) | December | 130 | –3.0 | –14 | 8 |
| Barrows & gilts ($ per cwt.) | December | 53.50 | –7.0 | –15 | –5 |
| Steers & heifers ($ per cwt.) | December | 176.00 | –4.3 | 11 | 25 |
| Milk ($ per cwt.) | December | 20.60 | –5.1 | –16 | –5 |
| Eggs ($ per doz.) | December | 1.87 | 5.1 | –58 | 38 |
| Consumer prices (index, 1982–84=100) | December | 307 | –0.1 | 3 | 10 |
| Food | December | 325 | 0.1 | 3 | 13 |
| Production or stocks | |||||
| Corn stocks (mil. bu.) | December 1 | 12,169 | N.A. | 12 | 5 |
| Soybean stocks (mil. bu.) | December 1 | 3,000 | N.A. | –1 | –4 |
| Wheat stocks (mil. bu.) | December 1 | 1,410 | N.A. | 7 | 2 |
| Beef production (bil. lb.) | December | 2.19 | –4.0 | –2 | –7 |
| Pork production (bil. lb.) | December | 2.34 | –1.9 | 5 | –3 |
| Milk production (bil. lb.) | December | 18.8 | 3.9 | –1 | 0 |
| Agricultural exports ($ mil.) | December | 16,541 | –10.5 | –3 | 0 |
| Corn (mil. bu.) | December | 189 | 34.5 | 30 | –4 |
| Soybeans (mil. bu.) | December | 177 | –35.4 | –42 | –41 |
| Wheat (mil. bu.) | December | 54 | 28.1 | 36 | 10 |
| Farm machinery (units) | |||||
| Tractors, 40 HP or more | December | 9,249 | 80 | –4 | –10 |
| 40 to 100 HP | December | 5,899 | 65 | –8 | –17 |
| 100 HP or more | December | 3,350 | 117 | 2 | 3 |
| Combines | December | 610 | 122 | –16 | –3 |


