Revitalizing the Greater Chatham Housing Market
Greater Chatham is a 15-square-mile area in the city of Chicago that includes the neighborhoods of Avalon Park, Auburn Gresham, Greater Grand Crossing and Chatham. For decades, the area has been an African-American middle-class neighborhood known for its attractive and quality homes built between 1920s and 1950s as part of Chicago’s “bungalow belt.” However, like many other neighborhoods in Chicago and across the country, the Chatham area was hit hard by the 2008 recession and saw its median home value decline by more than 50 percent between 2007 and 2011 (Figure 1)1 While home prices in Chatham have ticked upwards in recent years, price recovery in Chatham and many other predominantly black communities of Chicago continue to trail the gains in many other neighborhoods of the city. In this blog, we trace recent trends in the housing market which highlight opportunities for the Greater Chatham community to build upon, but also point to some challenges that affect both the supply and demand for housing in these neighborhoods.
Figure 1. Housing price index, South Side areas of Cook County
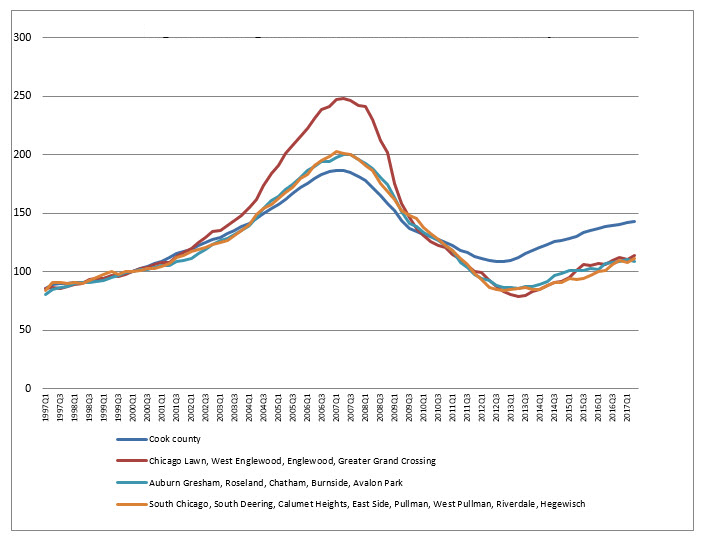
Source: DePaul Institute for Housing Studies Data Clearing House, available online. Reproduced from Toussaint-Comeau, M and J.M. Lee, 2018, “Determinants of Housing Values and Variations in Home Prices Across Neighborhoods in Cook County”, available online.
Between 2016 and 2017, median values for both single-family and multi-family units increased in most of the neighborhoods that comprise Greater Chatham (Table 1). Moreover, a micro housing market analysis by the DePaul Institute for Housing Studies (IHS) shows properties selling at a wide range of prices. The west ends of Auburn Gresham and Avalon Park, and the central and south ends of Chatham, have been labeled “hot spots” in so far as properties in these parts of the community are selling above the median per-square-foot price of the Greater Chatham area as a whole (Figure 2).2
Table 1. Median price of single and multi-unit properties sold ($thousands)
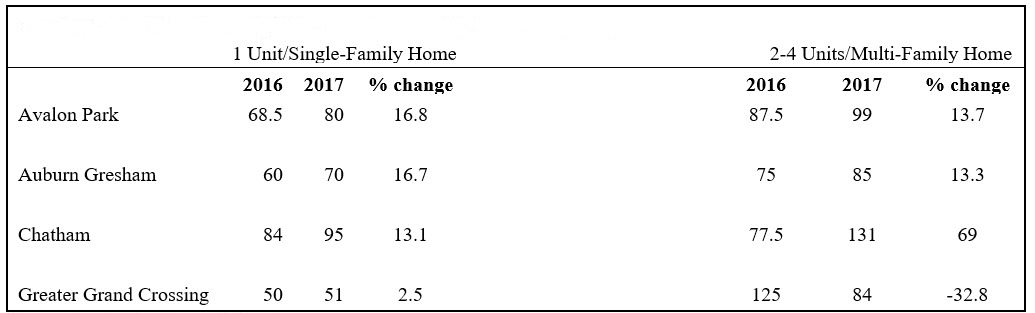
Figure 2. The Chatham housing market

Source: DePaul Institute for Housing Studies report prepared for the Greater Chatham Initiattive (GCI). Calculations based on data from the Cook County Recorder of Deeds via Property Insights.
A number of challenges remain, however. As of 2017, the housing price index for the Greater Chatham community was still more than 25 percent below its 2007 peak. In addition, the homeownership rate has remained flat. Various pockets with concentrations of long-term vacancies and boarded up homes present aesthetic and safety issues, diminishing demand and property values.3
Housing Market Characteristics
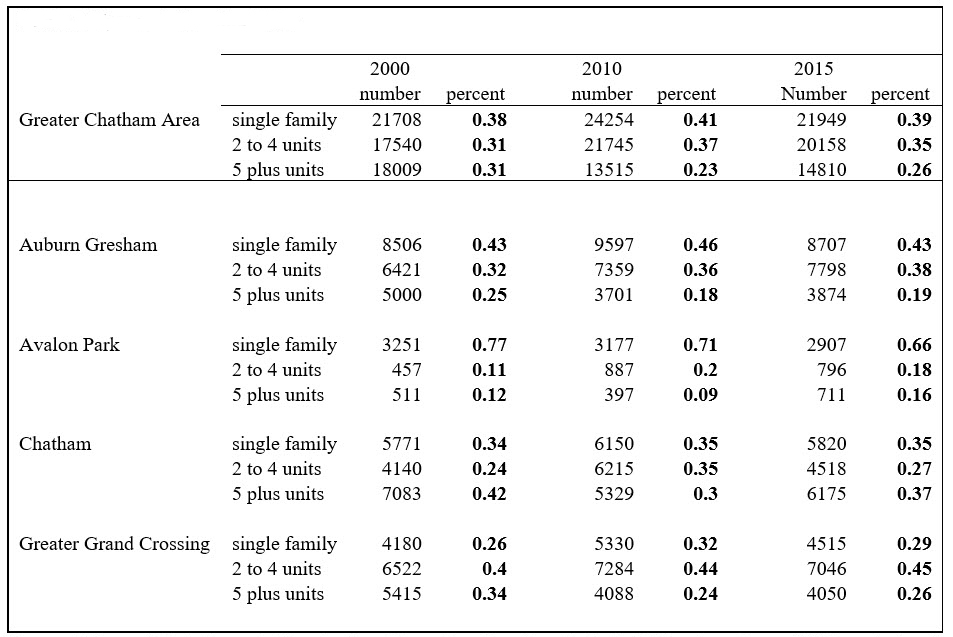
While distributed unevenly, single-family homes make up about 40 percent of the Greater Chatham area’s housing stock. Avalon Park is primarily residential and has more than 65 percent single-family homes, while in Greater Grand Crossing single-family homes make up just below 30 percent of the housing stock (Table 2). About a quarter of the housing stock in Chatham, and nearly 40 percent of the housing stock in Auburn Gresham, is comprised of 2 to 4 unit buildings. Housing with two or more units have historically been owner occupied with renters in extra units.
Table 2. Types of housing units
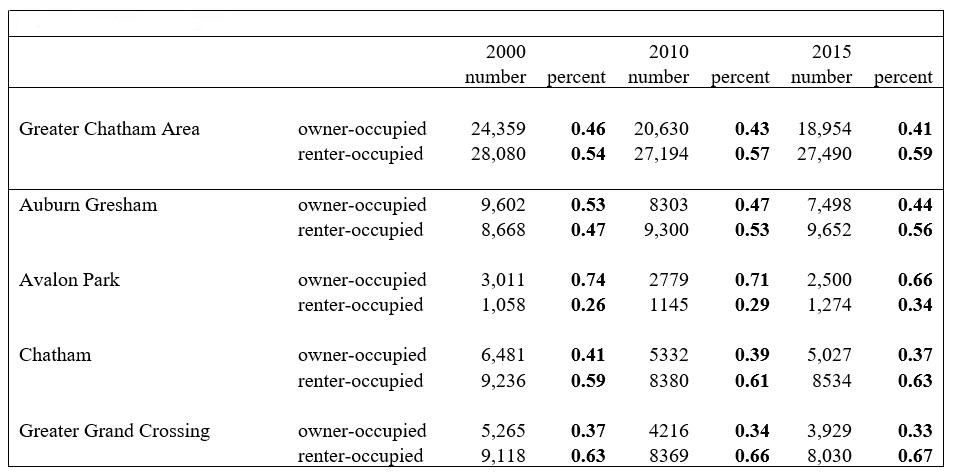
Indeed, one of the defining features of the Greater Chatham housing market in recent years has been the shift in housing tenure from owner- to renter-occupied units (Table 3). Between 2000 and 2015, the homeownership rate in Auburn Gresham fell from 53 percent to 44 percent, and in Avalon Park, from 74 percent to 66 percent. These shifts reflect a confluence of factors, including a loss of population and declining incomes.4
Table 3. Housing tenure
During and after the recession, as lenders foreclosed on owners of small residential properties (one-to-four-unit buildings) throughout the South and West sides of Chicago, many homes fell out of the hands of traditional owner-occupants.5 According to Chicago Housing Authority data, between 2001 and 2014 the number of housing choice voucher holders in Greater Chatham grew by almost 50 percent.6 A significant share of formerly owner-occupied properties have thus become entirely rentals, with voucher-holders occupying about 10 percent of the housing stock.
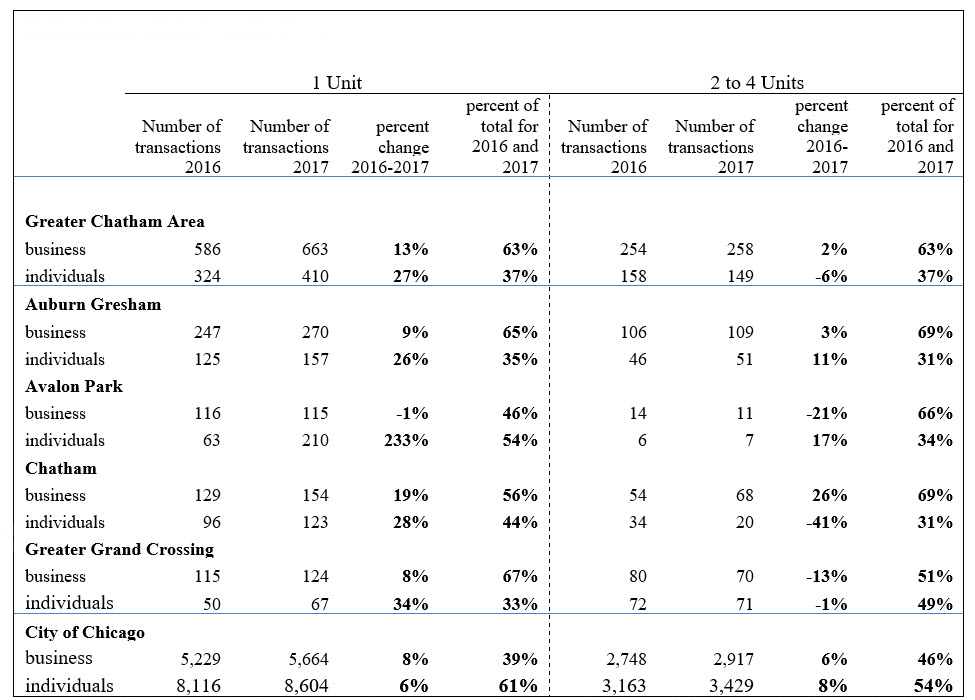
Greater Chatham housing market has also attracted institutional/small-scale investors and cash buyers. In 2016 and 2017, more than 60 percent of both single- and multi-unit (2-4) homes sales in Greater Chatham were sold by businesses/institutional investors to individuals and other businesses, compared to 39 percent and 46 percent for 1-unit and 2-4 units, respectively, in the city (Table 4). In this same timeframe, the increase in 1-unit homes sold by businesses was higher than for the city as a whole (Table 4), and nearly 25 percent of the houses sold in the Chatham neighborhood itself were recent rehabs, typically owned and sold by contractors and investors. This represents a far higher proportion than in other South and West Side neighborhoods, which were also hit hard by the recession. Rehab sales were fewer, for example, in nearby South Shore (15 percent), Park Manor and South Chicago (both 17 percent).7
Table 4. Home sales by seller type
Opportunities and Challenges
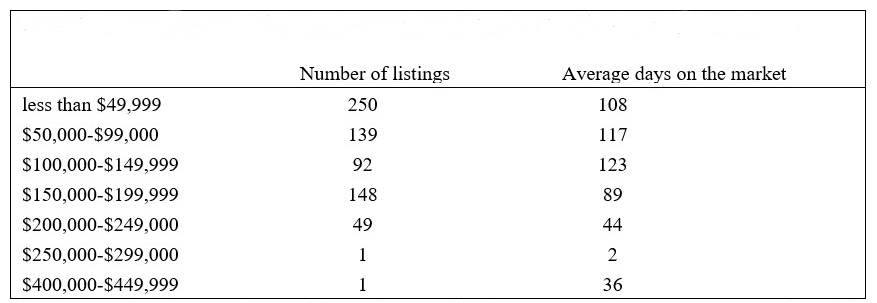
The wave of recent rehabs from small developers has helped stabilize the Greater Chatham housing market.8 Homes sold by investors to individuals or other businesses (that were most likely rehab) increased in price by more than those sold by individuals to individuals (Table 5), suggesting that the overall uptick in home prices in Greater Chatham derives from investor activity. Relatedly, declining days-on-the-market among higher-priced home listings suggests that Greater Chatham is still an attractive place for buyers seeking move-in-condition housing, including single-family homes (Table 6). Thus while some investors may be turning to renters to fill their units, others that secure the resources for rehabbing and upgrading these homes to a "resilient" standard are able to sell at higher prices.9 Many challenges remain. Communities in the Greater Chatham area still have twice or higher the rate of vacancy than the city. These vacancies are largely concentrated in discrete pockets, and thus affect submarkets of the community (Figure 3a and 3b). In these submarkets, conditions likely contribute to more uncertainty with respect to appraisals or the future direction of home values. Moreover, the foreclosure rate, which has dropped precipitously since 2012, still stands at about three times the rate (3.6 percent as of December 2017) as compared to Cook County as a whole (1.3 percent) (Figure 4). Consistent with the slower housing market price recovery in the area, some homes are still underwater which limits the ability to rehab, sell or refinance. 10 Finally, a tight mortgage credit market in general (Figure 5a, b, c), 11 and low availability of rehab loans in particular, (Figure 6a, b) give room for cash buyers (often from outside of the community), keep some would-be less wealthy resident owner/investors from purchasing 2-4 unit properties, and potentially work to constrain the availability of more desirable homes. 12
Table 5. Median sales price in Greater Chatham
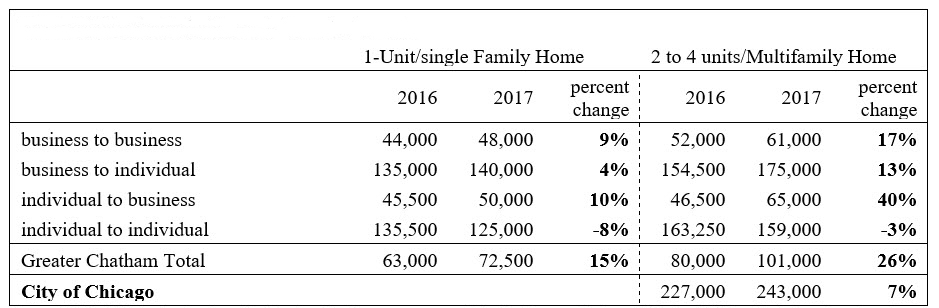
Table 6. Average days on market for properties sold in Greater Chatham, by price range
Source: Area Market Survey by Prim Law, based on MLS listings.
Figure 3a. Residential vacancy rate
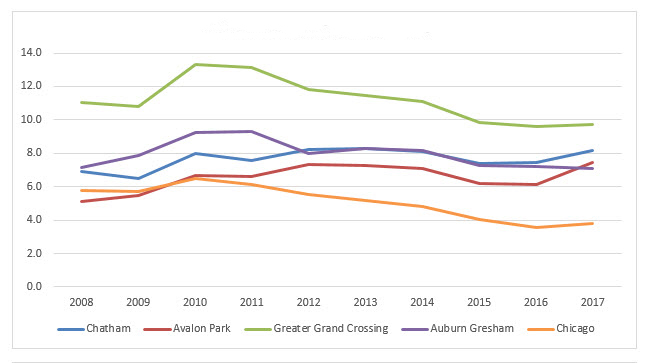
Figure 3b. Shares of residential vacancy, 36-plus months
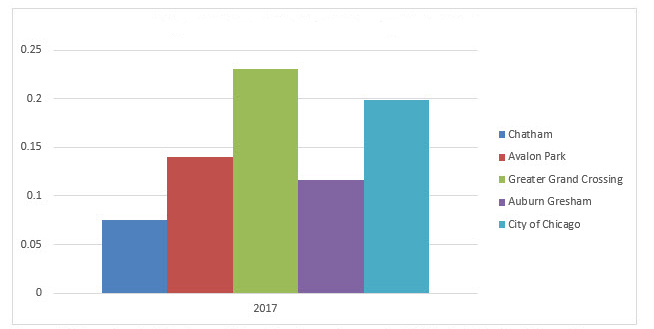
Figure 4. Percent of first-lien mortgages in foreclosure
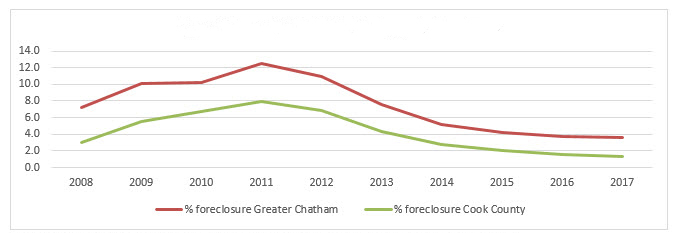
Figure 5a. Mortgage counts for 1-4 unit properties
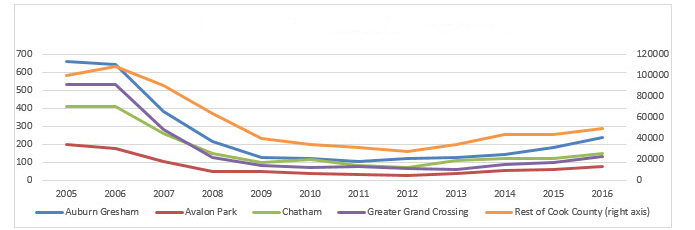
Figure 5b. Mortgage counts for 1-4 unit properties relative to 1-4 unit properties sales
Figure 5c. Percent of 1-4 unit sales not financed with a mortgage
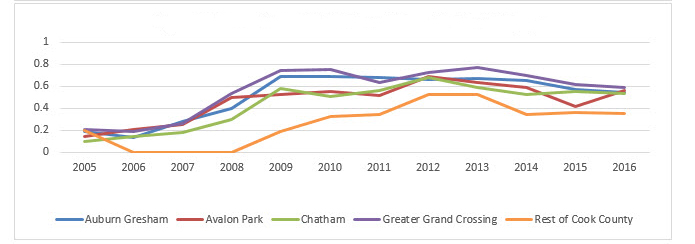
Figure 6a. Loan origination by ownership and purpose of loans
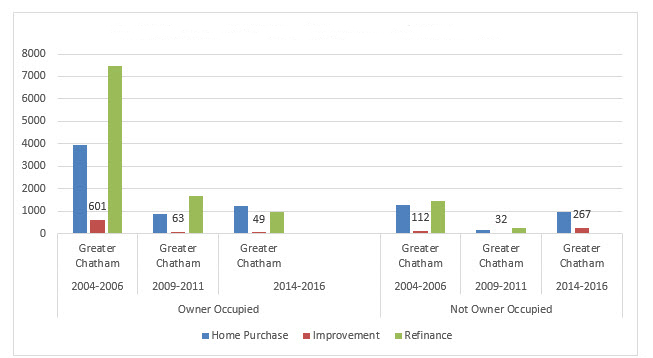
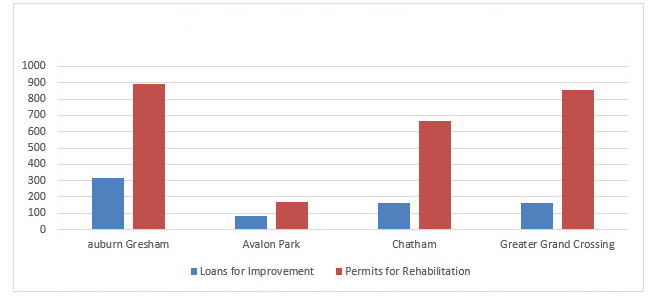
Figure 6b. Loans for rehabs and rehab permits, 2006-2014
Going forward, revitalizing concentrations of troubled (long-term vacant) properties through priority investment strategies and neighborhood stabilization programs may help jumpstart some of the more distressed areas, and create a more resilient community of choice.13 Efforts to ensure access to credit and creative financing for rehab purchasers14 may help balance the share of renters and homeowners in the Greater Chatham area, and uphold the preservation of homeownership in this traditionally middle-class community.
1 An analysis of the housing markets in Cook County neighborhoods is available online. An example of an article on another south side of the city of Chicago black neighborhood, Woodlawn, is available online. An article on an example of revitalization activities in another black neighborhood on the south side of Chicago, Pullman, is available online.
2 Interactive maps of property transactions in recent years are available online.
6 The majority of voucher holders in the city of Chicago are settled in low-income neighborhoods on the West and South sides, according to data obtained from the CHA, as reported in an article in the Chicago Tribune. There are large concentrations of vouchers holders in Auburn Gresham, with 1,652; Greater Grand Crossing, with 1,284; and Chatham, with 1,302. Available online.
9 Another reason why high-quality rehab is important to Chatham is to protect against damage from flooding. Chatham is susceptible to flooding, and homes damaged by flooding are linked to decreased quality of life, vacancies and divestment. Initiatives are currently underway to help developers rehab properties to a “resilient” standard that attracts middle-income professional residents, including reducing flood risks prior to sale. (See report by the Center for Neighborhood Technology, available online).
11 The low availability of loans relates particularly to small-dollar mortgages. An Urban Institute study discusses issues contributing to the lack of small-dollar mortgages and explains how small-dollar mortgages can help in the home improvement market. Available online.
12 Low property values in depressed neighborhoods often make it difficult for small-scale investors to get loans for any substantial amount of money. Available onloine.
13 Several city and other public/ and private sector programs have been created to help stabilize neighborhoods in Chicago. The city of Chicago’s Micro Market Recovery Program provides incentives to purchasers and rehabbers of formerly vacant properties (available online). The five-year Home Buyer Assistance Program in 2014 aimed to invest $1.3 billion in home construction, rehabilitation and preservation (available online). Also see information on the City of Chicago Neighborhood Stabilization Program which provided funds to communities that were affected by foreclosure (available online). For an example of a private sector initiative see the University of Chicago’s Employer-Assisted housing program (availble online. Also see LISC/Chicago’s New Communities Program (available online).
14 See for example a creative funding initiative to small-scale investors for rehab of 1-4 units by the Chicago CDFI Collaborative, funded by JP Morgan Chase bank, available online.


