Charging Ahead: Trends in Leasing for Battery Electric Vehicles
How do consumers acquire vehicles that feature new propulsion technology? This question is of specific interest in the context of the growing sales of battery electric vehicles (BEVs), vehicles that run exclusively on electricity. In this post, we look at trends in leasing for BEVs during the past decade or so, a period in which the electric vehicle market has seen remarkable growth.
Our analysis goes through the end of 2022.1 Thus, we do not include this year’s uptick in leasing rates, spurred by the implementation of the Inflation Reduction Act (IRA). We find that the incidence of leasing for new BEVs has been elevated for the majority of years since the introduction of the modern BEV. Two factors seem to be driving this observation: In light of rapidly changing technology, leasing can offer some “insurance” to consumers. Second, in a market featuring relatively small volumes, pricing decisions by specific motor vehicle companies can have an outsized effect on the aggregate leasing statistics.
Leasing of BEVs received some attention earlier this year, as administrative details of the implementation of the Inflation Reduction Act were specified. Industry observers noted that under the IRA’s rules, there are fewer restrictions to qualify for the $7,500 federal tax credit for electric vehicles that are leased instead of purchased outright (Federal Reserve Bank of Chicago, 2023; Muller, 2023). As a result, leasing take-up rates for electric vehicles rose quickly from 25% at the beginning of 2023 to 52% in early February. In this post, we focus on leasing take-up for BEVs prior to the introduction of the IRA consumer-oriented incentives.
Leasing is a popular type of auto financing whereby a consumer commits to making monthly payments to a financial entity that retains the title to the vehicle for the right to utilize the vehicle for a set amount of time and miles. This practice essentially allows consumers to “rent” a vehicle, typically for a period of 24 to 36 months. Utilizing registration microdata, we examine trends in the leasing market for new BEVs and compare them to those of vehicles powered by other powertrain technology, such as gasoline-powered or hybrid vehicles. We conclude by discussing potential factors driving trends in the leasing of BEVs.
Data
To study leasing trends for BEVs, we look at over a decade’s worth of new vehicle registration data. We utilize data from two sources: 1) the AutoCount database from Experian Automotive; and 2) the Wards Intelligence Data Center. The AutoCount database comprises the universe of nonfleet vehicle registrations across the entire United States, sourced from state-level department of motor vehicles (DMV) title and registration data. We use data from AutoCount to recover information on the make (e.g., Chevrolet), model (e.g., Blazer), model year (MY), lease status, and registration date (month and year) of all new vehicle registrations from model year MY2010 to MY2022. We start with data for MY2010 because annual BEV sales broke 5,000 units in MY2011, and we wanted to begin our data collection before that milestone was reached. From Wards Intelligence we add information on the vehicle powertrain (gasoline, electric, hybrid, etc.) to the registration data. Our data consist of 147 million new vehicle registrations in the 13 model years of our sample, with registration dates from January 2009 to December 2022. We group each registration into one of four mutually exclusive categories of powertrain type: internal combustion engine, hybrid (including plug-in hybrid, or PHEV), mixed (which are models available with two or more powertrain options that cannot be delineated in the data), and pure battery electric.
BEVs leased at a strikingly higher rate from MY2012 to MY2017
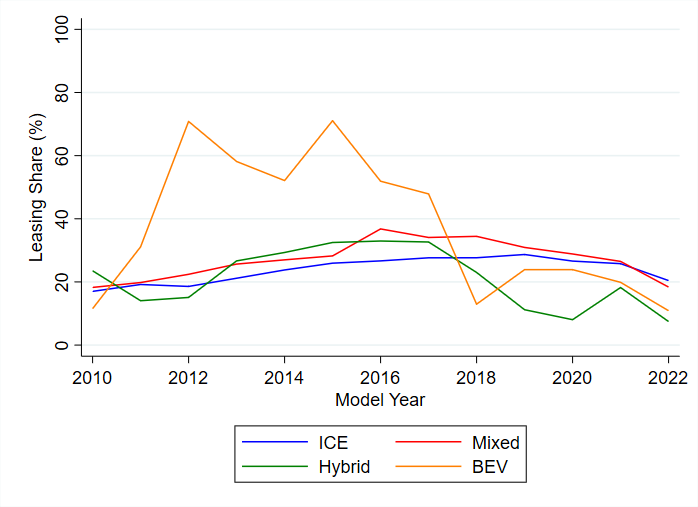
We first plot the share of new registrations that are leased for each powertrain category in figure 1. It shows that BEVs were leased at strikingly higher rates for much of the sample period. Between MY2012 and MY2017, over 40% of new BEVs were financed through leasing. This is almost double the leasing incidence for the other powertrain categories, which hover around 20% to 30%. Interestingly, leasing shares for BEVs dropped to a more normal percentage from MY2018 onward, fluctuating between 15% and 25%.
Figure 1. Leasing share by powertrain category

Factors influencing the high leasing shares of BEVs
There are several potential benefits to financing a vehicle through leasing. Leasing typically involves lower up-front costs, lower monthly payments, and shorter time commitments. For individuals uncertain about the long-term investment that comes with purchasing a given vehicle, leasing can be a preferred option. Leasing also protects against sudden depreciation of a vehicle. If the value of a leased vehicle suddenly drops, it is the lease holder (as opposed to the consumer) who experiences this drop in equity.
For consumers interested in BEVs, leasing arrangements may be a particularly attractive option, given that these vehicles are currently, on average, priced higher than comparable ICE vehicles. The shorter time commitment from leasing agreements might also be attractive for consumers who have concerns about adopting a rather new and fast-changing technology. For instance, some consumers may be concerned about the risk that a particular vehicle’s technology could become obsolete as new models and new technology emerge. Another related concern may be the lack of data regarding the expected depreciation of BEVs compared with vehicles powered by other propulsion technology.
The mechanics of tax incentives toward the purchase of a BEV have also likely played a role in raising leasing rates of BEVs—even before the recent uptick related to implementation of the IRA. When leasing a vehicle, the financial incentives accrue to the leasing entity, which typically passes them on to the consumer at the time of leasing. This allows consumers to benefit from the tax credits immediately. In contrast, if the consumer purchases a BEV outright, they must wait until they file their next tax return to take advantage of the tax credit, assuming they qualify for it.
Distinguishing BEV registrations by vehicle make
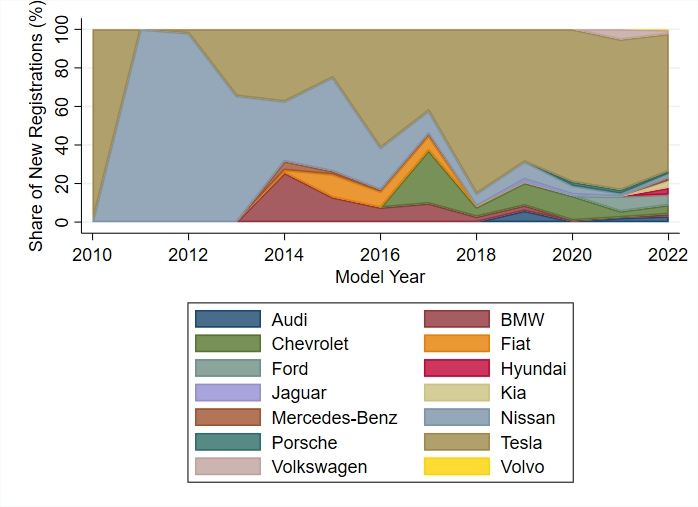
In light of the fact that during the early years of BEV availability in the U.S. market, consumer choices were limited to very few products, we also distinguish new BEV registrations by make and model year (see figure 2). The figure plots the percentage share for BEV new registrations by make from MY2010 to MY2022. It shows that early on, the Nissan Leaf was essentially the only BEV available in the U.S. market. Incidentally, that is also the time when we observe the highest leasing take-up. By MY2016, Tesla new vehicle registrations account for half of all new BEV registrations in the U.S. market. Tesla’s growth is correlated with the declining lease rates for BEVs.
Figure 2. BEV new registration share by make

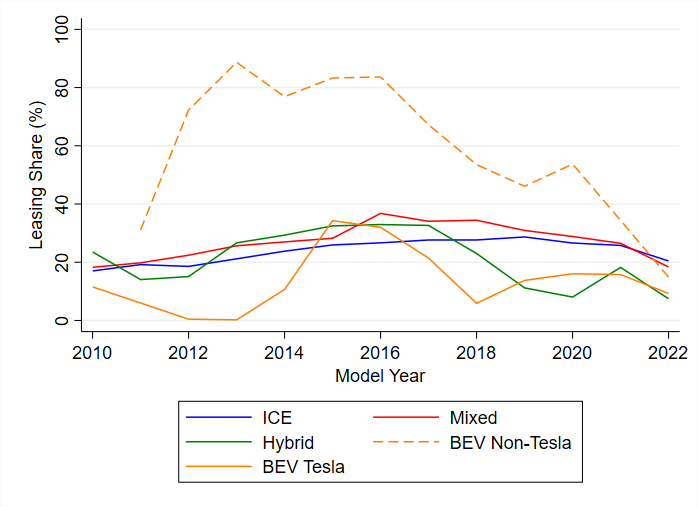
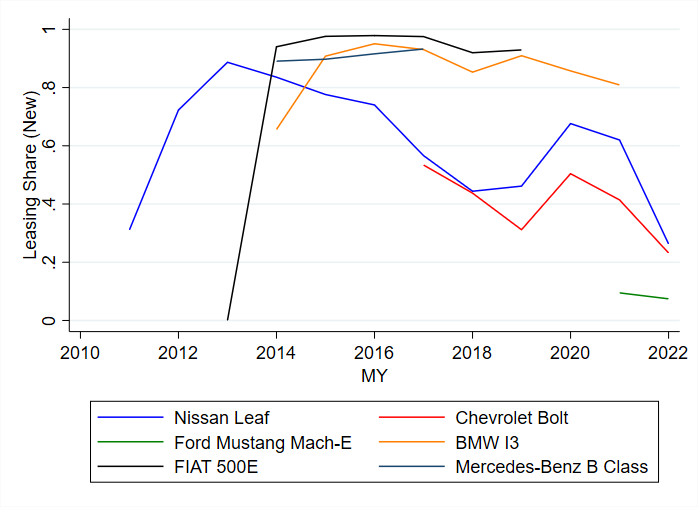
Figure 3 plots the share of new registrations that are leased but splits out the BEVs into Teslas and non-Teslas. We can see that non-Tesla BEVs between MY2012 and MY2016 were driving the unusually high leasing take-up rates observed in figure 1, as they were leased at shares between 60% and 80%. On the other hand, Tesla BEVs, the most popular models of which were not offered for lease (i.e., the Model S) until MY2014, show much lower leasing shares. The aggregate share of leased new registrations drops for BEVs post-MY2015 due to Tesla’s growing dominance in BEV market share during this period. Returning to the role of the Nissan Leaf early on in BEV new vehicle sales, it is worth noting that Nissan ended up incentivizing the Leaf, at the time the only fully electric non-luxury car that was sold nationwide, by offering rather generous lease rates: For example, in 2014 the Leaf was available for $199/month for a 36-month lease, with a $2,400 down payment (Golson, 2014). Leasing take-up for the Leaf peaked in model year 2013 at well over 80% (see figure 4). Figure 4 also shows very high leasing take up for other non-Tesla BEV products.
Figure 3. Leasing share by powertrain category and BEV makes

Figure 4. Leasing share among non-Tesla BEVs by product

Conclusion
At the beginning of the year the increase in the take-up of leasing for BEVs gained attention as a response to specific aspects of applicable rules of the IRA. This post shows that leasing of BEVs has, on balance, been above the average rate across vehicles of all powertrain technologies for the past decade or so. For more information about the BEV market, see our working paper
Notes
1 In 2022, 735,561 BEVs were sold in the U.S market, corresponding to 5% of all light vehicle sales. Authors’ calculations based on data from Wards Intelligence.


