Initial UI Claims and Google Trends in the Post-Pandemic Era
Initial unemployment insurance (UI) claims are a weekly measure from the U.S. Department of Labor of how many new people have filed for unemployment benefits. A well-known leading indicator and one of the few official statistics released at a weekly frequency, initial UI claims are carefully monitored by economists for signs of turning points in economic activity. That said, they are at best an imperfect measure of turning points for several reasons: The information comes out with a lag, it is sensitive to changing seasonal patterns, and it is subject to revision. Given these challenges, researchers often turn to auxiliary data sources to help uncover the underlying trend in initial UI claims. One such alternative data source that has been used extensively in recent years for this purpose is internet search data.
Google’s Trends tool analyzes the popularity of related search terms, called topics, over both space and time. Previous research has highlighted how Google Trends can be utilized to effectively predict in real time, or nowcast, a range of less frequently available economic statistics, including initial UI claims.1 The basic intuition for using Google Trends data for this purpose is that the tool provides timely information on internet searches people make related to the process of determining how to file a UI claim. In this blog post, we look at recent initial UI claims alongside the Google Trends unemployment topic data and discuss what they may tell us about the current state of the labor market.
Recent developments in UI claims and Google Trends
Figure 1 shows non-seasonally adjusted initial UI claims and the Google Trends unemployment topic data for the weeks of January 1, 2022, through May 6, 2023, with each series indexed to its sample mean over this period. It offers motivation for why researchers use this Google Trends topic to predict initial UI claims, as the two series closely follow each other. From January through October 2022, both initial UI claims and the Google Trends unemployment topic data steadily declined, with the labor market enjoying a record-breaking recovery in the aftermath of the recession caused by the Covid-19 pandemic. From October 2022 to May 2023 there was an uptick in both series, but the initial increase was considerably less pronounced in the Google Trends data, with initial UI claims gradually converging to this lower level over time.
1. Initial UI claims and Google Trends unemployment topic, January 2022–May 2023
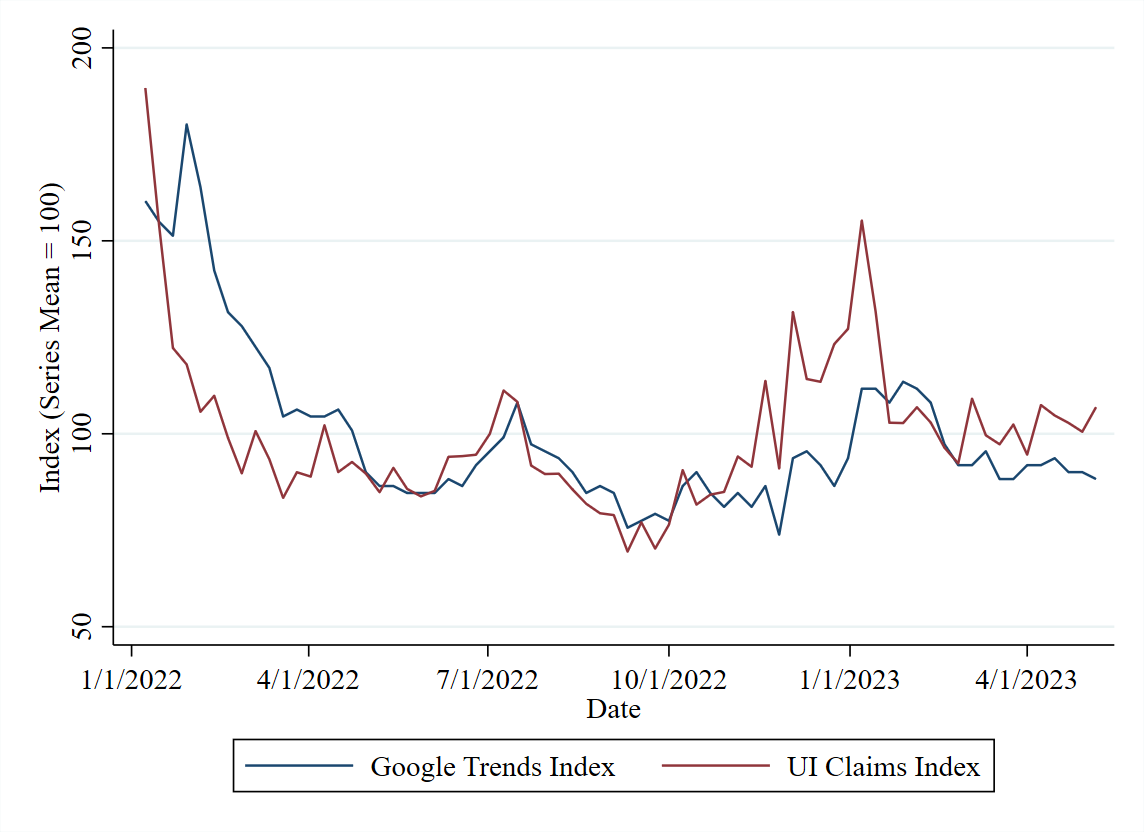
At face value, the evidence presented in figure 1 aligns closely with the conclusions from our previous research (Aaronson et al., 2020, 2022), highlighting a strong amount of co-movement between the two series. Tracking the Google Trends topic on a week-to-week basis should therefore be a useful guide for judging the underlying trend in the noisier initial UI claims data. On this basis, some of the recent upward movement in initial UI claims should be taken with a grain of salt,2 as the Google Trends data has largely moved sideways in the last several months even as initial UI claims have edged higher.
However, the fact that previous research studying this relationship has focused on pre-pandemic periods makes it reasonable to question whether the relationship continues to hold post-pandemic. For instance, the pandemic recession led to dramatic changes in the UI system, such as extending the eligibility of and length of time an individual could be on unemployment insurance. While these changes have since expired, it is possible that this lived experience and any changes in how individuals search for information about UI using Google may have remained. Furthermore, the pandemic recession was one of the sharpest and most devastating contractions in the U.S. labor market in recent history. It is possible that this experience permanently shifted how individuals engage with the take-up of UI.
All of these concerns remain highly relevant for the models researchers have used in the past to predict initial UI claims with Google Trends. So, how comfortable should we be that the historical relationship will continue to hold? To answer that question, we provide below some updated evidence from the model of Aaronson et al. (2020, 2022).
Using hurricanes to model UI claims and Google Trends
Aaronson et al (2020, 2022) showed that major hurricanes provide a unique opportunity to estimate how Google searches for terms related to unemployment can be translated into a prediction of future initial UI claims. The damage that major hurricanes cause to the labor market resembles in many ways what we see during recessions. But unlike recessions, which through media coverage alone can stimulate internet searches related to unemployment, hurricanes tend to prompt mostly UI-related searches rather than broad unemployment-related searches. After landfall of a hurricane, unemployment-related search on Google is much more likely to be related to the process of filing a UI claim than other factors, as well as more likely to lead to the eventual take-up of UI. In this sense, hurricanes provide what econometricians refer to as a natural experiment that can be used to estimate the connection between UI take-up and internet search.
The hurricanes featured in Aaronson et al. (2020, 2022) all occurred before the pandemic recession. In September 2022, however, Florida was devasted by Hurricane Ian. A category 5 hurricane, Ian made its initial landfall on September 28 near Punta Gorda, FL, and left a path of destruction that made it the third-costliest weather disaster on record and the deadliest hurricane to strike the state of Florida since 1935. As the first significant hurricane to have occurred since the pandemic, Hurricane Ian allows us to investigate whether the relationship between search behavior on Google for unemployment terms and subsequent initial UI claims in the state of Florida was any different than earlier events.
To test this, we collect data on non-seasonally adjusted initial UI claims and Google Trends for both Florida and the entire U.S. in each week for six months prior and six months after Hurricane Ian made landfall. For each series, we then take the log ratio of the series in the state of Florida relative to the U.S. and subtract the annual average over this sample period. This allows us to measure the share of initial UI claims and Google Trends intensity in the state of Florida in each week relative to the U.S. leading up to and following landfall of the hurricane, which mirrors the analysis of Aaronson et al. (2020, 2022).
Figure 2 displays the two measures in a scatter plot, with the line corresponding to their elasticity estimated by linear regression. With an estimated elasticity of 1, Hurricane Ian is well within the range of estimates for the pre-pandemic hurricanes Katrina, Sandy, and Harvey found in Aaronson et al. (2022), and which now round out the top four hurricanes by measure of overall monetary damage for the U.S. In other words, utilizing the same methodology with a post-pandemic hurricane, we find that the relationship between initial UI claims and the Google Trends unemployment topic data is unchanged: A 1% increase in unemployment-related search on Google tends to lead to a 1% increase in initial UI claims.
2. Hurricane Ian

Conclusion
Taken together, the evidence presented here suggests that the relationship between initial UI claims and Google Trends has continued to hold post-pandemic. What does this imply for the current situation in which initial UI claims have increased but the Google Trends unemployment topic has not? While the two measures of labor market health do not always align, over time they do tend to follow the same trend. This makes the deviations that do occur of some interest and worthy of further study. While not particularly large, the current deviation is one such example. As the labor market recovery continues to evolve in 2023, in our view Google Trends remains an alternative data source worth watching closely.
Notes
1 For example, see Hyunyoung Choi and Hal Varian, 2012, “Predicting the present with Google Trends,” Economic Record, Vol. 88, No. s1, June, pp. 2–9; Larson, W. and T. Sinclair, 2022, “Nowcasting unemployment insurance claims in the time of COVID-19,” International Journal of Forecasting, Vol. 38, No. 2, pp. 635–647; and Daniel Aaronson et al., 2022, “Forecasting unemployment insurance claims in realtime with Google Trends,” International Journal of Forecasting, Vol. 38, No. 2, pp. 567–581.
2 Recent reports have documented how upticks in fraudulent UI claims in Massachusetts have deceptively inflated national claims numbers.


