Seventh District Labor Markets at Year-end
Government agencies regularly report statistics that reflect state and local labor market conditions. These measures are far from perfect in their accuracy, and they often seem to conflict. Yet, these measures currently agree to a negative view of the labor markets in the Seventh Federal Reserve District.
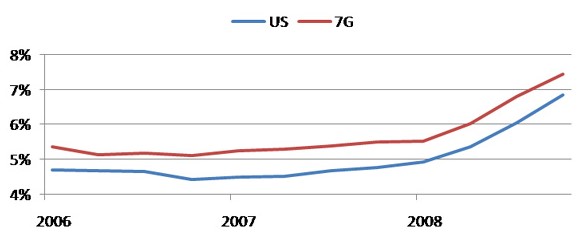
State unemployment rates, using a household sample survey, measure those people of working age who are actively looking for work as a fraction of the work force (both employed and unemployed). Since it is sample based, the measure is imprecise, especially readings for a single given month. The chart below shows that the unemployment rates for the nation and the Seventh District began to move up moderately off of their cyclical lows throughout 2007. During 2008, the unemployment rates accelerated primarily because of net job destruction. The gap between the Seventh District’s higher unemployment rate and that of the nation remained fairly steady in recent years, even as unemployment rates were climbing in each of the District’s states and in the nation as a whole.
1. Unemployment rate (quarterly, SA)
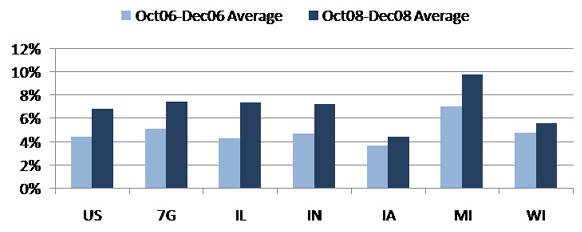
Not all states of the District maintained a higher-than-average unemployment rate over the past few years. As measured in the fourth quarter of 2006 (chart below), Michigan’s high unemployment rate accounted for the bulk of the gap between the District’s rate and the nation’s. By the fourth quarter of 2008, Illinois’ unemployment rate had climbed above that of the nation, and Indiana’s unemployment rate also topped the national average. In contrast, Iowa’s and Wisconsin’s rates of unemployment in 2008 were seemingly lower than those of the overall District and the nation.
2. Unemployment rate (SA)
Federal and state government agencies also track and report payroll employment. These data, released on a monthly basis, are drawn from a sample survey of firms that provide information on their employees; and so, unlike the unemployment figures, the data are not counting those in the work force who are self-employed. Since it is only sample-based, the payroll survey, too, contains measurement error. These errors tend to be more pronounced during times of sharp turns in economic direction (such as the present). During economic downturns, some firms may drop out of the sample as they cease operations. This has tended to understate net job declines, since the sampling methods cannot distinguish between a failed firm and one that is simply late or negligent in reporting. State payroll figures are adjusted for such biases during the first quarter, but even with such adjustments, revised figures do not cover the recent months, but are rather “re-benchmarked” up to a point early in the previous year.
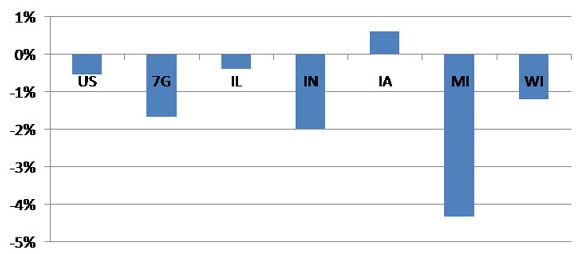
The chart below displays the change in total payroll jobs in the fourth quarter of 2008 relative to fourth quarter in 2006. All states except Iowa lost jobs on net. Over much of this two-year period, Iowa continued to enjoy a boom in farm commodity prices and strong production and sales of related equipment. In the chart, job losses in Michigan and Indiana are especially prominent, reflecting their troubles with their automotive sectors. Using this measure, Wisconsin’s job losses seem to be more severe than what its unemployment rate may have suggested.
3. Payroll jobs (Q4-2006 to Q4-2008, % change)
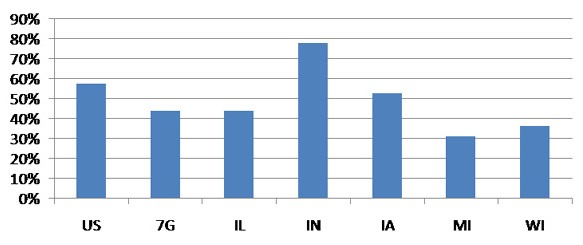
Labor market indicators often conflict both because of inherent measurement error and because they measure different features of the labor market.1 Accordingly, it is often best to gather an array of indicators in assessing labor market conditions. Reported figures from each state’s unemployment insurance (UI) system are also followed. Each state’s UI system records weekly data on new applications or claims for insurance by those who have recently lost their jobs. (Data also report the number of people who have lost jobs and continue to receive unemployment benefits.) These data do not comprehensively reflect labor market conditions. That is because layoffs or other job separation events are only part of the process of net job gain or loss. In particular, job hires or emerging self-employment may be taking place in a state at the same time that job separations are on the rise. The chart below displays changes in initial claims for UI in the fourth quarter of 2008 relative to the fourth quarter of 2006. As compared with the final quarter of 2006, layoffs and other involuntary unemployment events were emerging much more rapidly in late 2008. This is so in the nation and in each of the District’s states. Indiana’s job separations were running especially high late in 2008 as compared with the fourth quarter of 2006—well in excess of the increase experienced nationally. And separations in Iowa have also begun to rise sharply in the fourth quarter.
4. Initial claims for unemployment insurance (Q4-2006 to Q4-2008, % change)
The severity and speed with which labor markets deteriorated during the final three months of 2008 has been especially disconcerting. In the District, jobs declined at a 5.1% pace. Nationally, payroll jobs declined at a 3.7% annualized rate during the fourth quarter of 2008 (1.3 million). Since 1960, payroll job decline in the nation has exceeded this pace in only one quarter, that being the first quarter of 1975 (-6.1%). And currently, most forecasts predict economic output to bottom out no sooner than the second half of this year.
Such concerns are especially acute because job markets recovered slowly in the aftermath of the past two national recessions. Slowly recovering job markets often reflect structural imbalances that have preceded and accompanied recessionary periods. The 2001 recession partly reflected the fallout from overspending on technology-oriented enterprises, such as telecommunications, and other capital equipment. Workers displaced from these sectors might have found it difficult to find jobs in new industries, or the impacted sectors themselves were slow to recover and begin hiring anew. This time around, sharp structural imbalances in housing construction and financial services are underway.
Imbalances that can emerge among different multistate regions in the U.S. can also play a role in achieving “full employment.”2 An industry shock to a particular sector that is highly concentrated in one region may displace workers whose job opportunities may be emerging in another region. Past Midwest experiences are a case in point. The region suffered inordinately through the double-dip national recessions of 1980 and 1981–82. The chart below compares the District’s unemployment rates with those of the nation from two periods: the 1980s and the current decade. By the end of 1982, the nation’s unemployment rate approached 11%, while the District’s unemployment exceeded 13%.
This wide gap of the early 1980s came about from underlying currents having distinct geographical accents. In particular, high oil and natural gas prices were buoying energy exploration activities in many parts of the West and Southwest; rapidly expanding federal spending to rebuild national defense stocks were lifting many regions of the South and West; and the rapidly rising value of the U.S. dollar contributed to moribund exports of farm products and manufactured goods from the Midwest (as well as to stiff import competition).
5. Unemployment rates
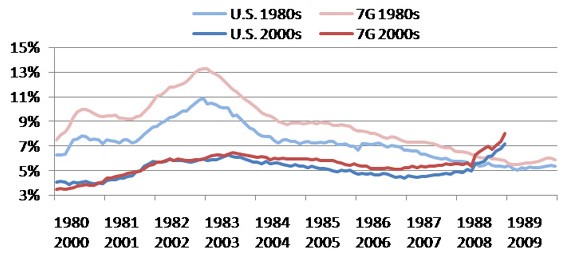
In contrast, the recession of 2001 and its immediate economic aftermath had fewer inter-regional differences. As seen above, unemployment rates between the District and the nation were very similar. As the remainder of the decade unfolded, however, the profound structural changes going on in the automotive industry did begin to negatively affect District labor markets; the District’s unemployment rate began to rise higher relative to the national average. The Detroit Three automakers (Chrysler LLC, Ford Motor Co., and General Motors Corp.) and their suppliers experienced significant losses to foreign-domiciled auto plants located in other regions and to imported automotive products as well. While (post-2001) job levels largely recovered in the District, Michigan experienced continuous year-over-year job losses.
Now, amid a sharp regional downturn, employment statistics will be keenly watched to help guide our decisions regarding job search, education and training, local investment, home sales, and migration.
Footnotes
1 Note: Unemployment rates do not necessarily reflect job trends because working age people can drop out of the work force in response to a lack of job opportunities, thereby lowering the unemployment rate, even though payroll jobs and job vacancies are falling. A worker who drops out of the labor force no longer reports as being “unemployed” in the survey. The reverse can also take place by the same reasoning: Even with a rising number of jobs and employed persons, there can be rising unemployment.
2 Note: Comparing levels of unemployment between periods can be somewhat difficult. The “natural rate of unemployment,” or normal benchmark for a “full employment economy,” is thought to have been higher in the 1980s than today—by about 1 to 1.5 percentage points. The natural rate depends on demographics of the population, such as age and education (affecting labor force participation rates by age). For a discussion, see study by David Brauer, among others.


