Nonmetropolitan counties bouncing back1
In terms of income and population growth, nonmetropolitan counties in the Seventh Federal Reserve District states have had their ups and down over the past few decades. The nonmetropolitan population of the Seventh District has not generally kept pace with its metropolitan counterpart—as in many other parts of the country; the nonmetropolitan areas have continued to (modestly) lose population share in recent decades. Despite this continued share loss in population, nonmetropolitan counties have maintained their standing in per capita income since 1969. This maintenance of per capita income has been achieved amid much upheaval in rural industry structure. Production agriculture has tended to slip in relative importance in many nonmetropolitan counties over the long term, although recent strength in crop prices are lifting fortunes in many rural counties. In places where production agriculture has waned over the long term, manufacturing activity has widely become a backstop. In addition, many nonmetropolitan economies have become more prominent destinations for recreation and retirement.
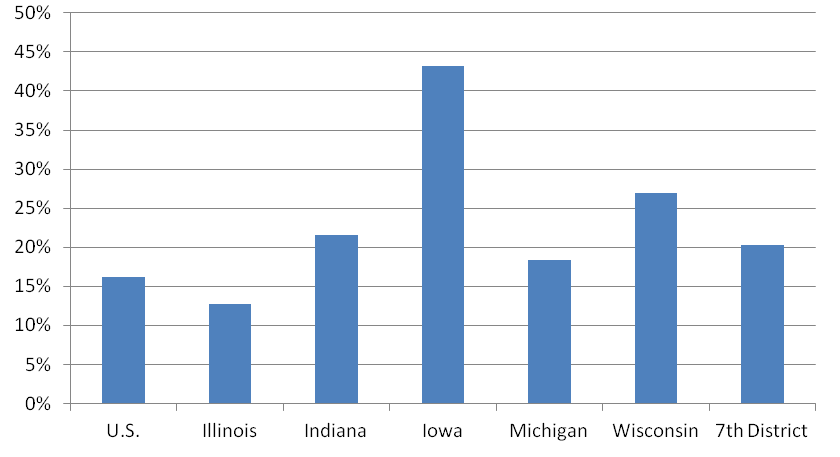
The U.S. population has been urbanizing throughout most of the nation’s history. At its inception, approximately 95% of the nation’s population lived in the countryside. This rural share diminished to about one-half as the twentieth century dawned, and today it amounts to about one-fifth. In the Seventh District, nonmetropolitan counties also account for around one-fifth of the population—ranging from Iowa’s 42.3% of the total population residing in nonmetropolitan counties to Illinois’s 12.8%.
Chart 1. Nonmetropolitan share of population — 2009
In recent decades, urbanization has continued in the Seventh District, albeit at a much slower pace than it has done historically. The nonmetropolitan population of the District made up 21.5% of the total population in 1969 versus an estimated 20.3% in 2009. During the 1970s, nonmetropolitan counties actually gained population share over metropolitan counties in the District.
As seen below, the nonmetropolitan population grew at a healthy pace during the 1970s, and dropped steeply thereafter during most of the 1980s. The 1990s saw a pickup in nonmetropolitan population, followed again by decline during the most recent decade.
Chart 2. Population index Seventh District states (1969 = 1)
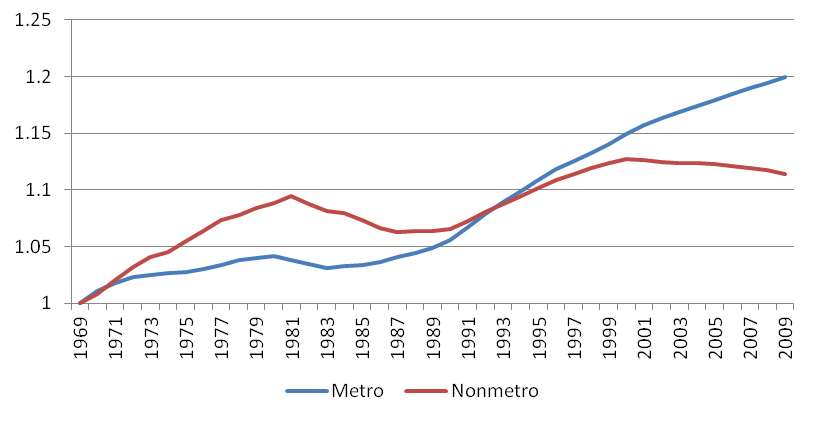
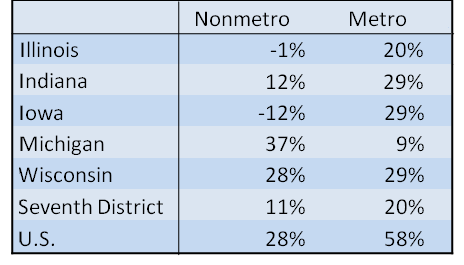
Table 1. Population percent change 1969-2009
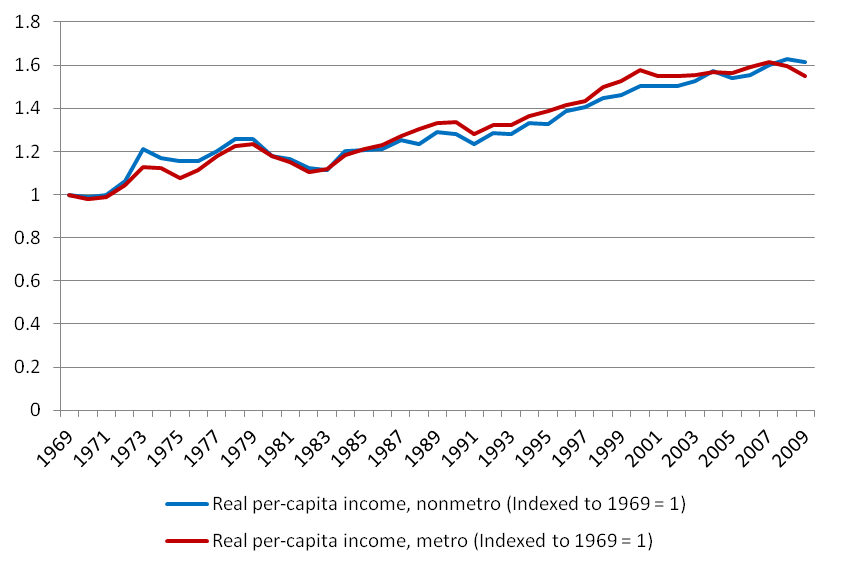
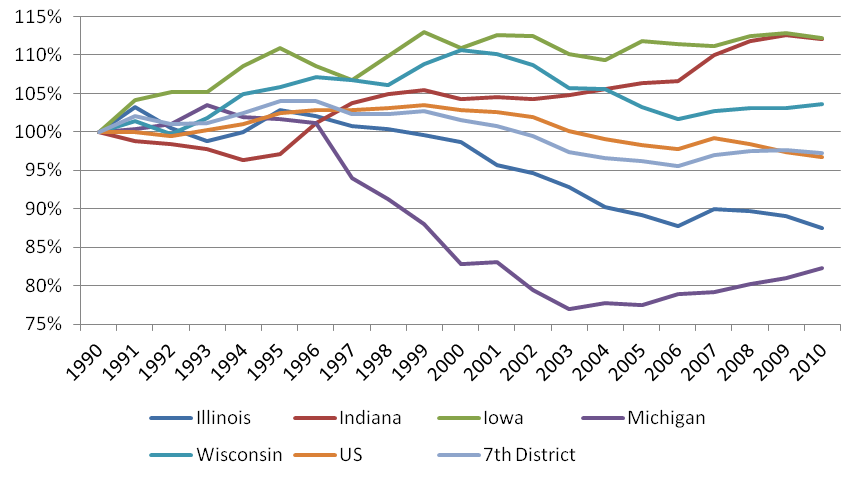
While the population in the Seventh District has continued to shift to metropolitan counties, nonmetropolitan counties have managed to sustain their relative per capita income. Per the chart below, the average nonmetropolitan per capita income gained modestly on that of the metro areas during the 1970s, and then it slipped behind during the subsequent two decades and has rallied somewhat during the past decade. However, within the past two to three years, rising prices of farm commodities—especially those of corn and soybeans—are lifting incomes in many nonmetropolitan counties of the District. The recent rise in agricultural fortunes, along with the farmland boom accompanying it, will be the subject of an upcoming conference here on November 15.
Chart 3. Per capita income Seventh District
The fact that per capita incomes in nonmetropolitan counties have kept pace with those of metropolitan counties over the long run is somewhat remarkable given the shrinking role of production agriculture in directly generating income and jobs. Farm productivity has soared as farm operators have been able to produce more crops and livestock with less per-unit inputs, especially less labor hours. By way of illustration, per-acre crop yields for two of the Seventh District’s major commodities—corn and soybeans—have doubled since the mid-1960s. Such productivity has enhanced the diets of U.S. households and, increasingly, those of the developing world as well. However, productivity gains have also served to lower real prices of raw farm products over the long term, as the demand for them has not kept pace with rising production. In the process, farm income employs and supports and fewer local workers and households. In the Seventh District today, farm production directly generates only 1-2% of the District’s output and income.
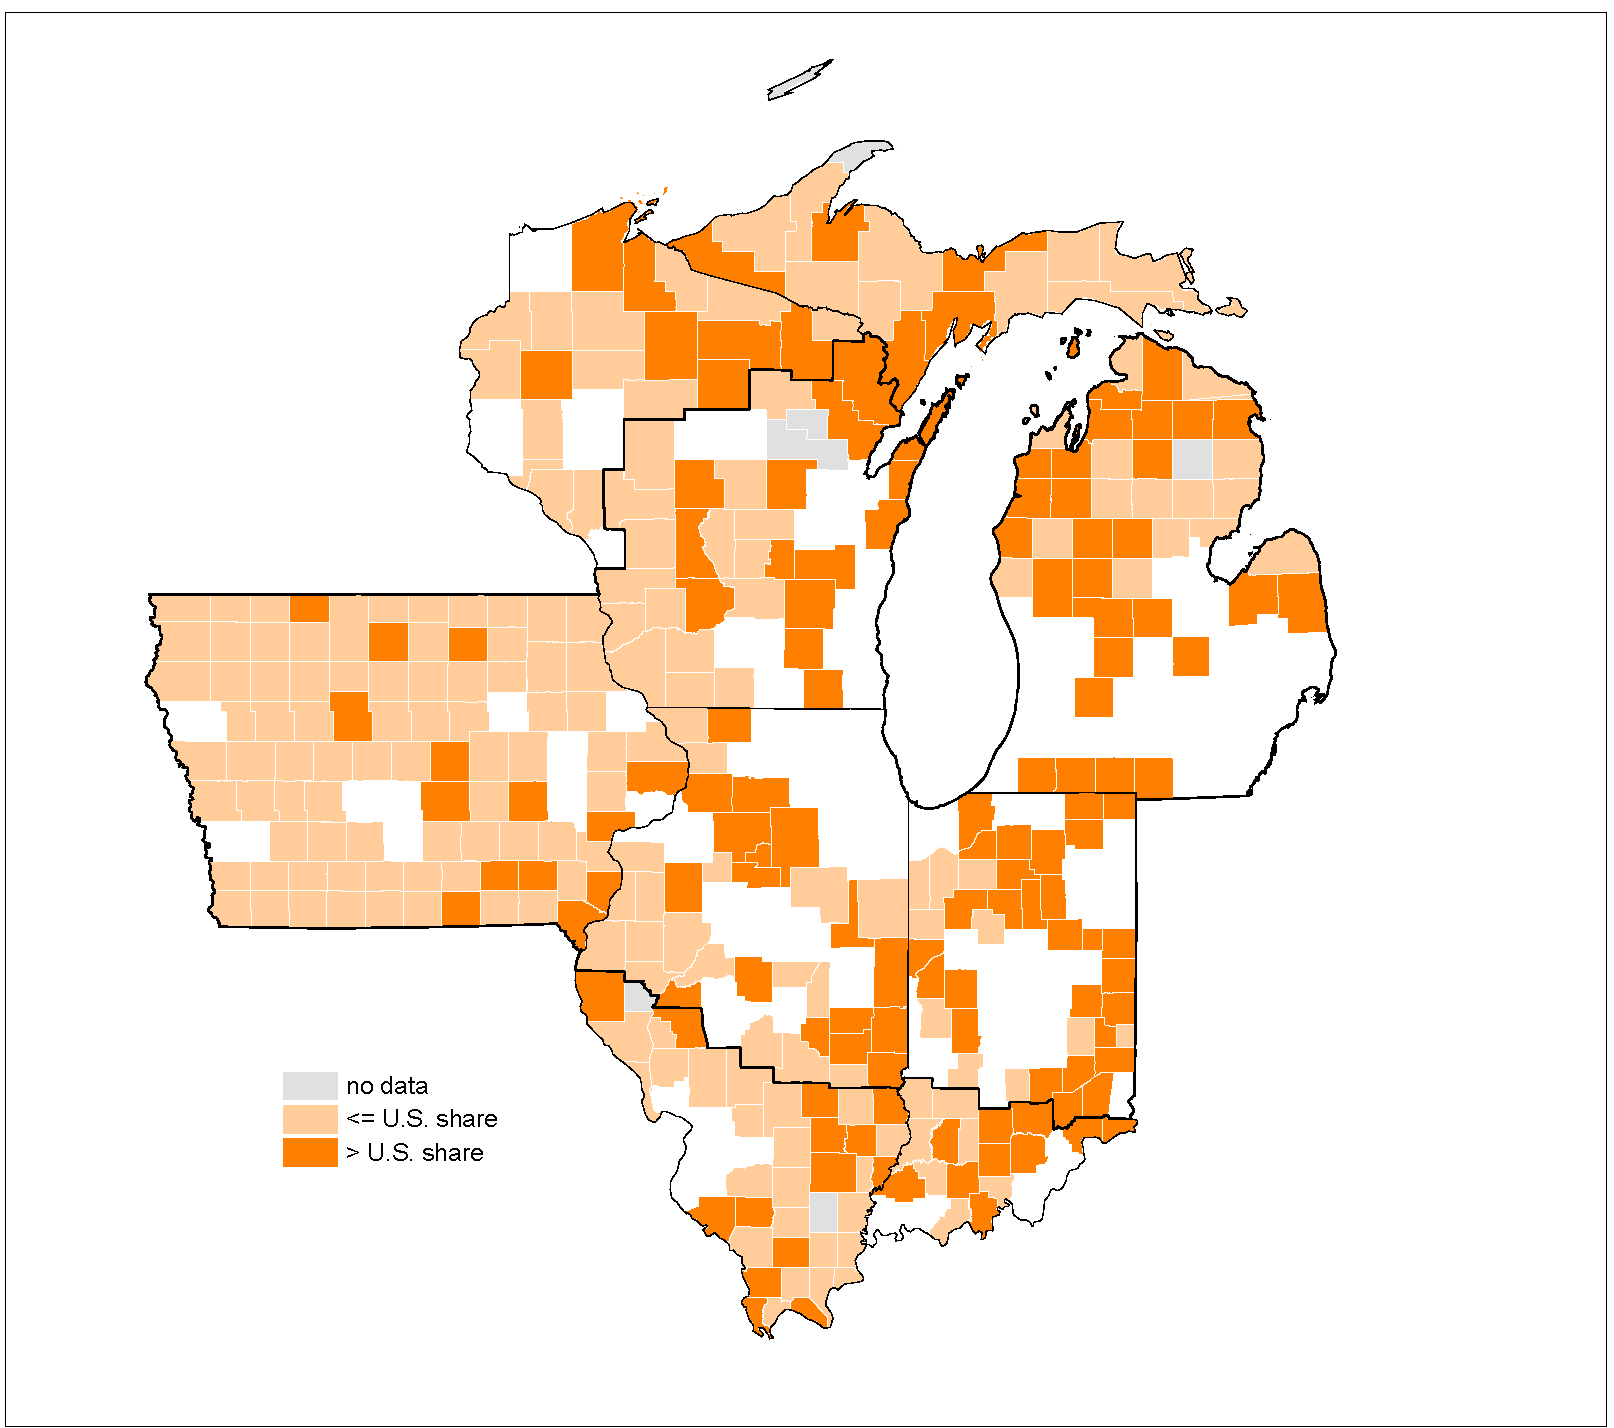
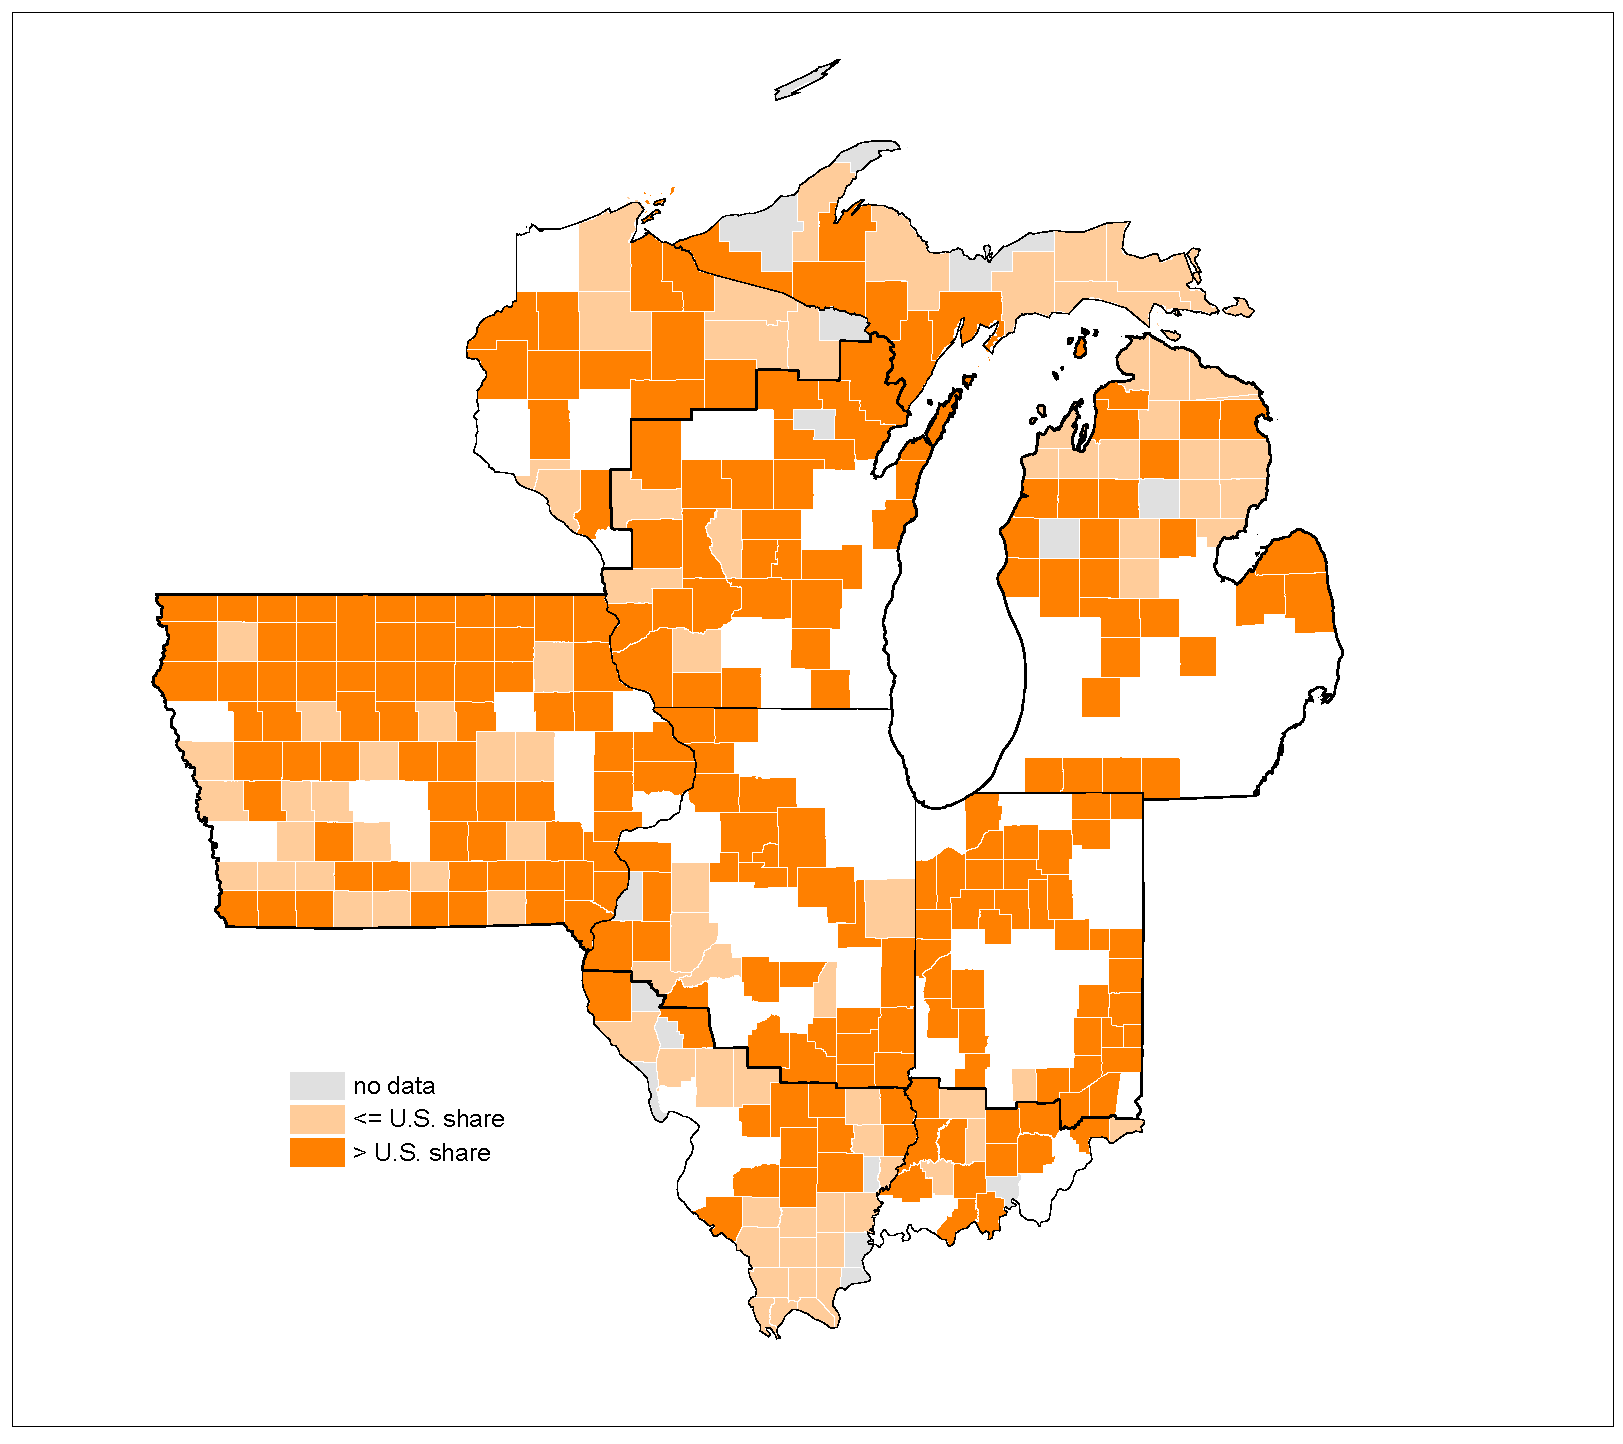
Manufacturing activity has become a major offset to shrinking farm activity in many of the Seventh District’s nonmetropolitan areas. The maps below show those nonmetropolitan counties where the share of income derived from manufacturing activity exceeds the statewide average. In 1969, 53.13% of nonmetropolitan counties could make this claim. By 2009 65.62% of nonmetropolitan counties could do so.
Map 1. Manufacturing shares — 1969
Map 2. Manufacturing shares — 2009
Declining agricultural employment and income account for part of the rising (relative) importance of manufacturing in nonmetropolitan counties. But so do trends favoring a rural location for manufacturing plants as well as a favorable mix of industries that are already concentrated in nonmetropolitan counties. Generally, manufacturing plant location has come to favor nonmetropolitan locations where land prices and transportation costs may be less expensive. The rise of truck and intermodal transportation has especially favored those nonmetropolitan areas with access to highways, along with connections to the more traditional rural roads originally constructed to convey raw farm products. In addition, manufacturing production that is tied to nearby farm products—such as food and ethanol processing—has also performed well, thereby buoying manufacturing employment in nonmetropolitan areas. As the chart below indicates, food processing employment levels in the Seventh District overall have stayed fairly level since 1990, and they have actually gone up in the District’s three more rural states of Iowa, Indiana, and Wisconsin. Over the same period, total manufacturing payroll jobs have declined by 30%.
Chart 4. Food manufacturing employment index (1990=100%)
In many parts of the Seventh District and throughout the U.S., many rural counties have also come to depend on their scenic assets, such as lakes, rivers, and forests, as the basis for economic growth and development. For many rural counties that experienced population and income declines associated with waning agriculture, forestry, mining, and manufacturing, promotion of recreation and retirement can help their reverse their fortunes.
Since employment and income from such activities as tourism (and retirement) are scattered across many statistical categories, researchers Calvin L. Beale and Kenneth M. Johnson have classified recreation-intensive counties by analyzing a variety of data. Their analysis published in 2002 identifies all such “recreation” U.S. nonmetropolitan counties as defined in 1993 (following the 1990 U.S. Census of Population and Housing). Such recreation counties are identified in each of the five Seventh District states, with many of them located in central and northern Wisconsin and northern Michigan. The authors’ find that population growth was higher in recreation nonmetropolitan counties than in other nonmetropolitan counties that continue to depend on farming, mining, manufacturing, and other economic activities. (According to the authors, the same applies to retirement counties—which are defined as those with significant in-movement of older people in the 1980s—relative to other nonmetropolitan counties.) However, they also point out that there may be downsides to the economic development attendant to recreation. Such development may cause environmental stresses on the land and natural resources. Additionally, it can often be in conflict with more traditional economic agricultural activities, such as the raising of livestock. While such conflicts have arisen in the Midwest, more harmonious relationships between agriculture and tourism can also be seen. In particular, agri-tourism and local agricultural sourcing have been on the rise.2
Nonmetropolitan areas of the Seventh District states differ widely in their economic performance and structure. On the average, they struggle to maintain population and economic viability. Even though production agriculture has slipped in importance, it continues to drive the income and attendant economic activities in many rural regions. At the same time, manufacturing, recreation, and retirement are often helpful avenues for many nonmetropolitan counties to develop their incomes and populations.
Footnotes
1 For a longer treatment of this topic, see the opening presentation at the recent Chicago Fed conference titled Economic Development in Rural Wisconsin.
2 See the 2010 Chicago Fed conference titled The Intersection of Midwest Agriculture and Rural Development, available here, as well as the 2009 Chicago Fed agricultural event here.


