What is the Foreclosure Rate?1
When we see reports of the rising foreclosure rate in the media, we get the general sense that the housing market is struggling. While this is generally true, many reports do not accurately characterize the varying struggles from one local housing market to the next. Though reports often use them interchangeably, there are multiple measures of foreclosure rate that offer additional information. In particular, it’s important to distinguish between three related housing market measures: the inventory, start, and transition rates. The last is perhaps the least talked about, though it provides important information that affects the foreclosure inventory significantly.
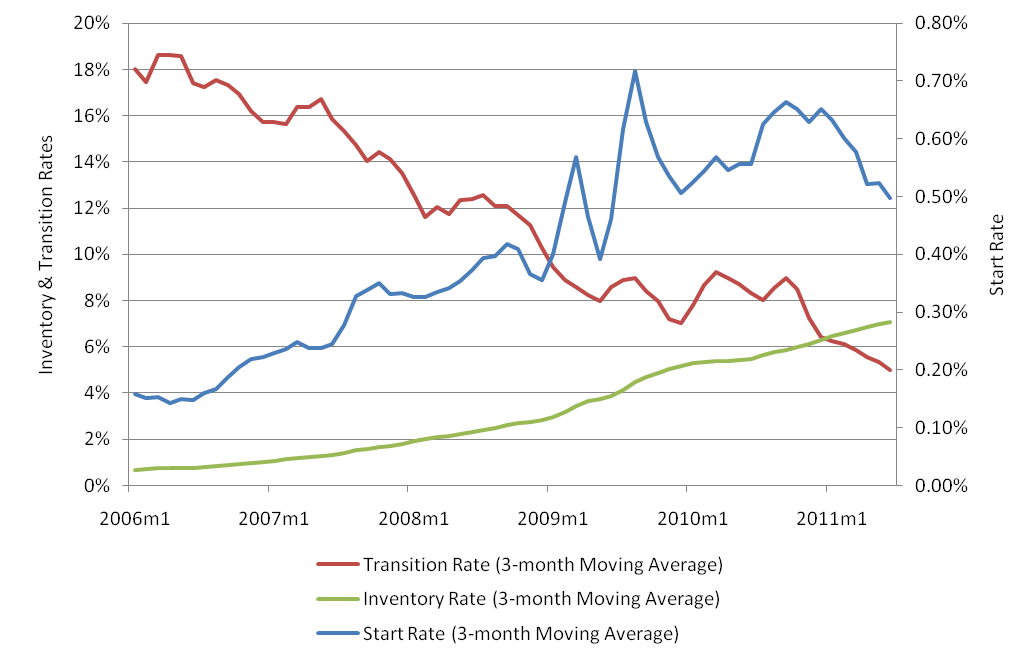
Let’s look at Cook County, IL, to illustrate the differences between these three rates. The inventory rate measures the number of loans in foreclosure at a given time as a percentage of the number of active loans. It is typically referred to as the “foreclosure rate.” In Cook County, this rate was 7.1% as of June 2011.
Behind this rate, however, are two metrics that reflect the two phases of the foreclosure process: 1) the start rate and 2) the transition rate. The start rate represents mortgages going into foreclosure—typically after 90 days of delinquency. Conversely, the transition rate is the rate at which foreclosed mortgages exit foreclosure.
A mortgage may transition out of foreclosure for a handful of reasons, such as a loan modification or a sale. If an area has a low transition rate, mortgages that enter into foreclosure stay in foreclosure for a much longer period. A low transition rate will increase the foreclosure rate, since more and more mortgage will continually be counted as loans in foreclosure. Conversely, if the transition rate is high, that means many loans are exiting foreclosure; thus, the foreclosure rate will be lower, since at any given time there are fewer loans in foreclosure. Cook County’s transition rate was 5.0% as of June 2011.
How do these two rates—the start and transition rates—affect the foreclosure (inventory) rate? If the start rate increases, there is a chance that the foreclosure rate will also increase, unless enough offsetting mortgages leave foreclosure. For instance, in Cook County the start rate was 0.5% as of June 2011.
Chart 1. Foreclosure metrics for Cook IL
To illustrate how these rates are related, we are going to examine Cook County, IL, and Wayne County, MI. If you asked most people which county had a higher foreclosure (inventory) rate, they’d probably answer Wayne County, MI (which contains Detroit). However, as you can see from the chart and data below, Wayne County’s inventory rate is substantially lower than Cook County’s. The fact that Wayne County has been hit hard comes through only by looking at the start rate. Wayne County’s high transition rate implies that foreclosures have been moving through the system quickly. The main difference between the two counties is that Illinois uses a judicial system for processing foreclosures, whereas Michigan has the ability to use a non-judicial process, which tends to speed up the foreclosure process. Only by breaking down the inventory rate into the start and transition rates do we get a clearer understanding for why Wayne County’s inventory rate is lower than Cook Country’s. Conflating these three rates may lead to a mischaracterization of a county’s foreclosure conditions.
Chart 2. Foreclosure metrics for Wayne MI
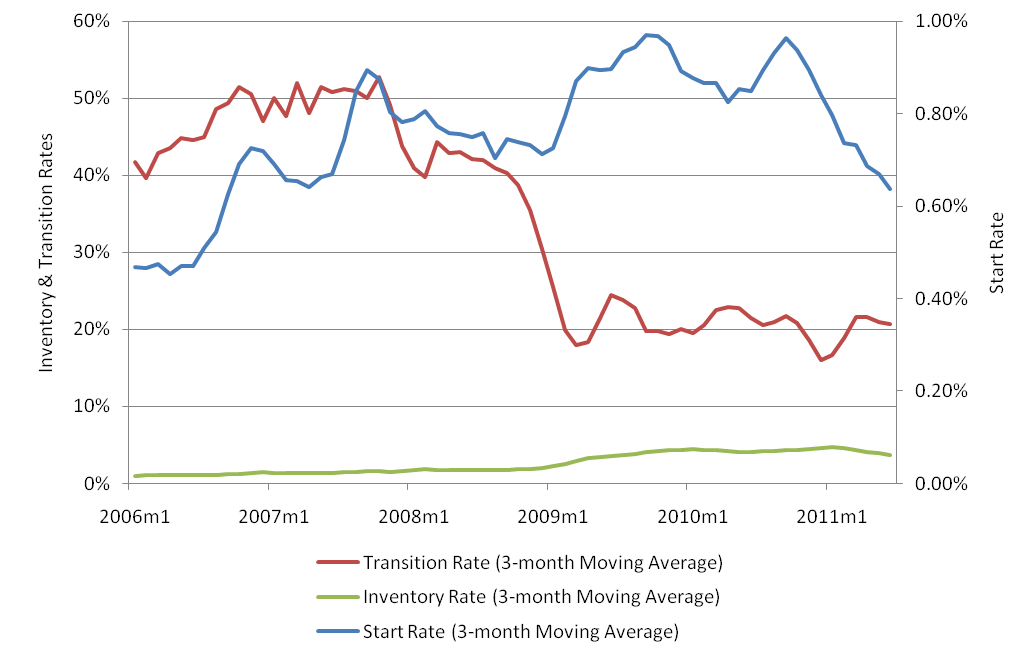
Table 1. Foreclosure rates

As shown, the foreclosure (inventory) rate is a function of both the start rate and the transition rate. The foreclosure rate, accordingly, reflects the trends in the latter two rates.
Please be on the lookout for our next blog entry on foreclosures, written by a guest blogger, that will focus on the triggers of foreclosure.
To get more information on foreclosures, check out the Foreclosure Resource Center.
Footnotes
1 This blog draws on three Federal Reserve items that are also recommended readings:
- Robin Newberger and Daniel DiFranco, 2011, “Beyond the foreclosure inventory: The impact of start rates and transition rates in five counties,” Profitwise News and Views, Federal Reserve Bank of Chicago, April, pp. 2–7, available online;
- Timothy Dunne and Guhan Venkatu, 2009, “Foreclosure metrics,” Economic Commentary, Federal Reserve Bank of Cleveland, April, available online; and
- Charts created by the Federal Reserve Bank of New York, available online.


