Auto Sales and the Seventh District
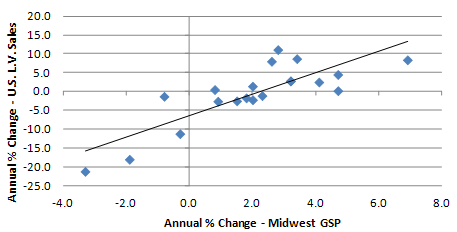
Continued improvement in U.S. light vehicle sales has been good news not only for the automotive industry, but also for the Seventh District. The chart below plots the percentage change in U.S. light vehicle sales against the percentage change in real gross state product for the District from 1991 through 2010. It should not come as any surprise that these two factors are very highly correlated (correlation coefficient of 0.82, where 1.00 would imply a perfect correlation) since four of the five states in the District currently have automotive assembly plants. If we add Ohio’s assembly production to that of the Seventh District states—Iowa, Illinois, Indiana, Michigan and Wisconsin—the region accounts for roughly 50 percent of the total U.S. automotive production. Given this relationship, we would expect last year’s increase in light vehicle sales (up 10.2 percent in 2011 over 2010) to have a favorable impact on the District’s overall economic growth for 2011—those numbers are due to be released later this year.
1. Seventh District's GSP to U.S. light vehicle sales
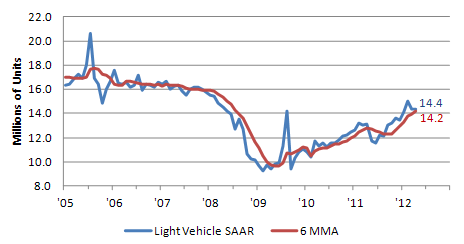
And so far in 2012, sales of light vehicles in the U.S. continue to outperform expectations. The seasonally adjusted annual sales rate for April 2012 was reported to be 14.4 million units; year to date through April, the rate has risen to 14.6 million units. In addition, the share of vehicles sold in April that were produced in North America was estimated to be about 77.3 percent. This is a significant increase from February 2009, when the percentage of North American produced light vehicles sold in the U.S. dropped to just 70.5 percent, reaching its lowest share since November 1986; at the same time overall sales volumes were bottoming at levels not seen since 1974.
2. U.S. light vehicle SAAR
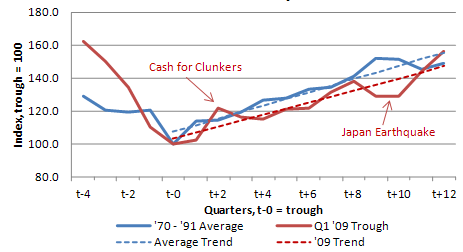
So how do we assess the strength of the current auto sector recovery? The following chart shows the current light vehicle sales recovery compared with those that followed auto industry downturns in 1970, 1974, 1981, and 1991. For comparison purposes, an index for each downturn was created by setting the trough for each cycle to 100. This index comparison shows just how much more severe the initial sales decline was in the 2009 auto recession compared with the average of the previous four downturns. However, it is interesting to see that the current recovery has followed the average of those four recoveries fairly closely, except for two notable points in time. At both of those points in time, there were identifiable events that seem to have had significant effects on the auto industry.
The first event was the Car Allowance Rebate System (CARS), also known as “cash for clunkers.” This was a $3 billion program that was intended to provide an incentive for Americans to purchase more fuel-efficient vehicles by trading in their less fuel-efficient ones. The Department of Transportation reported that nearly 700,000 clunkers were taken off the road during this program, resulting in 684,941 new vehicle purchases. It’s difficult to say exactly how many of those sales were incremental purchases, but it resulted in a spike in vehicle sales as purchases were pulled ahead from subsequent months. The decline in the sales rate immediately following the end of the program made it appear as if the recovery in vehicle sales might be stalling.
The second event that stands out clearly is the March 2011 earthquake in Japan. While it is difficult to calculate the earthquake’s precise impact on U.S. light vehicle sales, it is clear that the auto industry’s recovery was adversely affected by the supply disruptions that followed this disaster. Over time, however, this might have added to pent-up demand as consumers waited for product availability from their preferred manufacturers.
Even with these two outliers in the data, this auto sector recovery seems to track average past auto sector recoveries fairly closely for the 12 quarters following the bottom of the cycle.
3. Auto recession cycles
The recent recovery of the U.S. auto industry has been good for the Seventh District for many reasons, but most notably for employment. Between December 2009 and March 2012, the District has seen a 2.9 percent increase in nonfarm payroll employment, compared with an increase of 2.7 percent nationally. Even better, the District has seen a 9.1 percent increase in manufacturing jobs, compared with an increase nationally of just 4.1 percent. In fact, the Seventh District has accounted for 38 percent of the entire nation’s manufacturing jobs added during this timeframe. And it looks like there may be potential for adding even more jobs in the Midwest if auto sales continue to rise.
4. U.S. light vehicle sales forecast
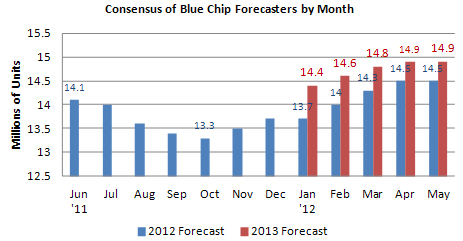
The May 2012 Blue Chip consensus for U.S. light vehicles for calendar year 2012 now stands at 14.5 million units having been increased five times since bottoming in October of 2011 at 13.3 million units. That equates to a 1.2 million unit increase in the light vehicle sales forecast. And at 14.5 million units, this forecast is still 100,000 units below the industry’s performance year to date, which implies that there may be further upside potential for auto sales in the coming months. Next year looks even better— 2013 sales of light vehicles are now projected to be 14.9 million units.
This recent surge in sales appears to have taken some of the region’s auto producers by surprise. General Motors announced this week that it is increasing its U.S. light vehicle forecast for 2012 by 500,000 units, bringing its revised forecast up to 14.0 to 14.5 million units. Ford Motor Company’s expectations for this year seem to be even more optimistic, anticipating total sales of 14.5 to 15.0 million units. In fact, according to a recent article in the Financial Times, Ford plans to add 400,000 units of production capacity. However, its market share still might fall, because production increases are lagging demand. And Chrysler announced that it will not be observing its traditional two-week summer shutdown in four of its assembly plants, so that it can produce additional vehicles to address the increase in demand. This news from Chrysler is especially good for the District, which hosts three Chrysler assembly plants—two in Michigan, the Jefferson North Assembly Plant and Sterling Heights Assembly, and one in Belvedere, Illinois.
Even though the pace of this improvement seems to have come as somewhat of a surprise, there were indications that sales were getting ready to improve. As reported earlier this year by R. L. Polk, the average age of cars and trucks on U.S. roads hit a new record of 10.8 years on July 1, 2011. That is up from 10.6 years in 2010. Used vehicle prices have continued to increase, providing the consumer with added equity to use as a down payment at trade-in. Employment levels are slowly improving, helping to improve consumer sentiment, as measured by the University of Michigan’s Consumer Sentiment Index. In addition, Comerica Bank announced that vehicle affordability, as measured by vehicle price relative to median income, recently improved to its best reading since the third quarter of 2009. And finally, higher fuel prices might actually be working as an incentive for consumers to replace their less fuel-efficient vehicles with newer more fuel-efficient ones. So, all things considered, there may be more positive surprises in our future.


