Understanding manufacturing labor and wage trends
The number of net jobs held by workers in the manufacturing sector have declined markedly in recent decades—and especially so during the recent recession. Yet, manufacturers bemoan shortages of skilled workers, even while they tout emerging employment opportunities. What is the possible disconnect that is at play in the manufacturing sector? For one, worker shortages may not apply to all categories of workers, but rather to those with high or specialized skills. Across the entire U.S. economy, employers have had sharper needs for workers with greater levels of skills and educational attainment in recent years. And so, manufacturers may find it difficult to meet their own needs in this regard. If this is the case, one place to look for evidence would be in the wages of workers who are now in manufacturing. How have wages and compensation in the manufacturing sector changed over the years?
One of the longest-running data series on manufacturing wages is available from the U.S. Bureau of Labor Statistics (BLS). The BLS provides data on the hourly wage of nonsupervisory and production workers in manufacturing. In the chart below, we show these data with some modification. In particular, we convert the data into dollars of constant spending power using the personal consumption expenditure deflator. The average wage below is expressed in today’s dollars, running from the end of 2011 back through 1947.
In interpreting the wage trend, we must exercise some caution for two reasons. First, the hourly wage data cover a variety of workers, including those involved in fabricating, processing, storing, handling, shipping, maintenance, janitorial services, and recordkeeping. And so, the “mix” of workers across occupations may have been changing over time so that wage comparisons across time periods may be somewhat distorted. Second, the data only report on wage and salary compensation and not on worker benefits, such as deferred retirement benefits and health care insurance. Since the 1980s, health care insurance costs have been generally rising as a share of compensation for the overall U.S. work force—and within the manufacturing industry as well.1 And so, wage trends alone may understate the changes in overall compensation.
Figure 1. Real average hourly earnings: Manufacturing (PCE deflated, 2011 $/hr)
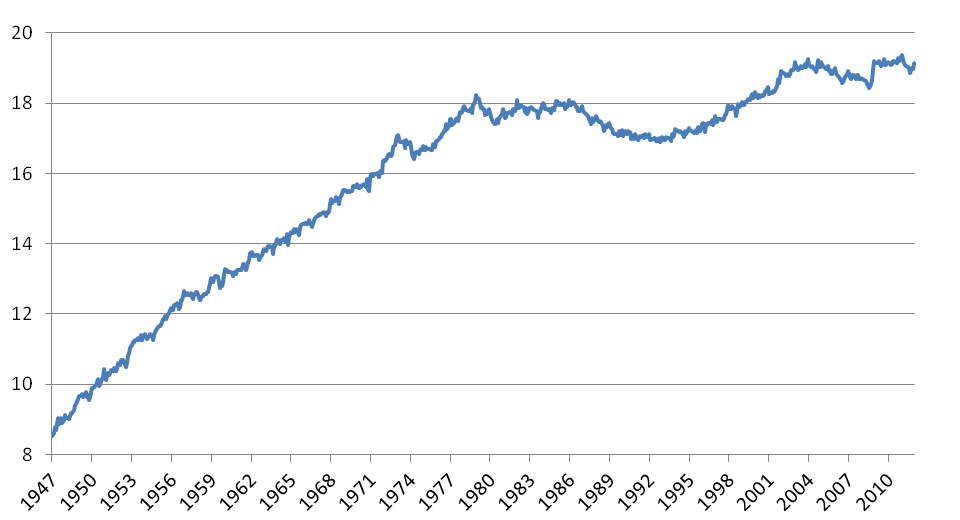
With these cautions in mind, it appears that real wages in manufacturing grew steadily from 1947 through the late 1970s. After a dip in wages near the very end of the 1970s, wages have since remained largely constant.
Much of the policy discussion about job opportunities and compensation in manufacturing is qualified by notions that work in the sector increasingly requires higher-skilled laborers, and that demands for such workers are frequently exceeding the supply of qualified candidates. The BLS data above are not adequate for analyzing the manufacturing labor force by fine classification and skill level; however, the U.S. Census Bureau’s Census of Manufactures data featured below has long differentiated the wage bills of production workers from those of nonproduction workers in the manufacturing sector. The nonproduction category comprises nonline supervisors, along with white collar positions, such as executives, engineers, designers, sales staff, and research and development (R&D) personnel.
This is not to say that all nonproduction workers are more skilled than all production workers, but the general tenor of the classification suggests so, on average. In particular, the annual earnings levels are higher for nonproduction workers (as we might expect them to be). In 1947, the average wage of nonproduction workers was 60% higher than that of production workers; as of 2007, the average wage of nonproduction workers was 70% above that of production workers.
On further inspection of these data back through 1947, we notice a similar pattern of earnings for both production and nonproduction workers in manufacturing. Much like the BLS data on hourly wages, the Census Bureau data on annual earnings of production workers climbed until the late 1970s before flattening out or rising mildly.
Figure 2. Manufactruing workers — average annual earnings
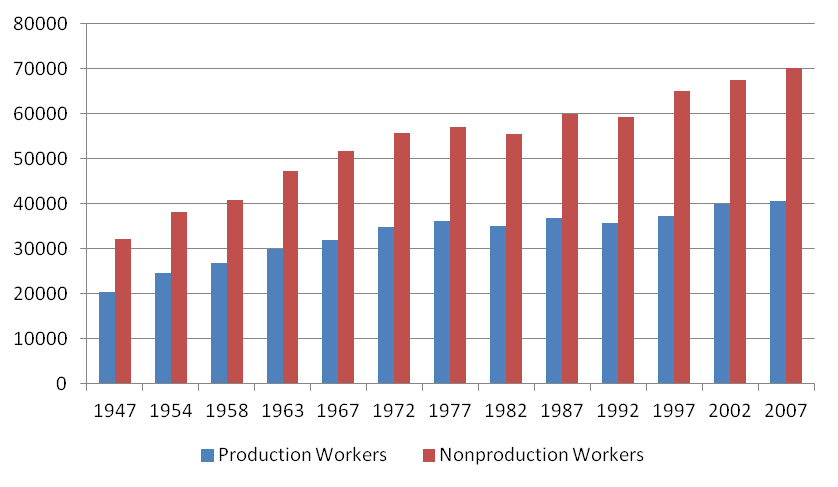
However, in contrast to production worker wages, nonproduction worker wages have registered some modest post-1977 growth. This somewhat more robust wage growth of nonproduction workers (relative to their production counterparts) hints at a nearly universal trend among such workers (and occupations) over the past three and a half decades. In other words, the compensation and rewards for gaining higher skills and education have been sharpening in the U.S. economy—and not just in manufacturing. Changes in the industry structure of the U.S. economy have encouraged the growth of work requiring greater skills and education. The advent of new technologies in the workplace—such as the Internet, computing equipment and software, and advanced machinery—have put a premium on higher levels of skills and education. At the same time, global competition in some industries has also dampened low-skilled wages and profits.
Across the entire U.S. work force, the average levels of skills and formal education of successive generations of workers have also been rising markedly for many decades. Under most circumstances, such an increased availability of skilled workers might be expected to put downward pressure on their compensation and wages. Evidently, such effects have been more than offset by rising demands in the U.S. for workers with higher levels of skills and educational attainment.
In a recent Chicago Fed Letter we document the fact that average worker skills, as measured by years of school completed, have been on the rise in the U.S. since the 1990s. Using educational attainment (i.e., years of school completed) as a proxy for skills of workers, we find this to be the case in both the manufacturing and nonmanufacturing sectors. In fact, educational gains among workers in manufacturing have outpaced those among workers in nonmanufacturing between the year 1990 and an average of the years 2000–07. For example, while shares of workers who have attained “some college” or at least a four-year degree remains higher (on average) in the nonmanufacturing sector, the gaps in these shares between manufacturing workers and their nonmanufacturing counterparts have closed considerably over this time period.
Have manufacturing wage benefits gone up as more workers “upskill”? In the chart below, which draws on the 2011 Chicago Fed Letter, we see the percent change in wage gains in both sectors—manufacturing and nonmanufacturing. Within each individual sector, patterns of relative wage gains by education are similar. In both the manufacturing and nonmanufacturing sectors alike, wages of those workers having higher educational attainment have increased sharply, while the wages of workers with only a high school diploma and below have languished.
It is also evident that when we compare wage gains at the same level of educational attainment, average wage gains have been stronger outside of manufacturing. Indeed, “upskilling” in manufacturing has taken place, resulting in higher-paying jobs; but for those workers who have similar levels of educational attainment, wage gains in manufacturing have not kept pace with those in nonmanufacturing.
Table 1. Average hourly wages, by educational attainment and industry
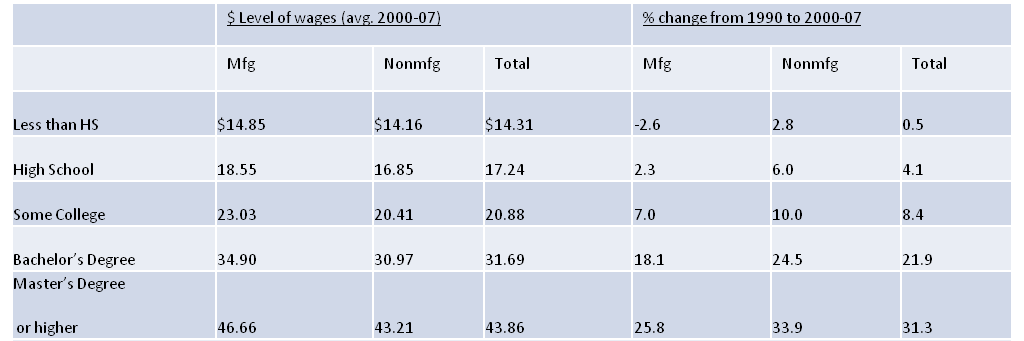
Sources: Authors' calculations based on data from the U.S. Census Bureau, 2990 Census of Population and Housing, Public Use Microdata Samples, 1% sample; and 2000-07 American Community Survey.
Such evidence is far from the last word on wage compensation in the manufacturing sector, but it appears that manufacturing employers have been struggling to compete with nonmanufacturing employers for workers with greater levels of skills and educational attainment. In both sectors, wages have grown more rapidly for those with higher educational attainment. Relative to the nonmanufacturing sector, the manufacturing sector continues to pay a premium to its workers at nearly all levels of educational attainment. However, the manufacturing wage premium has possibly eroded since 1990, as wage gains in manufacturing have not kept pace with nonmanufacturing wages, on average.
Note: Thanks to Norman Wang for assistance.
Footnotes
1 As reported by the Employee Compensation Index of the BLS, wage and salaries across all civilian workers in manufacturing industries have increased 5.5% 1981, while total compensation, including benefits, has increased 17.8%.


