Economic Growth in the Near Term for the Industrial Midwest
What are the near-term prospects for economic growth in the industrial Midwest? In part because the Midwest is steeped in the production of durable goods, such as automobiles and machinery, its economy has long experienced more-pronounced swings over the business cycle than the overall U.S. economy. The current expansion following the Great Recession has been no exception. Until last year, the Midwest economy was generally outperforming the national economy. But weakness in manufacturing exports due to slowing global economic growth emerged in 2012.This weakness is giving those of us tracking the Midwest’s economic progress a reason for pause.
In order to better track the pace of the Midwest’s economic growth, the Chicago Fed unveiled its very own Midwest Economy Index, or MEI, in early 2011. The MEI shows that for the most part, the region’s economic growth has been exceeding its own long-run trend since mid-2010 (blue line in the chart below). At the same time, the so-called relative MEI—which provides a picture of Midwest growth conditions relative to those of the nation—has been indicating that regional economic growth has mostly been outperforming U.S. economic growth over the same period (red line in the chart below). And because the Midwest economy (as well as the national economy) still has ample slack four years after the Great Recession’s conclusion in mid-2009, many are still hoping—and perhaps still expecting—that the Midwest economy’s robust performance will continue.
Chart 1. Midwest Economy Index (MEI), relative MEI
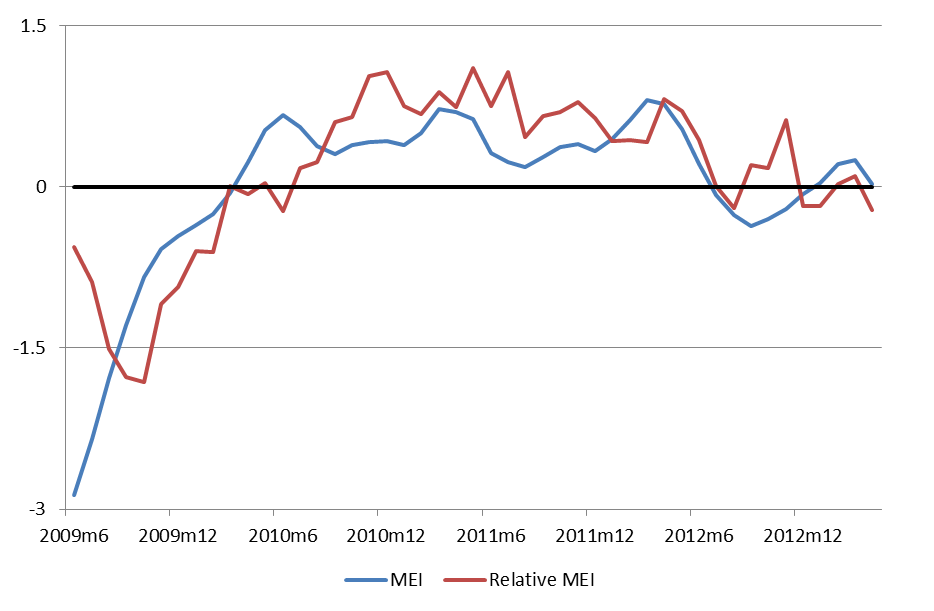
Alas, if the past year has been any indication, the economic trends do not look favorable for the Midwest’s near-term prospects. As shown above, concurrent with the economic slowdown of the United States during 2012, the pace of the Midwest’s economic growth fell back into line with both its own long-run trend and its long-run relation to the nation’s economic performance. The manufacturing sector—whose level of production had fallen by more than 20% during the Great Recession—was leading the recovery, increasing its pace of production rapidly since the end of the downturn in mid-2009 through the early part of 2012. From June 2009 through April 2012, manufacturing output grew at an annualized rate of 6.1%. However, from April 2012 through May 2013, manufacturing output expanded at an annualized rate of 1.8%—more than a percentage point lower than its historical growth rate. Is this trend likely to continue?
The pace of the U.S. economic recovery, as well as that of the Midwest recovery, will depend partly on the pace of economic growth abroad, especially that of our major trading partners. No small part of the of the 2010–11 Midwest resurgence stemmed from the revival in manufacturing production for export abroad. In particular, manufacturing goods continue to account for a majority of U.S. and Midwest exports.
Export levels dropped off precipitously during the Great Recession (which lasted from the beginning of 2008 through mid-2009) before surging during the subsequent economic recovery. However, the pace of global economic growth slowed markedly during 2012, bringing down U.S. exports and reducing the overall pace of U.S. economic growth. The European financial crisis was partly responsible for the recessionary or nearly recessionary conditions in that part of the world last year. Meanwhile, China and the other Asian nations continued to grow in 2012, but at a slower pace than in previous years. The weakening conditions abroad are not expected to reverse course dramatically this year—and perhaps we will not see them improve markedly over next few years.
The effects of slower global growth can be seen in the performance of the Midwest’s exports. As seen below, the growth of manufactured exports in the Seventh Federal Reserve District (which comprises all of Iowa and majors parts of Illinois, Indiana, Michigan, and Wisconsin) had been climbing since the recessionary year of 2009—and doing so at a faster pace than the overall United States. Since early last year, however, exports in both the Seventh District and the nation have leveled off, with the Seventh District’s pace giving back previous gains on the nation’s (see chart below).
Chart 2. Manufactured exports (index, 2009=1), Seventh District vs. U.S.
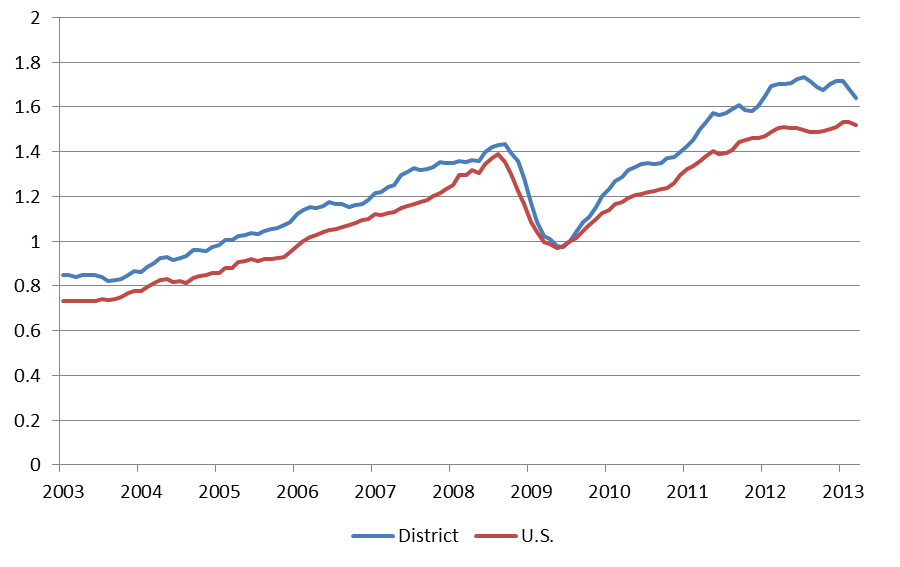
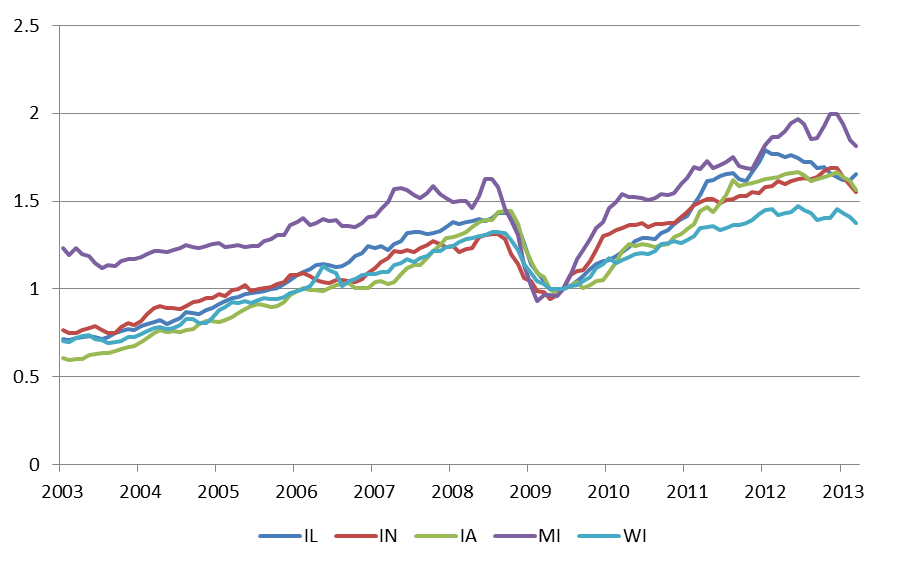
Chart 3. Manufactured exports (index, 2009=1), Seventh District states
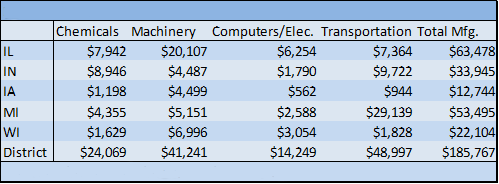
The four largest manufacturing export sectors in the Seventh District—which account for over two-thirds of the total value of its manufacturing exports—are as follows: chemicals, machinery, computers/electronics, and transportation (see table below). The distribution of these four industries are not, however, uniform across the Seventh District states; there are notable differences from state to state. For example, the transportation equipment sector holds the lion’s share of exports from Michigan, although much of this trade is destined for nearby Canada, where it will ultimately be reexported to the United States. Machinery exports dominate Iowa, Illinois, and Wisconsin—much of it is made up of agricultural, manufacturing, and mining equipment that is destined for regions throughout the world.
Table 1. Export value in millions, 2012
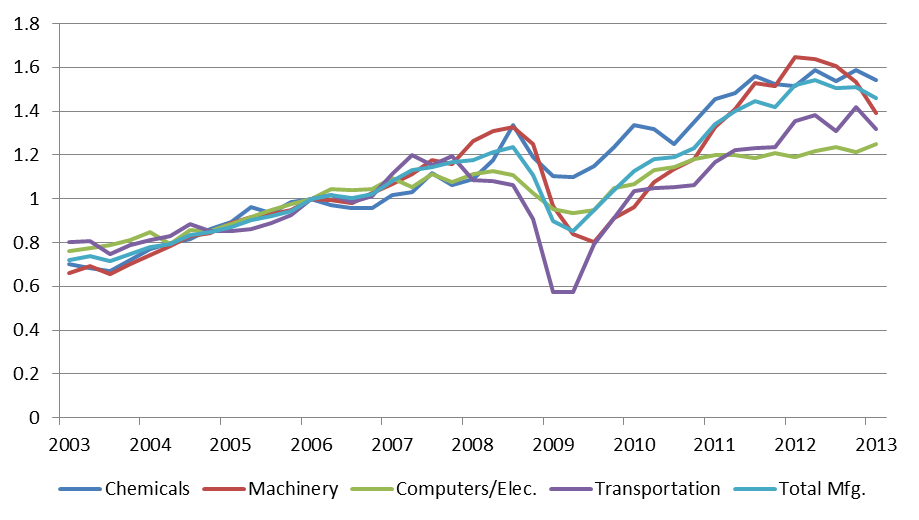
Looking further at trends by individual industrial sector reveals sources of weakness and strength for the Seventh District’s export performance (see chart below). The effects of weakened demand for mined commodities (such as coal and metals) and slower global economic growth in general are evident in the sharp reduction of the machinery sector’s exports. In contrast, the transportation sector’s exports have continued to climb. This largely reflects continued strength in light vehicle sales (i.e., car and light truck sales) in North America (and South America) rather than demand for these vehicles in Europe and Asia.
Chart 4. Manufactured exports by industry sector (index, 2006=1)
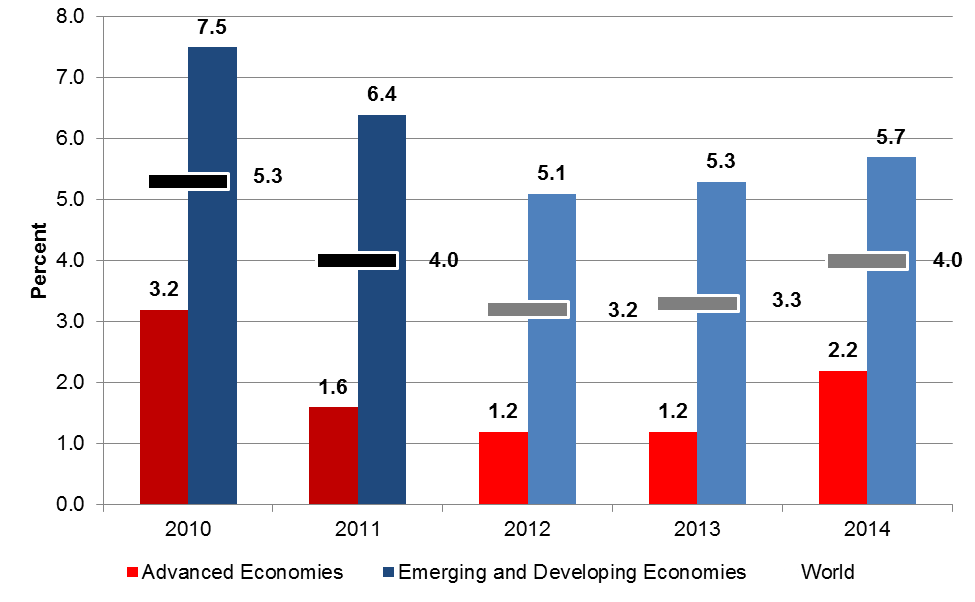
Despite strength in the transportation sector, the outlook for renewed growth in exports of manufactured goods is not robust in the near term. For the remainder of the current year, forecasts of global economic growth are weak, and they have recently been revised downward (see chart below). In the International Monetary Fund’s (IMF) most recent twice-yearly forecast, it lowered its forecast of global growth to 3.3% from 3.5%. The IMF also cut its 2014 forecast for global growth to 4.0% from 4.1%. By contrast, the global pace of growth in 2006 (before the Great Recession) and 2010 (soon after the Great Recession) exceeded 5%.
Chart 5. IMF forecast for growth (April '13), percent change yr/yr
For the Midwest region, then, hopes of improvements in its manufacturing output lie with countertrends in domestic spending. In addition to the automotive sector being on the upswing, home construction activity has begun to climb nationally, albeit from very low levels. U.S. home completions have risen by over 30% (200,000 units at a seasonally adjusted annual rate) in the first quarter of 2013 relative to both 2012 and 2011. Historically, new home construction tends to spur new light vehicle sales, especially those of pickup trucks. So, too, sales of home-building materials, such as gypsum board, cement, and prefab housing components, are pulled up by home construction. To these may be added sales of home fixtures and appliances, although a large share of such goods are now shipped into the Midwest from other U.S. regions and imported from abroad.
Declining federal defense procurement due to sequestration, as well as other sources of budget retrenchment (including state–local government financial stress), will also weigh on Midwest manufacturing. For the most part, however, the Seventh District states rank low in per capita spending amounts of federal government procurement, so that lower federal spending will not be felt to the same degree as in many other parts of the country.1 In the Seventh District, the largest manufacturing-related segment affected by reduced spending on federal defense procurements is trucks and military vehicles: Companies, including Oshkosh Truck Corporation (in Wisconsin), Navistar (in Illinois), and some automotive compaines are likely to be affected by reduced federal defense procurement spending.
Generally, those of us living in the Midwest do have reason for concern when national and global factors weigh on the domestic manufacturing outlook. Now is no exception.
Footnotes
1 For fiscal year 2010, all Seventh District states except Wisconsin ranked below 35th in per capita procurement spending from the federal government. Wisconsin ranked 14th that year.


