Economic Development in Des Moines, Iowa
The Des Moines MSA (metropolitan statistical area) economy has developed a strong mix between financial and professional service firms and manufacturing. In addition, the city benefits from being the capitol of the state, leading to a high concentration in state government employment. Large employers in the area include Wells Fargo (banking), Principal Financial (financial services), Mercy Medical and United Point Health (both health care), DuPont Pioneer (agribusiness), John Deere (agricultural machinery), Marsh (insurance), and UPS (shipment and logistics).
Des Moines MSA Industry Structure
To get a sense of which industries are most important to the metropolitan area’s economy, we can look at its employment concentration in industries relative to the U.S. Table 1 shows the employment percentage for each industry for both the U.S. and the Des Moines MSA. For example, Des Moines has only two industries where the share of local employment is above the national share of employment—wholesale trade and management of companies. In addition, the table provides location quotients (LQs)1 that demonstrate the relative concentration of each industry in the Des Moines MSA compared with the U.S. A reading of 1 indicates that Des Moines has the same industry employment concentration as the U.S. As the table shows, Des Moines has significantly above average employment concentrations in two industries—wholesale trade at 1.27 ( or 27% above the U.S. average) and management of companies at 1.17. Additionally, Des Moines’s industry concentrations are roughly in line with the U.S. averages for such important industries as construction, retail trade, administrative and waste services, and arts and entertainment. The industries that are much less represented in Des Moines are agriculture, mining, and utilities (although clearly agriculture is of key importance to Iowa as a whole). Interestingly, two sectors that the city targets for growth, professional and business services and manufacturing, have relatively low concentrations (0.74 and 0.64, respectively). In the case of professional and business services, an issue with the data is that nondisclosure rules do not permit an LQ to be calculated for the important finance and insurance sector, which is likely to have high levels of professional employment.
Table 1. Des Moines MSA employment shares, 2012
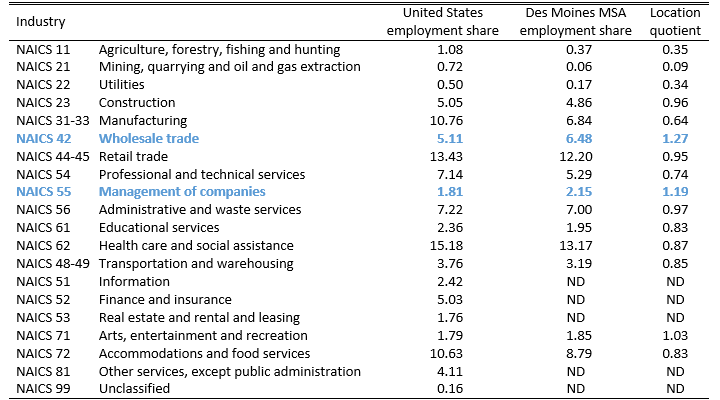
Source: US Bureau of Labor Statistics and Haver Analytics
Des Moines MSA Economic Development Strategy
The Greater Des Moines Partnership led an effort to develop a five-year plan for Des Moines and the capital region. The plan aims to position Des Moines as a midsized city with a specialized industry base. It focuses on an industry and demographic comparison with other similar regions, including Omaha, Nebraska, Madison, Wisconsin, and Denver, Colorado. The plan identifies key clusters in which the region is most competitive and recommends that the region market itself specifically to these sectors: finance and insurance; information solutions; health and wellness; agribusiness; manufacturing; and logistics.
The other elements of the plan are similar to most of the other cities’ development plans in stressing appropriate human capital development and work force training. In particular, the Des Moines plan emphasizes developing an employment and training pipeline that meets the needs of local businesses. There is also a geographic component to the plan, targeting growth along the I-35 corridor.
If one reviews the strategy relative to the data on industry structure, it becomes clear that the targets for development consist of a mix of large employment centers (finance and insurance) and logistics-related wholesale trade, as well as historically important industries, such as manufacturing and agribusiness. Manufacturing does not currently represent a high employment concentration in Des Moines, so its inclusion may signal a hope to revive the sector. Given recent speculation that manufacturing is seeing favorable conditions for reshoring of jobs and activities (due to factors such as lower energy costs), many midwestern cities are hoping to restore some manufacturing activity. Finally, Des Moines also benefits from a stable fiscal situation. While the city’s credit rating was recently downgraded by Moody’s due to unfunded pension obligations, it still has an Aa2 rating. And the state government’s fiscal condition is relatively solid.
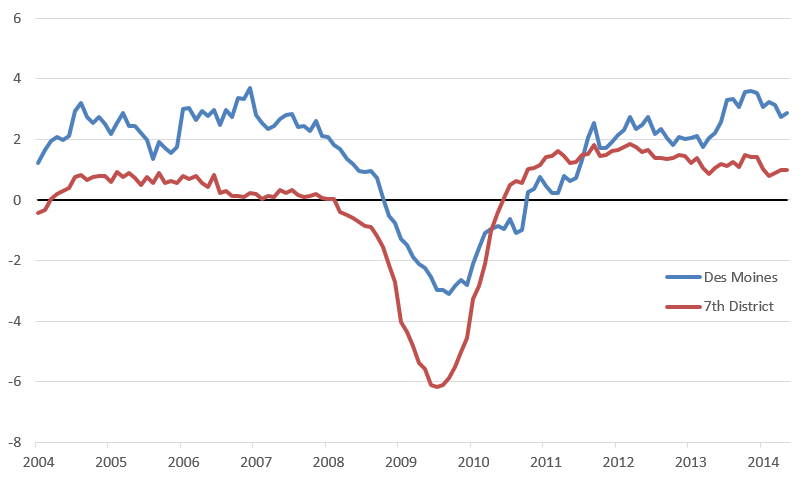
Finally, Des Moines’ recent economic performance has been quite strong relative to much of the Seventh District. The following chart shows the year-over-year growth in payroll employment for Des Moines versus the Seventh District average. With the exception of a brief period coming out of the Great Recession, the MSA’s employment growth rate has been favorable. In particular, Des Moines has opened a significant gap with the District since 2013.
Figure 1. Employment growth: Des Moines and Seventh District (percent change year over year)
Footnotes
1 The U.S. Bureau of Labor Statistics (BLS) defines LQs as “ratios that allow an area’s distribution of employment by industry to be compared to a reference or base area’s distribution”.


