How Do the Chicago Fed’s Business Contacts Expect to Spend Their Federal Tax Windfall?
On December 22nd of last year, President Trump signed the Tax Cuts and Jobs Act, a law that makes substantial changes to the federal tax code for individuals and businesses. An important provision of the act is tax cuts for both groups worth an estimated $1.46 trillion over the next ten years. Congress’s Joint Committee on Taxation estimates that businesses will pay $330.4 billion less in taxes over that period, with more than two-thirds of the reduction coming in the first three years.
In the run-up to the tax bill’s passage, there was a substantial debate about what businesses would do with the extra money from the tax cuts. Commentators in favor of the bill generally argued that strong competition would force businesses to invest their tax savings in capital, which would result in higher worker productivity, output, and wages. Commentators opposing the bill generally argued that weak competition would allow businesses to forgo spending on capital and labor and instead allow them to pay out increased profits to shareholders.
While it is still too soon to know what business leaders will actually do, it is possible ask them what they expect to happen. We did just that: We asked the respondents to our Chicago Fed Survey of Business Conditions (CFSBC) how they expect the new tax act to affect their businesses and how they expect to spend their tax windfalls (if they get one). While the sample size is fairly small and not representative of the universe of Seventh Federal Reserve District firms, the results do offer some perspective on these very interesting questions.
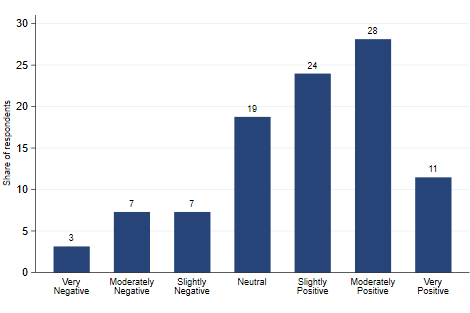
Figure 1 shows the results from our first question. It reports that 63 percent of respondents expect the tax act to have a positive impact on their firms. Most respondents who expect a positive impact anticipate a direct effect on their firms’ net incomes, though some said that while they do not anticipate a direct effect on their firms, they do expect the act to stimulate the economy, which would result in greater demand for their firms’ products. The few respondents (17%) who said they expect the tax act to have a negative impact were from multiple sectors. However, one sector that we survey—nonprofits—was particularly negative about the tax act because they believe that the large increase in the standard deduction will encourage more households to not itemize, thereby reducing the incentive to make charitable donations.
Figure 1. I believe the tax bill's impact on my firm will be...
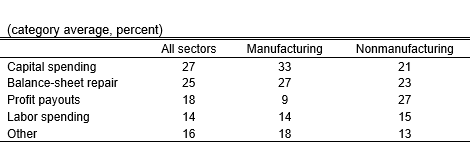
We next asked our contacts how they expect to spend their tax windfalls, if any. Sixty percent of the respondents answered this question. Businesses have options in addition to capital spending, labor expenditures, and profit payouts, such as mergers and acquisitions, price decreases, and balance-sheet repair (i.e., holding more cash, paying down debt, or buying other financial assets). Figure 2 shows the average share our contacts expect to put toward each major spending category. The largest was capital spending (27%), followed by balance-sheet repair (25%), profit payouts (18%), and labor spending (14%). Our manufacturing contacts expect to spend a greater share of their savings on capital and balance-sheet repair than our nonmanufacturing contacts.
The results shown in figure 2 suggest that there is some truth to the arguments made in favor of the act and those made in opposition to it. Our contacts expect to spend about 40% of their tax savings on capital and labor and just under 20% on profit payouts. They also expect to spend a large share on balance-sheet repair, which could be interpreted as a wait-and-see approach: Rather than spend the money now, they plan to put their firms in a better financial position for the future.
Table 1. Expected allocation of tax savings by sector
Look for a follow-up blog post about a year from now, when we will be able to learn how things went for our business contacts after a year under the new federal tax regime.
Appendix
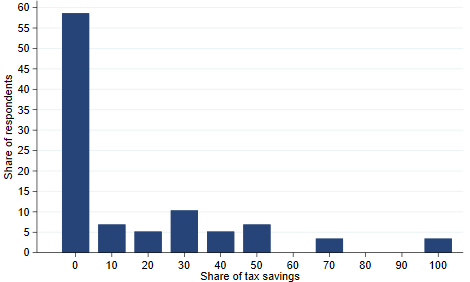
Below is the full distribution of responses for how our contacts expect to allocate their tax savings across each of the five spending categories.
Figure 2. Expected share of savings allocated to capital
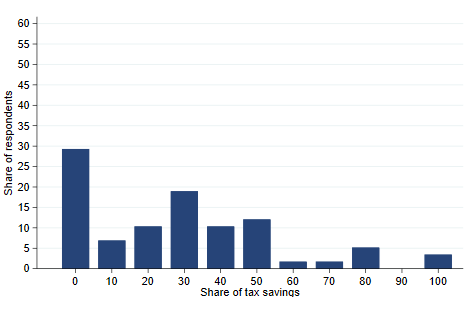
Figure 3. Expected share of savings allocated to labor
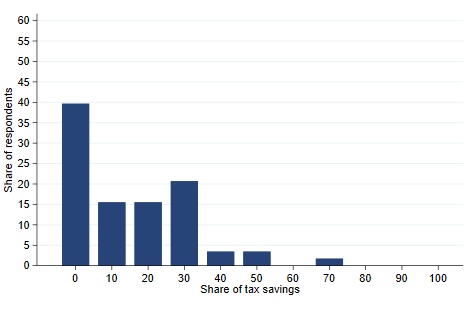
Figure 4. Expected share of savings allocated to balance-sheet repair
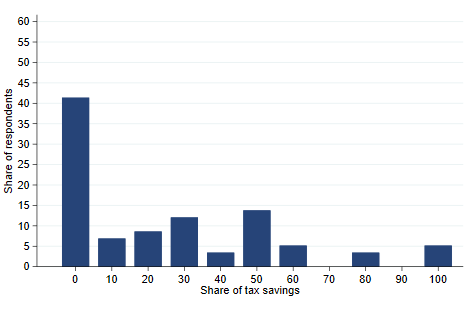
Figure 5. Expected share of savings allocated to profit payouts
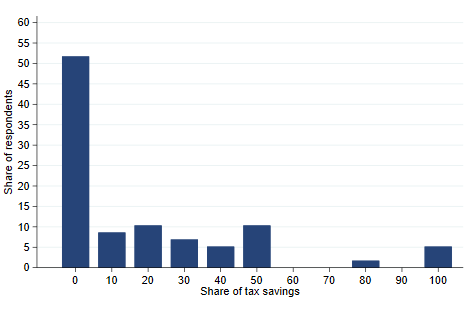
Figure 6. Expected share of savings allocated to other spending categories