Has Chicago’s Employment Growth Accelerated? Probably Not
The Chicago metro area’s employment growth rate appears to have accelerated over the past year according to recent federal government data. But is that really the case? In this post, I show that because the employment growth data are based on a survey of employers, the apparent acceleration is probably the result of sampling error—and likely to be revised away as additional data become available. We won’t know for sure what has actually happened until March of 2020, which is when the U.S. Bureau of Labor Statistics (BLS) will release its results for all nonfarm workers, rather than those based on just a sample of these workers.
To put the possible acceleration of the Chicago metro area’s employment growth in context, it is helpful to compare Chicago with a couple of other related places. Figure 1 shows Chicago’s 12-month employment growth rate together with that of the Midwest and the average of the 20 largest metro areas (by population) in the United States (including Chicago). These comparisons are intended to roughly capture two of my favorite theories of what drives Chicago’s economy. The first theory is that Chicago is the capital of the Midwest economy and that the metro area’s growth is a function of what’s going on in the geographic region surrounding it. The second theory is that Chicago is a “global city,” whose growth is a function of its participation in a network of the largest metro areas (both here and abroad) that provide high-skilled services worldwide. Both theories probably have some validity, but which one is winning out? Figure 1 indicates that in recent years, Chicago’s employment growth has looked much more like that of the Midwest than that of the nation’s 20 largest metro areas. However, in the past year, Chicago’s employment growth appears to have accelerated and is now closer to that of the largest metros in the country. It’s possible that the parts of Chicago’s economy that make it a global city are starting to spread their wings.
1. Employment growth
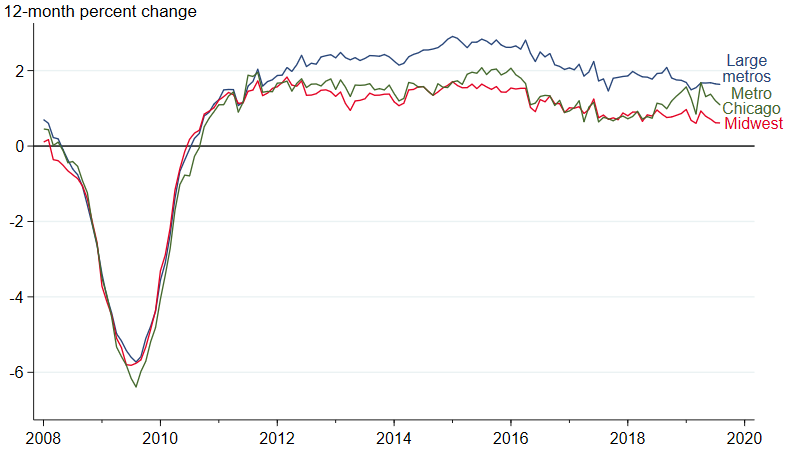
Source: Author’s calculations based on data from the U.S. Bureau of Labor Statistics from Haver Analytics.
The recent employment data are certainly good news, but we must be cautious about making strong conclusions from them because they are subject to potentially large revisions later. That’s because the most recent data come from a survey of businesses. The BLS’s Current Employment Statistics (CES) survey covers about 30% of businesses, which means that we can get a pretty good idea of what employment growth is. Yet there’s a chance the survey results will differ from what actually happened to 100% of businesses. Eventually the BLS updates its survey numbers using data on the full 100% universe of firms. But it takes a while—we will get revisions for the fourth quarter of 2018 through the third quarter of 2019 in March 2020. In the meantime, we have to settle for a range of possibilities for what the true growth rate could be. In figure 2, the dashed portion of the Chicago line represents data that are survey-based and not yet updated to reflect the full universe of firms. The gray area is the range of values that the BLS says we can expect growth in the Chicago metro area to fall into with 95% certainty. The range is large enough that the true 12-month growth rate could be as high as the average rate of the 20 largest metro areas or as low as the rate of the Midwest.1
2. Employment growth with confidence intervals for Chicago
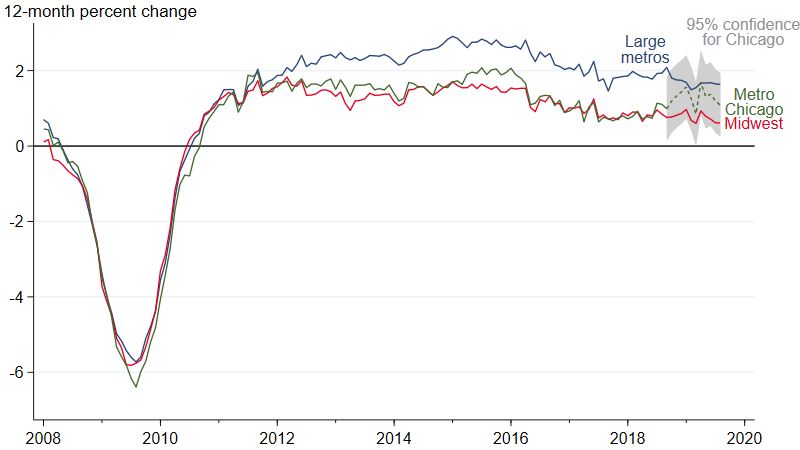
Source: Author’s calculations based on data from the U.S. Bureau of Labor Statistics from Haver Analytics.
While we have to wait until March of next year to get the official revisions to the survey results, it turns out that we can now make a quite accurate guess of what the revisions will be from another BLS data set called the Quarterly Census of Employment and Wages (QCEW). The QCEW is the official release of data for all workers covered by the unemployment insurance program, which is around 97% of the workers in the universe of CES employment data (remember that the CES survey covers only about 30%). The QCEW data come out five to seven months after the end of a reference period, so we can’t know from them what has happened in recent months, but we can now get a very good idea of what happened in the Chicago metro area through March 2019, which is six months into the survey-based portion of the CES data. Figure 3 adds to figure 2 the employment growth rate of the Chicago metro area according to the QCEW data. It is clear that the Chicago QCEW data follow the Chicago CES data quite closely—at least until the survey-based portion of the CES data starts. Once the survey data take over there is a noticeable difference, and unfortunately, this difference is undesirable for Chicago. The QCEW numbers suggest the acceleration of job growth in Chicago that we’re seeing in the survey-based portion of the CES data is really just sampling error. Moreover, they imply that the Chicago metro area’s true growth rate has stayed closer to the Midwest’s growth rate—at least through March of this year. So, given that QCEW data are much more accurate, it is likely that the Chicago metro area’s growth rate continues to be closer to that of the broader geographic region than the average of the nation’s largest cities.
3. Employment growth with confidence intervals for Chicago, plus QCEW data for Chicago
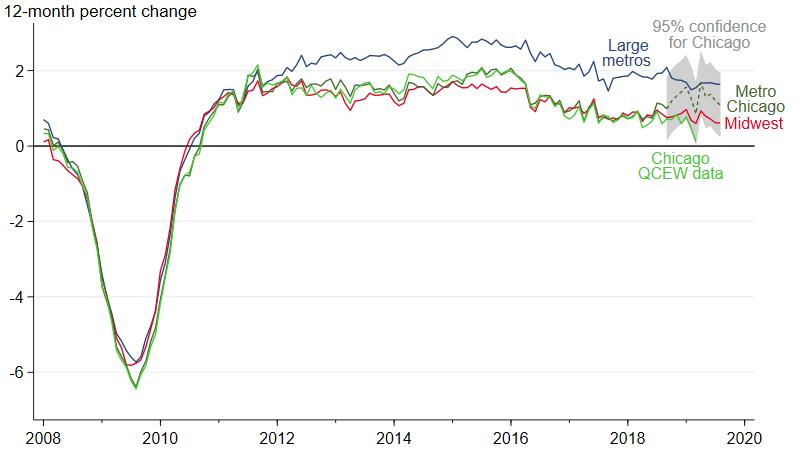
Source: Author’s calculations based on data from the U.S. Bureau of Labor Statistics from Haver Analytics.
Notes
1 The large metros and Midwest lines also have confidence intervals that aren’t shown. The intervals are smaller because they cover a much larger population.


