The Role of Manufacturing in Explaining Employment Growth in the Midwest Since 2000
Employment growth in the Midwest1 has been slow over the past 20 years. As figure 1 shows, since 2000, employment has gone up by just 3.3 percent in the Midwest, whereas it has risen by 21.5 percent in the rest of the U.S. The 2000s were particularly bad for the Midwest in terms of employment growth—employment in the region never fully recovered from the 2001 recession before the Great Recession hit. The Midwest ended the aughts with 9.3 percent fewer workers than when it started. And even though the number of workers in the region has grown steadily during the recovery from the Great Recession, the Midwest’s annual employment growth rate has only averaged 1.4 percent since 2010, while the rest of the nation’s has averaged 1.9 percent.
What’s going on in the Midwest? In this post, we show that since 2000, there has been a strong negative relationship between manufacturing concentration and employment growth, at both the state and metro area levels, across the U.S.
1. Index of employment
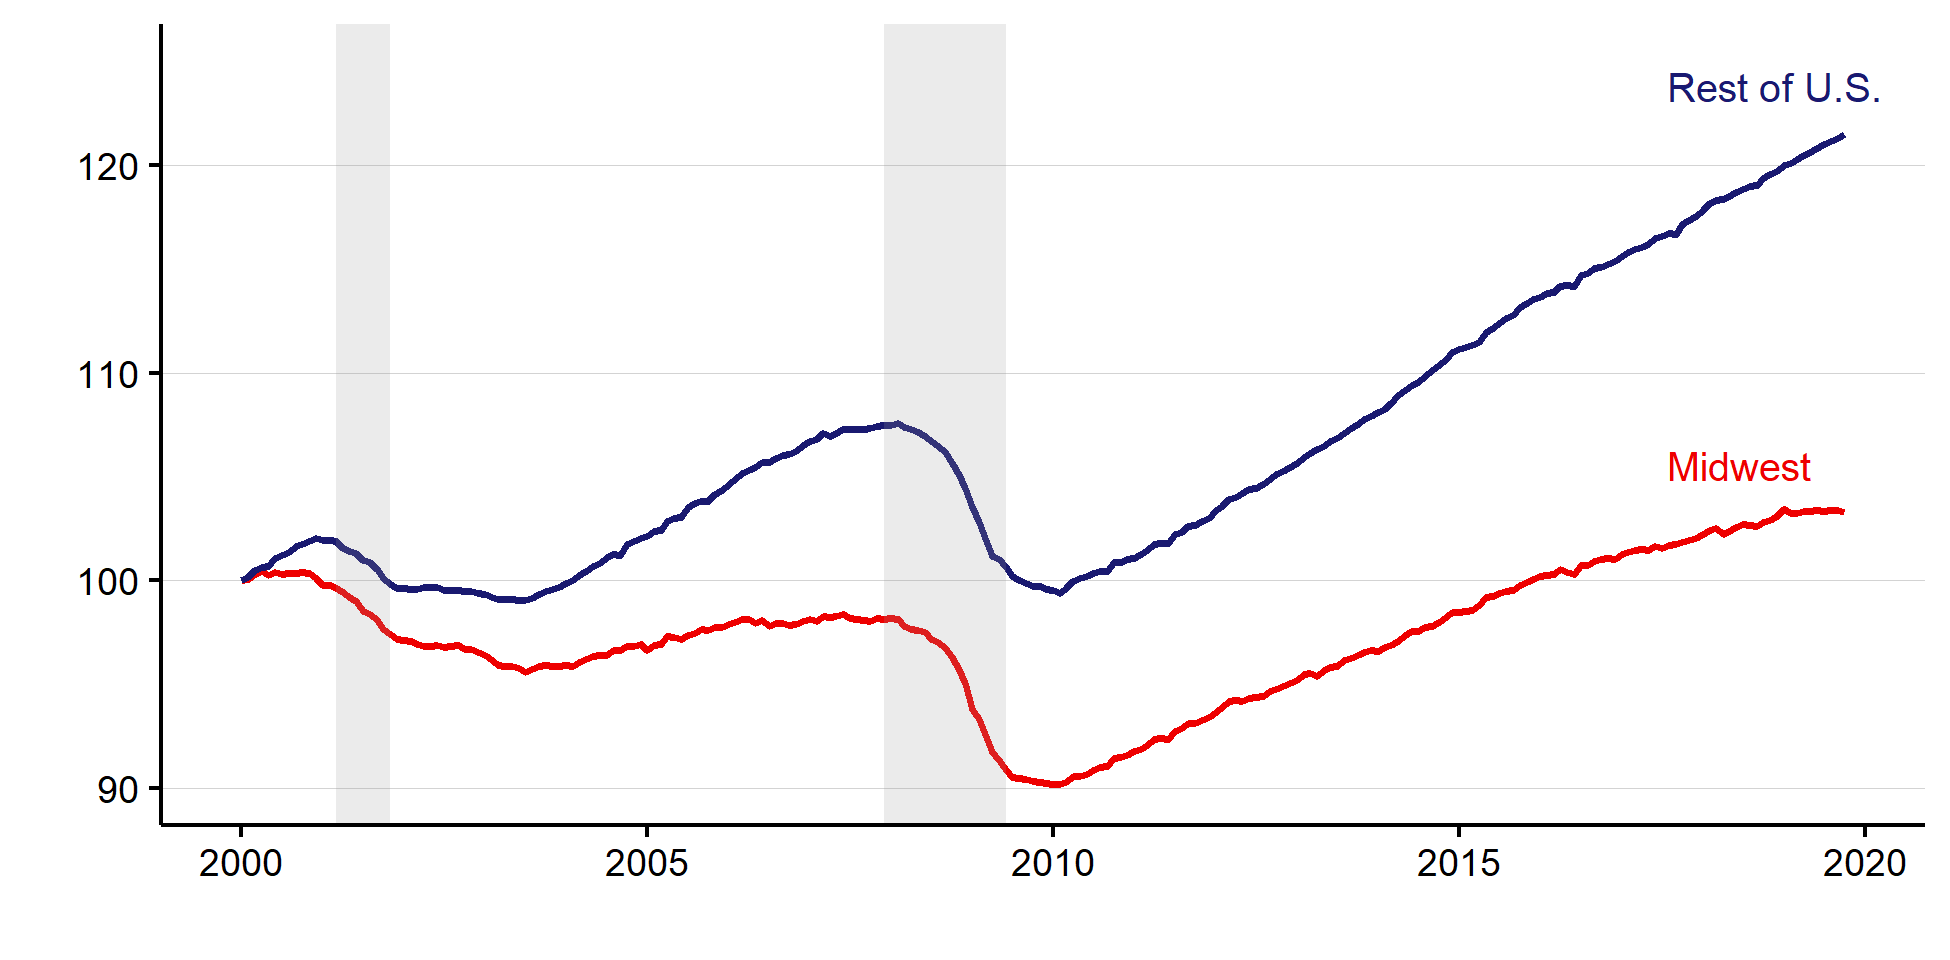
Source: Authors’ calculations based on data from the U.S. Bureau of Labor Statistics from Haver Analytics.
Manufacturing has long been recognized as an important driver of local employment growth because it produces “traded” goods—i.e., goods that are sold nationally or internationally rather than only locally. Traded goods industries—such as oil and gas extraction, manufacturing, finance, and software development—support employment in other industries that primarily provide services locally—such as retail, health care, and education. This means that new employment in traded goods industries can have a “multiplier” effect because it also tends to lead to new employment in local industries. Thus, in theory, growth in a region’s traded goods industries should be a good predictor of growth in overall employment in a region.
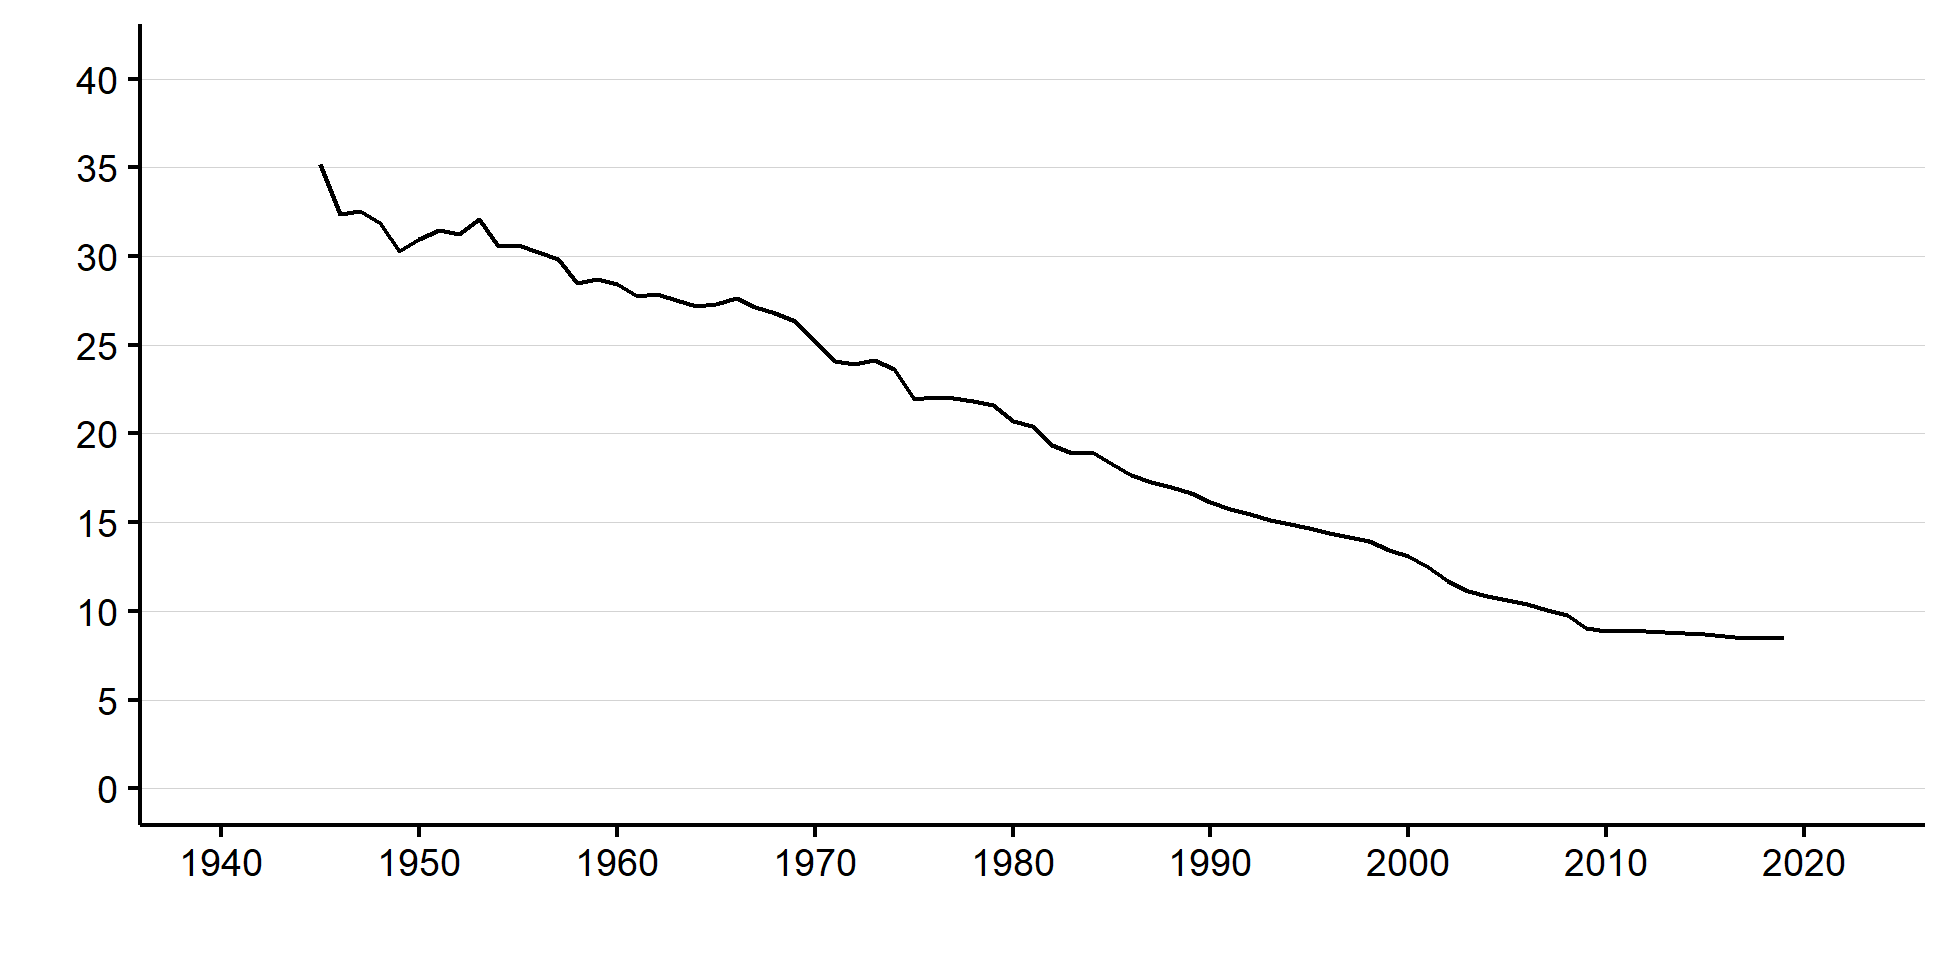
Manufacturing has also long been an industry in relative decline. Figure 2 shows that the share of U.S. workers in manufacturing has steadily fallen from over 30 percent in the 1940s to about 8 percent today. This decrease suggests that places where manufacturing is an important industry should have slower employment growth than other places. This is not to say that such places must have negative employment growth—the industries taking employment share from manufacturing can be expanding everywhere—but that we should expect to find slower growth in places with a concentration of manufacturing and faster growth in places with concentrations of industries taking employment share from manufacturing.
2. Share of U.S. employment in manufacturing
The Midwest has traditionally been the center of U.S. manufacturing, and the region’s steady loss of factory jobs earned it the “Rust Belt” moniker decades ago. So, while our analysis focuses on the recent past, the relationship between manufacturing and slow employment growth has a much longer history. And because the Midwest remains heavily concentrated in manufacturing today, the likely scenario going forward continues to be slower job growth than other parts of the country.
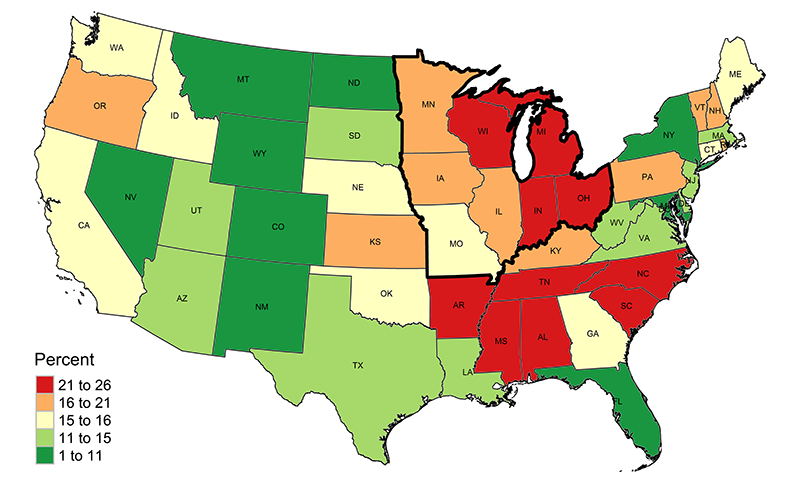
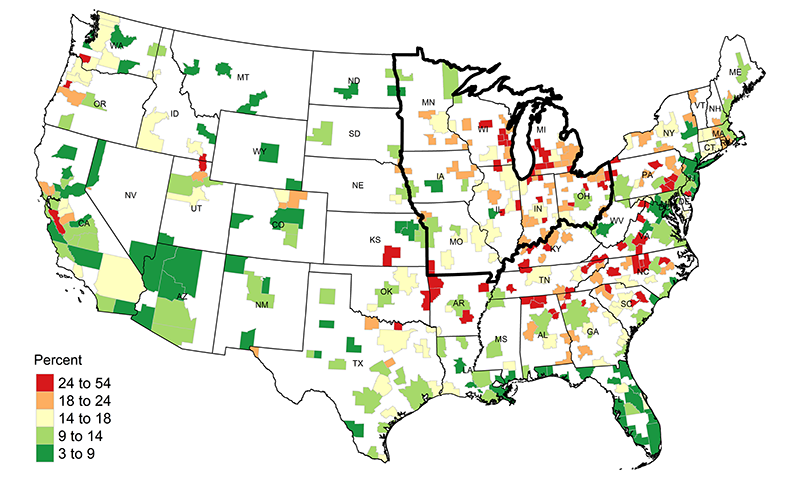
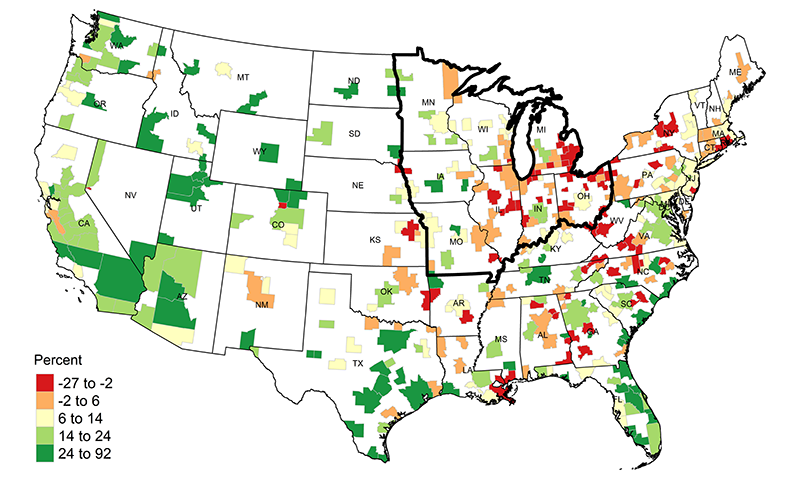
To explore how this story has played out over the past 20 years, we first examine the relationship between manufacturing concentration and employment growth at the state level. Panel A of figure 3 shows the share of employment in manufacturing across the 48 contiguous states (and the District of Columbia) as of 2000; states are shaded based on the manufacturing share quintile they fall into. It’s easy to see that manufacturing shares are highest in the Midwest and South. Every midwestern state except Missouri is in either the top or second-highest share quintile. Panel B of figure 2 shows a map of employment growth from 2000 through 2018 for the states. Here, every midwestern state except Minnesota is in the bottom or second-lowest quintile of growth.
The maps in figure 3 show a striking relationship between manufacturing’s share of employment and an area’s employment growth, but it is clear that manufacturing’s share is not the only factor related to job growth. The relationship we document is less clear-cut in the South than in the Midwest. For instance, North Carolina and South Carolina are both among the top ten states in terms of manufacturing’s share of employment, but they both experienced above-median employment growth over the past 20 years. That said, a number of other southern states with high manufacturing employment shares grew more slowly than other parts of the country.
3. Manufacturing share and employment growth, by state
A. Manufacturing share in 2000
B. Employment growth from 2000 through 2018
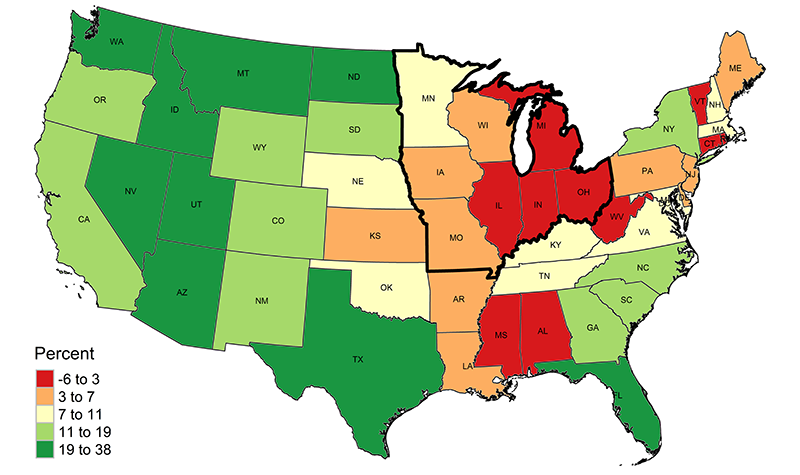
Source: Authors’ calculations based on data from the U.S. Bureau of Labor Statistics from Haver Analytics.
Download the data
The negative relationship between manufacturing’s share of employment and an area’s employment growth is also clear in figure 4, where we examine metro areas rather than states. Metro areas with large shares of employment in manufacturing are primarily in the Midwest and South, and many of them experienced slow or even negative employment growth over the past 20 years. Similar to what we saw among the states, there are some metro areas with large shares of employment in manufacturing that still experienced strong employment growth (e.g., Grand Rapids, MI, and Knoxville, TN). Yet, on the whole, the negative relationship is clear from figure 4.
4. Manufacturing share and employment growth, by metro area
A. Manufacturing share in 2000
B. Employment growth from 2000 through 2018
Source: Authors’ calculations based on data from the U.S. Bureau of Labor Statistics from Haver Analytics.
Download the data
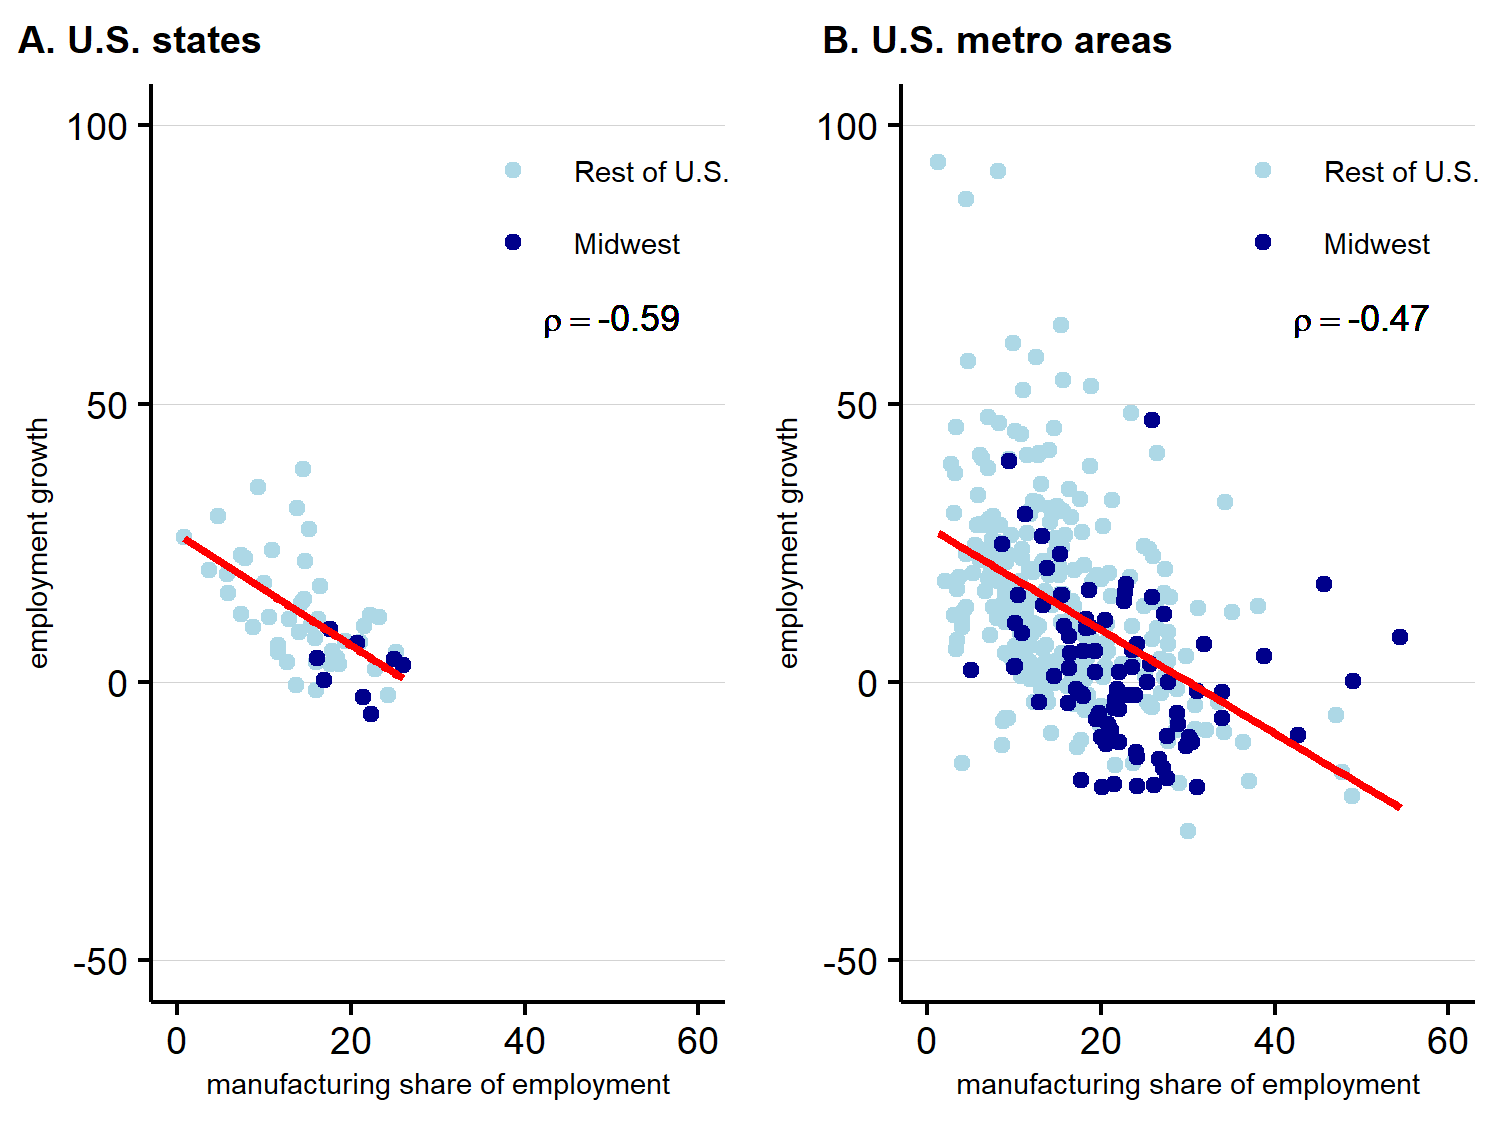
We summarize the maps in figures 3 and 4 in figure 5. Panel A of figure 5 shows the relationship between manufacturing’s share of employment and employment growth across states and panel B shows this correlation across metro areas. Midwestern states and metro areas are represented by the darker blue dots. The association is clearly negative, with a correlation coefficient (ρ) of −0.59 at the state level and −0.47 at the metro area level. On average, a 10 percentage point increase in manufacturing’s share of employment in 2000 is associated with a 10 percent decrease in 2000–18 employment growth at the state level and a 9.3 percent decrease in this measure at the metro area level.
5. Correlation between manufacturing share and employment growth
Source: Authors’ calculations based on data from the U.S. Bureau of Labor Statistics from Haver Analytics.
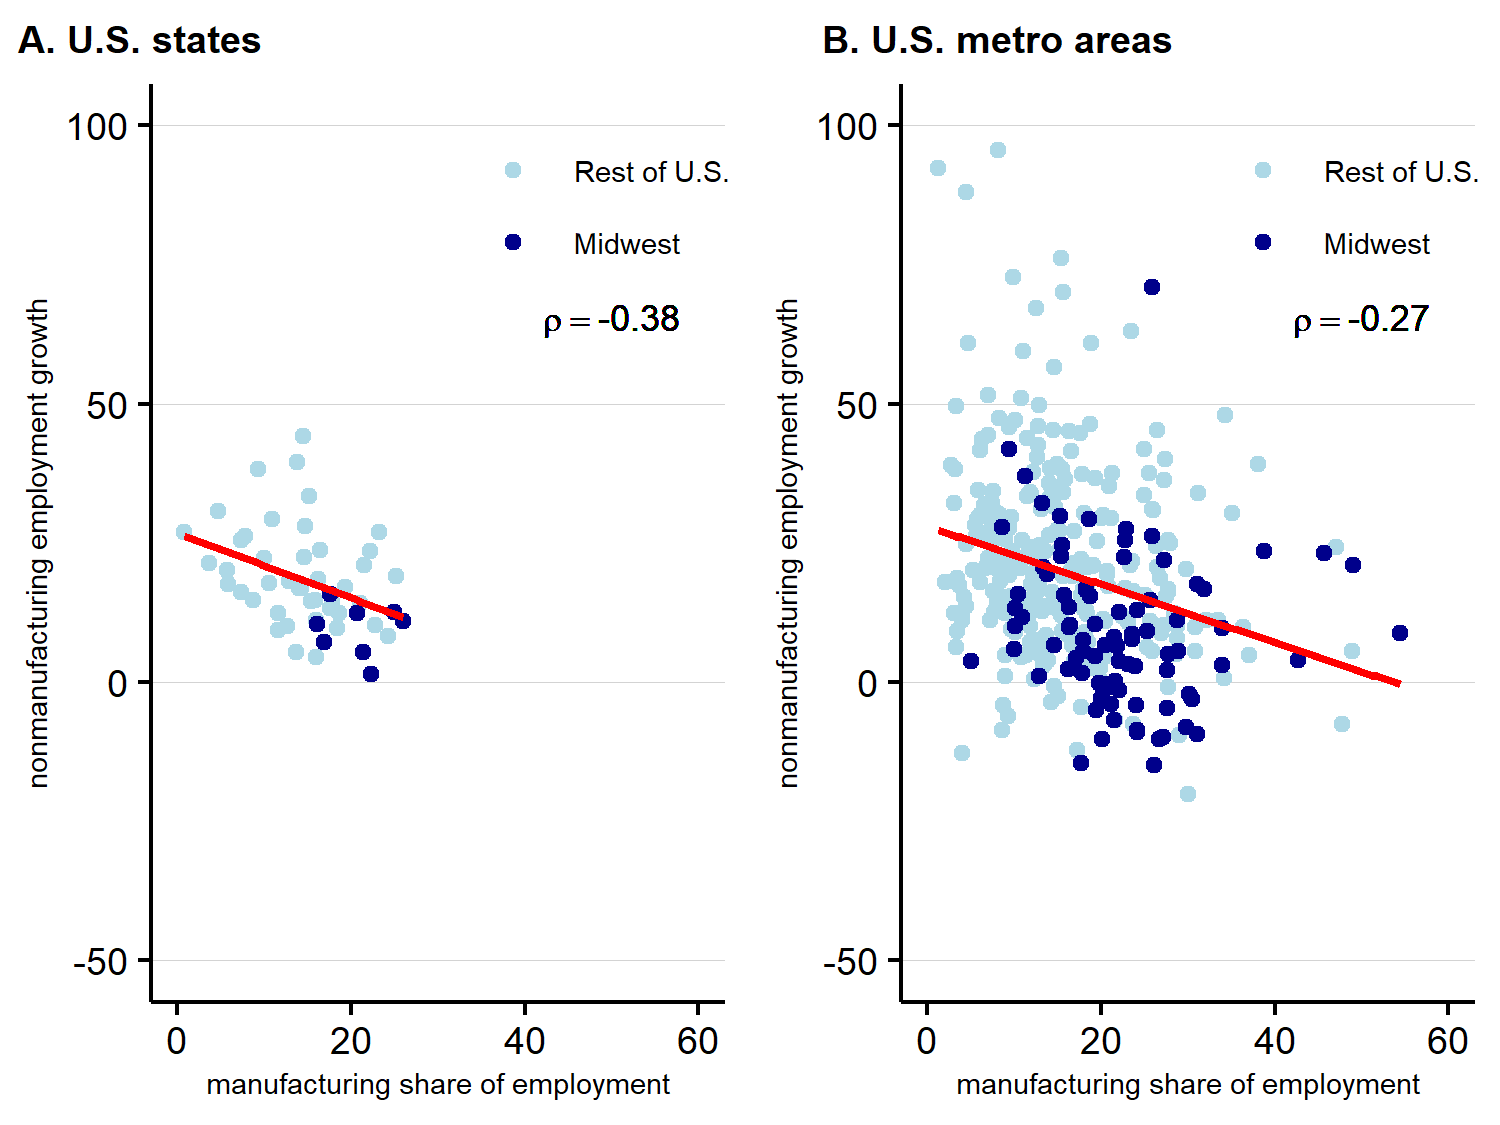
Part of the reason for the negative correlations we see in figure 5 is that manufacturing’s employment share in the U.S. declined over the period 2000–18. But the multiplier theory we outlined earlier predicts that falling manufacturing employment should have spillover effects on employment growth in other industries too. To explore this prediction, we show in figure 6 the correlation between manufacturing’s share of employment and nonmanufacturing employment growth. The association remains negative at both the state and metro area levels, though it is somewhat weaker.
6. Correlation between manufacturing share and nonmanufacturing employment growth
Source: Authors’ calculations based on data from the U.S. Bureau of Labor Statistics from Haver Analytics.
The negative relationship between manufacturing’s share of employment and employment growth that we document in this post presents a challenge for policymakers in manufacturing-intensive places, many of which happen to be in the Midwest: The likely economic scenario for these places is relatively slow job growth. In such an environment, formulating good policy is arguably more difficult and the stakes are higher. And while it is not out of the realm of possibility for U.S. manufacturing to experience a renaissance that would make the correlation positive rather than negative, if the past seven decades are any guide, it is not a development that policymakers should count on.
Notes
1 For this post, we consider Illinois, Indiana, Iowa, Michigan, Minnesota, Missouri, Ohio, and Wisconsin to be in the Midwest.


