What Makes a Place Rural?
On September 28–29, 2022, the Federal Reserve Bank of Chicago and the W.E. Upjohn Institute for Employment Research will cohost a conference called Creating Conversations on the Challenges and Opportunities Facing Rural Economic Development in Grand Rapids, Michigan. Ahead of this event, we provide a primer on how some governmental institutions define rural and related terminology to help establish a baseline for discussion. We also present maps of the Seventh Federal Reserve District that we plotted using these governmental classifications. Based on the official definitions, our maps, and firsthand and virtual visits to District towns, we find that what makes a place rural is not as straightforward as some might think.
When you drive from a city center to the countryside, how do you recognize when you’ve left urban and suburban areas and entered rural areas? Are you in the country when you pass by farms, orchards, or open fields? Not necessarily. You might find agricultural structures and broad green spaces in the suburbs—and even in large cities. So, this question really isn’t easy to answer.
The U.S. Census Bureau states that rural is “all population, housing, or territory not within an urban area.” So, going by this definition, we need to first define urban areas in order to find out what is rural. According to the Census Bureau’s 2010 urban–rural classification,1 urban areas are incorporated places with a population of at least 2,500 people; thus, areas with fewer than 2,500 people are considered rural. When you generate a map of the United States using this classification, you get one with urban islands surrounded by a sea of rural regions.
Another wrinkle to the Census Bureau’s definition of urban areas is that places with at least 2,500 people but fewer than 50,000 people get labeled as "urban clusters.” Moreover, places with 50,000 or more people get labeled by the Census Bureau as “urbanized areas.” So, there can be quite a bit of variation in the number of people across the locations considered urban.
Interestingly, nonmetro doesn’t mean the same thing as rural, at least if we go by official governmental definitions. But notably, many people, even some researchers and policymakers, conflate the two terms. According to the U.S. Office of Management and Budget, metropolitan status is conferred at the county level. Given that most counties are made up of both urban and rural portions, an urban area may be inside a nonmetro county, while a rural area may be inside a metro county. Actually, over half (54.4%) of rural residents lived in a metro area, as noted in a December 2016 Census Bureau blog post.
To illustrate how challenging it can be to pin down a single definition of rural (even a working definition for a conference), we compare two cities in Michigan: Greenville and Tecumseh (depicted as two red dots in figure 1). At face value, Greenville and Tecumseh appear to be quite alike. Both cities have very similar population sizes: According to 2010 Census data, 8,816 people lived in Greenville and 8,680 people lived in Tecumseh.2 Both are urban clusters by Census Bureau standards. Both border on major metropolitan areas: Greenville is about 30 miles from Grand Rapids, and Tecumseh is only 25 miles away from Ann Arbor. Greenville and Tecumseh have similar population densities, demographic profiles, and geographic landscapes. However, Greenville falls within a metro county, while Tecumseh falls within a nonmetro county. Even so, Greenville is surrounded by fields and forests (as evident in imagery from Google Maps) and seems to have maintained a rural character (based on images viewed online and reports from colleagues). What then truly distinguishes “metro” Greenville from “nonmetro” Tecumseh? It’s not clear.
1. Map of urban clusters in nonmetro counties of the Seventh District
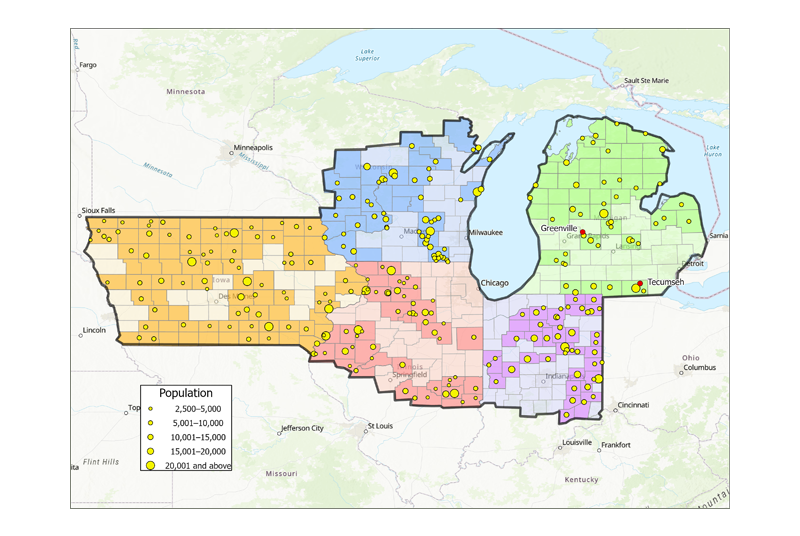
Sources: Authors’ analysis based on data from the U.S. Department of the Interior, U.S. Geological Survey; U.S. Department of Transportation, U.S. Bureau of Transportation Statistics; U.S. Census Bureau, 2010 U.S. Census; U.S. Department of Agriculture; and ArcGIS Online.
Across the United States, most nonmetro counties include urban clusters. In fact, only 704 counties (out of 3,143 total) were classified as entirely rural based on 2010 Census data. While completely rural counties had 5.4 million people, the 1,185 mostly rural counties had 36.8 million people living in them. Another 266.6 million people lived in the 1,254 mostly urban counties (only 29 counties of this last grouping had no rural residents).
The rural population of Seventh Federal Reserve District states in 2010 was 8.6 million (22.6%), while their urban population was 29.4 million (77.4%). (Note that a portion of each of these states, with the exception of Iowa, lies outside the Seventh District.) So, the District states’ total population was somewhat more rural than that of the nation, as shown in figure 2. See figure 2 for the urban–rural breakdown for each District state as well.
2. Seventh District states, by shares of urban and rural populations
| Urban (%) | Rural (%) | ||
| Illinois | 88.5 | 11.5 | |
| Indiana | 72.4 | 27.6 | |
| Iowa | 64.0 | 36.0 | |
| Michigan | 74.6 | 25.4 | |
| Wisconsin | 70.2 | 29.8 | |
| Seventh District states | 77.4 | 22.6 | |
| United States | 80.7 | 19.3 |
Source: Authors’ calculations based on data from the U.S. Census Bureau, 2010 U.S. Census.
Figure 1 is a map of the Federal Reserve’s Seventh District that highlights the nonmetro counties and the urban clusters within those counties. As shown in that map, Seventh District nonmetro counties had 275 urban clusters peppered across them. These urban clusters ranged in population size from the 36,812 people in Richmond, Indiana, to the 2,500 people in Amboy, Illinois. Even though these towns are technically urban (according to the Census Bureau standard), their being in nonmetro counties leads one to consider them as rural.
Figure 3 is a map of nonmetro counties in the Seventh District by their predominant industry. In some states, rural counties tend to be organized around a single key industry. In Iowa, many rural counties’ economies are centered on agriculture. In Michigan, much of the economic activity in the state’s northern rural counties revolves around tourism and recreation. Similarly, in Indiana, most of the rural counties that lie in the center of the state have economies based on manufacturing. However, in Wisconsin and Illinois, the predominant economic industry varies greatly from county to county throughout the rural regions. These differences between and within states highlight the nonmonolithic nature of rural areas throughout the Seventh District.
3. Map of nonmetro counties of the Seventh District, by key economic industry
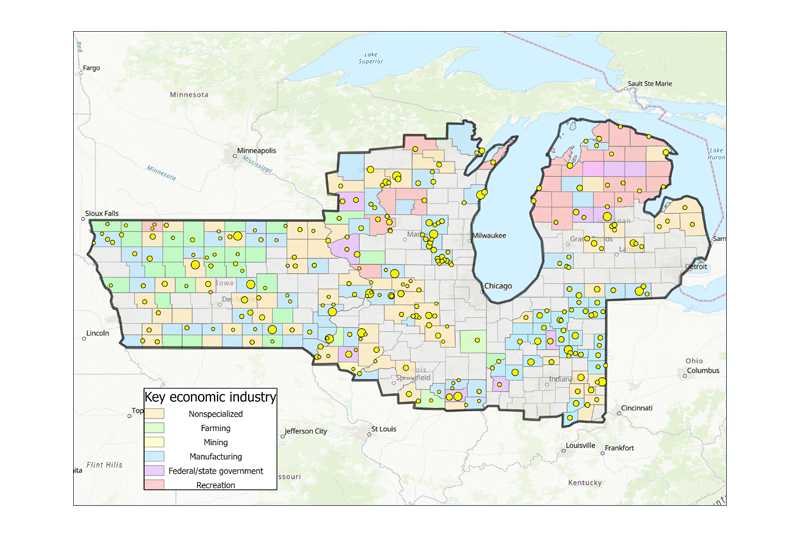
Sources: Authors’ analysis based on data from the U.S. Department of the Interior, U.S. Geological Survey; U.S. Department of Transportation, U.S. Bureau of Transportation Statistics; U.S. Census Bureau, 2010 U.S. Census; U.S. Department of Agriculture; and ArcGIS Online.
While industrial clustering occurs in some rural areas within specific states, there is not one single industry that dominates all or even most rural regions across the District. Therefore, there is no single set of economic issues and trends that uniformly affect rural communities. Rather, these communities have a diverse set of economic interests, and will be differently impacted by broader economic patterns. Although many rural communities are bound by some common trends (including declining total populations and fewer young people), they also experience unique economic shocks and issues specific to their predominant industries. These differences are often more prominent during severe economic downturns, such as the Covid-19 pandemic recession in 2020 (and its aftermath).
So, what about Greenville? As we mentioned before, unlike its Michigan “twin” Tecumseh, Greenville is in a metro county—which happens to be adjacent to the Grand Rapids region, where we’ll hold our conference on rural economic development. Still, there is enough separation created by the surrounding countryside to make Greenville feel more rural than urban. Come participate in Creating Conversations on the Challenges and Opportunities Facing Rural Economic Development and make up your own mind about Greenville. The program offers participants an optional field trip to this city. By attending the event, you’ll also learn about how definitions of rural places matter for economic development policies and, hence, to communities across the Midwest region.
Notes
1 The Census Bureau is planning to announce final urban areas based on the 2020 Census in December 2022.
2 We use 2010 Census data for figure 1, so we present the 2010 populations of Greenville and Tecumseh in our discussion. But according to 2020 Census data, 9,091 people lived in Greenville and 8,673 people lived in Tecumseh, so both cities continued to be comparable in population size a decade later.


