The Contrasting Fortunes of Crop and Livestock Producers—A conference takeaway
On November 17, 2014, the Federal Reserve Bank of Chicago held a conference which examined the role of farm income in the Midwest economy. (Check the event page to see the agenda and download presentations.) The conference explored both the decline in agriculture’s role over the longer term and the marked increase in the level of agricultural income over the past decade. Within this context, an interesting aspect of the composition of farm income has been the battle between crop and livestock producers for the larger share of the value of agricultural production.
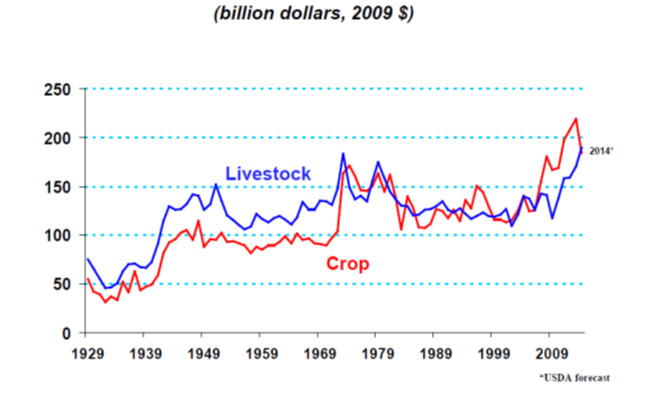
Over the past decade, there has been a shift in the relative balance between the crop and livestock sectors of agriculture. In only two years from 2002-13 did the production value of the livestock sector exceed that of the crop sector (see chart below). Yet, during the previous era, the sectors regularly traded places—every several years, if not annually— as the biggest source of production value for U.S. agriculture. Even earlier, until 1974, livestock producers held sway for decades as the top contributors to farm output.
1. U.S. Farm production values
What disrupted the long term hegemony of the livestock sector? In the periods of crop ascendency from 1974-77 and from 2007-13, there were sharp drops in the per capita consumption of meat and poultry in the U.S., as shown in a chart from Chris Hurt’s presentation (available from the conference website). The starts of these periods coincided with relatively deep recessions in the overall economy, which resulted in shifting food consumption patterns as household budgets shrank. In particular, the restaurant industry tends to suffer during recessions, pulling down meat consumption as well. Moreover, changing perceptions about the health of animal products has impacted meat consumption, particularly in recent decades.
Hurt, from Purdue University, went on to illustrate the see-saw effects of high feed costs on the livestock sector. Since feed is the largest cost of animal agriculture, sharply higher feed costs contributed to a decrease in the meat supply, as producers exit or trim their herds to minimize costs. With lower availability of animal products, the prices for these products move up over time to bring markets back toward equilibrium. This process was triggered around 2007 by the rising demand of corn for ethanol production and higher exports, particularly of soybeans to China. Of course, higher prices for corn and soybeans also pushed up the production value of crops, even as the production value of the livestock sector was dipping.
The most recent period of crop supremacy was also extended by drought. Persistent drought in certain regions of the country battered the livestock sector, especially cattle operations. With longer gestation times, cattle take longer to rebuild herds than for other animal breeds. The livestock sector was forced to cut output, not only from the lack of water but also from the subsequent spikes in feed costs (made worse by the drought of 2012 that impacted key corn and soybean production states in the Midwest). Soaring crop prices boosted their production value, even as crop output was cut due to drought. The crop sector was riding high from 2007 to 2013, but the bumper crops of 2013 and 2014 ended the ride.
In order to estimate farm incomes, the revenues from crop and livestock operations get combined to provide the value of agricultural production. Net farm income is a standard way to measure the size of returns from agricultural operations. Basically, net farm income equals the value of agricultural production and net government transactions minus purchased inputs, capital consumption, and payments to stakeholders. 1 The latest U.S. Department of Agriculture forecast of net farm income for 2013 was $126.5 billion for the nation, but net farm income was projected to fall to $96.9 billion for 2014. 2 This decline stemmed primarily from a drop in crop revenue of $33 billion, as crop price decreases more than offset increased yields from the fall harvest. However, revenue from animal production was expected to rise by $24 billion from 2013 to set a new record in 2014, as prices for many animal products moved higher. This would result in yet the latest reversal in the continuing saga of the fortunes of the livestock and crop sectors of U.S. agriculture.
Given the opposite movements of production value for the crop and livestock sectors, this decline in net farm income will have disparate effects across the Seventh District. The importance of livestock production varies a lot across the geography of the District. From Hurt’s calculations, the 2012 portion of farm production value from animals was 16% for Illinois, 31% for Indiana, 37% for Michigan, 44% for Iowa, and 65% for Wisconsin. With these very different intensities of animal agriculture, the downturn in income from crop farming will be offset to a greater extent in areas that see a boost from an increase in livestock income.
For additional highlights from the Chicago Fed conference on farm income and its impact on the Midwest economy, see the conference summary.


