As part of the Chicago Fed’s Spotlight on Childcare and the Labor Market, a targeted effort to understand how access to childcare can affect employment and the economy, we use data from a national survey conducted by the U.S. Census Bureau—the Survey of Income and Program Participation (SIPP)—to examine the childcare arrangements for young children (those under five years old) while their mothers were at work, in school, or otherwise not available and how much families paid for these arrangements in the recent past. We focus on the arrangements used and amounts paid by families with low incomes, particularly those living in poverty, and compare those with the arrangements used and amounts paid by families with higher incomes. To see how the Covid-19 pandemic affected these arrangements and payments, we look at how they changed between the fall of 2019, before the pandemic, and the fall of 2021, after the authorization of vaccines in the United States for adults and older children.
We find the following key facts during this tumultuous period:
- Families living in poverty were substantially less likely to use childcare facilities than families with the highest incomes. This gap in the use of childcare facilities between families in poverty and those with the highest incomes widened during the pandemic.
- One reason for this gap in the use of childcare facilities is that, in general, facilities are a paid childcare arrangement and for all but families with the highest incomes, more than half of families with young children do not use paid arrangements. However, the gap in the use of childcare facilities between families in poverty and those with the highest incomes remained large even among families that did pay for care.
- The share of young children who were taken care of by their mothers while the mother was working or in school was generally higher in 2021 than it was in 2019. This increase was largest for children in families with the highest incomes, among those that typically paid for childcare.
- Childcare became less affordable during the pandemic. Between the fall of 2019 and the fall of 2021, the median percentage of before-tax income paid for childcare increased or stayed the same for all income groups except the highest-income group, for which it decreased some.
The SIPP and childcare arrangements and payments
The SIPP is a nationally representative household-based survey that collects information on many topics, including income, employment, and childcare. We focus our analysis on households in the SIPP with any children under five years old. The 2020 and 2022 SIPP panels used in this article ask questions covering childcare during the typical week of the fall of the preceding years, namely, 2019 and 2021, respectively. For each of these two reference years, about 92% of the respondents in our analysis were between 25 and 54 years old. Just under 70% of female SIPP respondents with young children were in the labor force, compared with more than 75% of female SIPP respondents overall.
We use these data to learn about childcare arrangements and payments. The respondent with at least one child under five years old answered for each young child in the household and for each listed childcare arrangement type whether the child was cared for under that arrangement during a typical week in the fall of 2019 or 2021, as applicable, while the reference parent was at work, in school, or otherwise unavailable. For each of those years, more than 95% of the reference parents were female, i.e., the mother. The respondent could answer yes for multiple arrangements. We use this information to identify the share of young children in each (not mutually exclusive) childcare arrangement during the typical week of the fall of each reference year.
Because the SIPP asks about many specific types of childcare arrangements, we combine similar arrangements into six broader categories.
We start with childcare provided by family and split it into three groups:
- Self (child is cared for by the SIPP reference parent, typically the mother, while she is working or going to school)
- Grandparents (child is cared for by a grandparent)
- Relatives (child is cared for by the other parent, stepparents, siblings over the age of 15, or other relatives)
Next, we split childcare provided by those outside of the family into three groups:
- Facilities (child is cared for in a day care center, nursery/preschool, or after-school program)
- Homes (child is cared for at a home-based family day care provider or by a nonrelative in a home)
- Head Start (child is cared for in a facility or home that serves as a location for a Head Start program, which provides services at no cost to children aged zero to five years old in eligible families)1
For the self category, the SIPP asks the respondent for each child in the household if the child was cared for by the reference parent during a typical week in the fall of the reference year (2019 or 2021, as applicable) while that individual worked or went to school. We interpret a “yes” to this question as the respondent (self), usually the mother, providing childcare in a typical week while she was working at home (or less likely, in a workplace) or while physically present at school or participating in remote (online) courses.
Again, the respondent could answer yes for multiple arrangements. About two-thirds of young children were in more than one of these six childcare arrangements during a typical week in the fall of the reference year (2019 or 2021, as applicable). Common combinations were as follows: facilities and relatives (or grandparents); facilities and homes; and relatives (or grandparents) and self.2
To understand payments for childcare, we use respondents’ answers to whether they or their family paid for childcare during a typical week in the fall of the reference year (2019 or 2021, as applicable) and, if yes, the total amount paid during that typical week for any child under the age of 15. Because most children were in multiple childcare arrangements and respondents were only asked about the total amount paid for all children under the age of 15, we cannot know the amount paid for each separate arrangement type or the amount paid for any individual child. For each family with children under age five that reported paying for any childcare arrangement, we divide the amount paid by the number of children under age five and report the total amount paid per child.3
The SIPP and sample characteristics by family income
The SIPP also asks questions about family income, which allows us to compare childcare arrangements and payments across families with different income levels. We can get a sense of the relative affordability of childcare by computing the amount paid for childcare as a percentage of family income.
We use the SIPP ratio of annual family income to poverty to assign families into four income groups. The first group is families with incomes below the poverty line. For households at or above the poverty line we divide families into three groups: family income at 100%–199% of the poverty line, 200%–299% of the poverty line, and 300% or more of the poverty line. In addition to labor income, the annual income includes any payments received via means-based transfer programs or social insurance. This income is before-tax income and does not include the amount of any federal income tax credits, such as the earned income tax credit, and does not include the value of any noncash benefits, such as food stamps or subsidized housing.4
Figure 1 shows that for 2021, the percentage of the SIPP sample in each annual-income-to-poverty ratio group and the median family income associated with each group. In 2021, 19% of the sample was below the poverty line; their median income was just above $20,000. One-fifth (20%) of the sample had incomes at 100%–199% of the poverty line; this group’s median income was around $50,000. In addition, 15% of the sample had incomes at 200%–299% of the poverty line; their median income was just above $80,000. Finally, around 47% had incomes at 300% or more of the poverty line; this group’s median income was about $165,000.
1. Demographic details for income groups, 2021
| Annual-income-to-poverty ratio | Share of sample | Share of unmarried (single) | Share of married | Share of Black | Share of Hispanic | Share of White | Median family income |
|---|---|---|---|---|---|---|---|
| Below poverty line | 19.0 | 39.0 | 8.0 | 35.0 | 25.0 | 12.0 | $20,736 |
| 100%–199% of poverty line | 20.0 | 28.0 | 15.0 | 28.0 | 27.0 | 14.0 | $50,689 |
| 200%–299% of poverty line | 15.0 | 16.0 | 15.0 | 14.0 | 19.0 | 15.0 | $81,176 |
| 300%+ of poverty line | 47.0 | 17.0 | 61.0 | 23.0 | 28.0 | 59.0 | $166,439 |
Source: Authors’ calculations based on data from the U.S. Census Bureau, 2022 Survey of Income and Program Participation (SIPP), public-use files.
Figure 1 also shows for 2021 the percentage of respondents listed in the SIPP as unmarried (single), married, Black, Hispanic, or White that fall into each annual-income-to-poverty ratio category. For example, 39% of single respondents were in families below in the poverty line in 2021, while only 8% of married respondents lived below the poverty line that year. It also shows that 35% of Black respondents, 25% of Hispanic respondents, and 12% of White respondents lived below the poverty line in 2021.
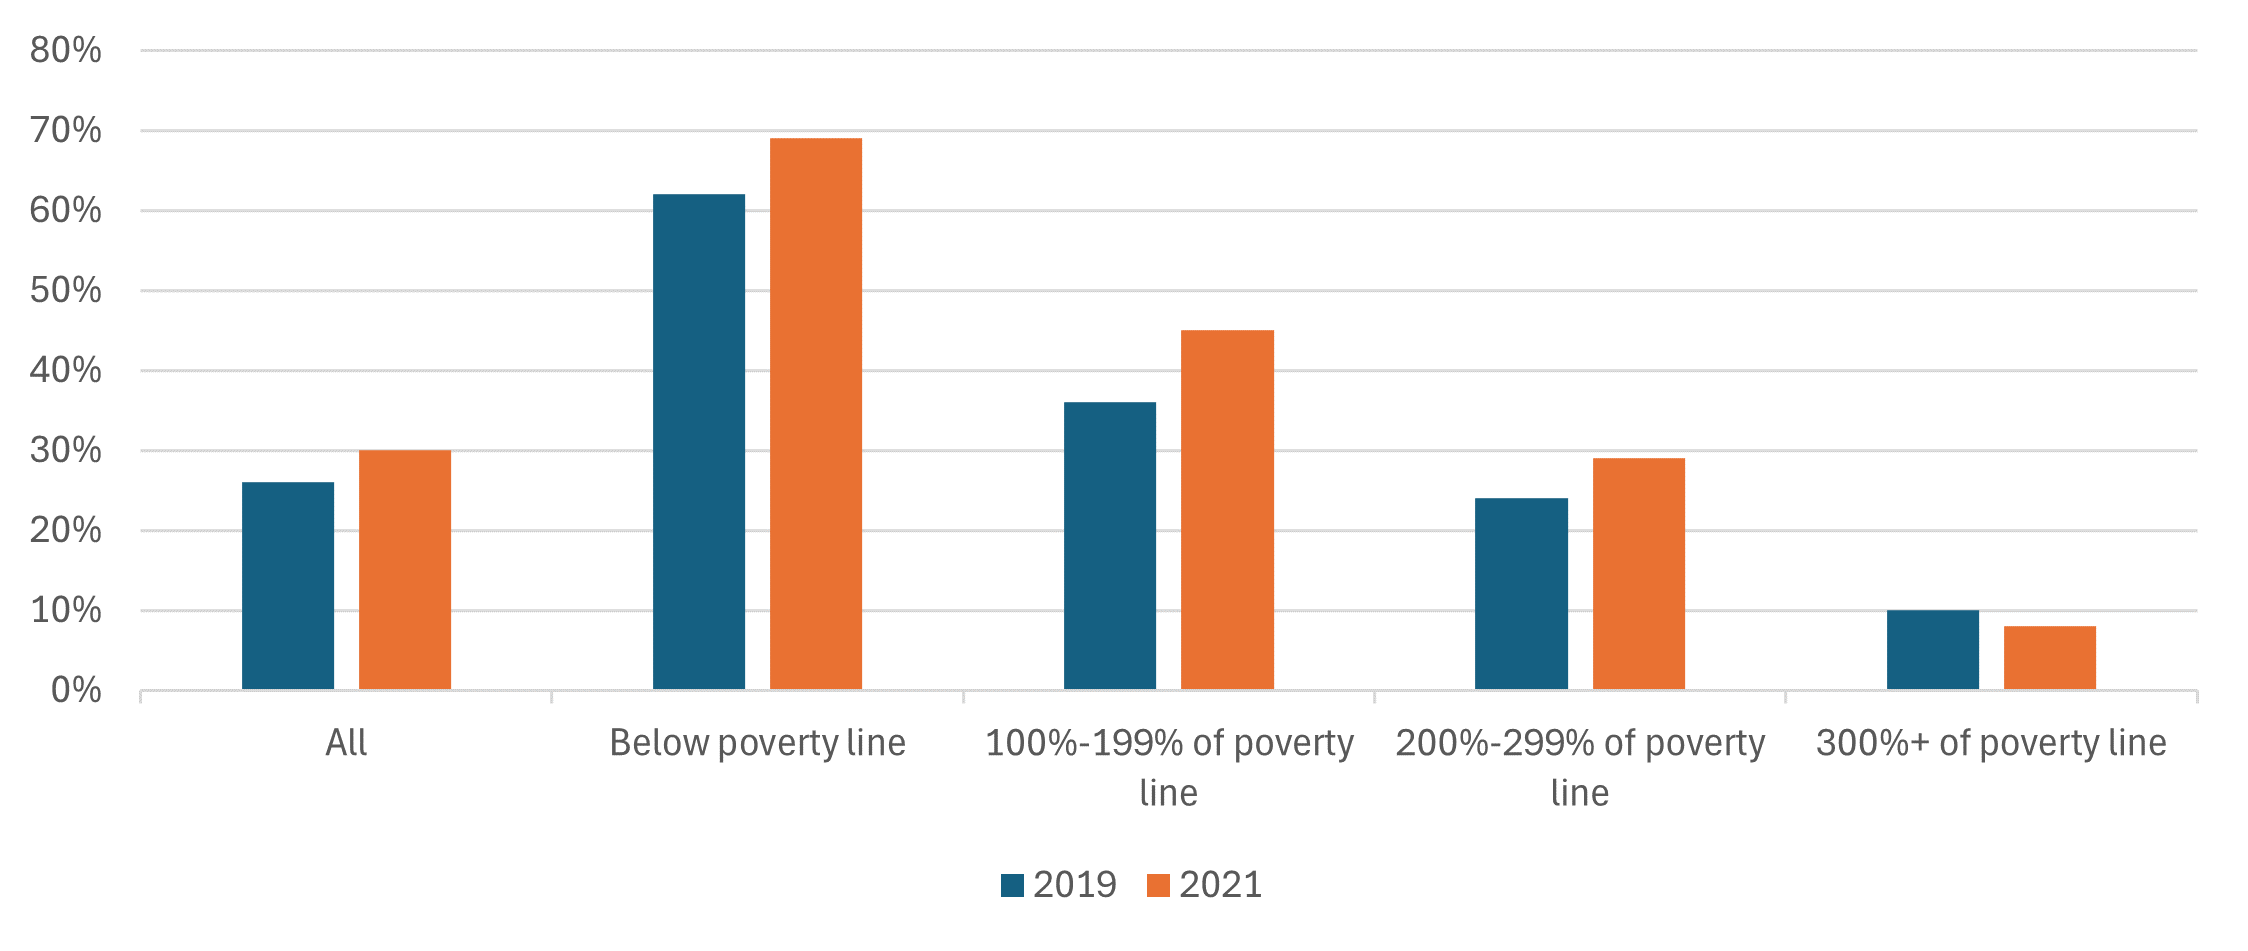
Single mothers with young children were overrepresented among those living in poverty in 2019 and 2021. Figure 2 shows that in 2019 single mothers with young children made up about 26% of all families (irrespective of income level), yet represented over 62% of families in poverty. Both percentages were higher in 2021. In contrast, single mothers with young children represented 10% of families with incomes at least 300% of the poverty line in 2019, and they represented 8% of families with such income in 2021.
2. Single mothers with young children as a percentage of families, by income group
Source: Authors’ calculations based on data from the U.S. Census Bureau, 2020 and 2022 Surveys of Income and Program Participation (SIPP), public-use files.
The gap in the use of childcare facilities between lowest- and highest-income groups
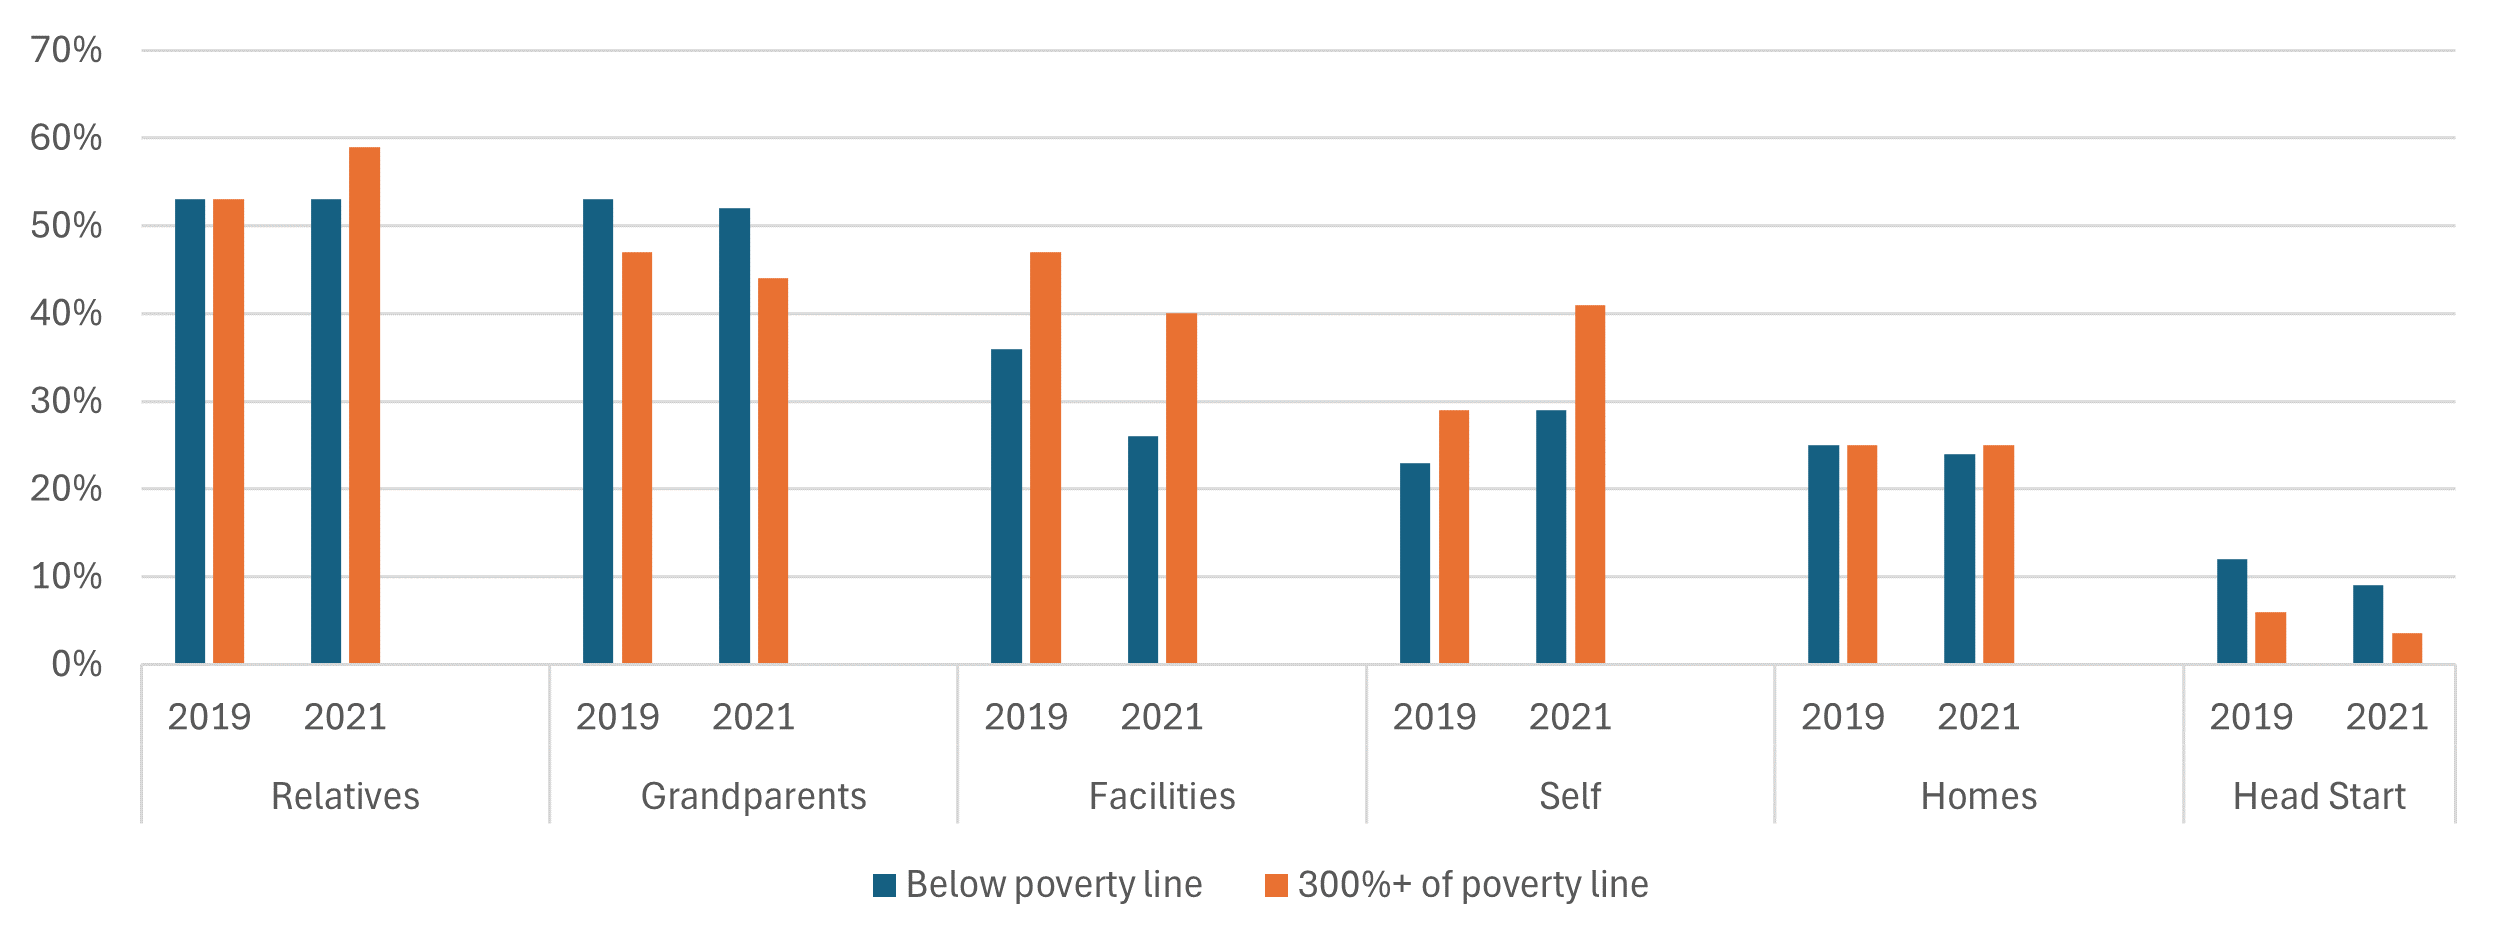
Figure 3 shows for the lowest- and highest-income groups (i.e., those below the poverty line and those with incomes at 300% or more of the poverty line), the share of children who are in each of the six childcare arrangements. These percentages will not add up to 100% because children can be in multiple childcare arrangements during a typical week (as we mentioned before). Hartley and McGranahan (2024) found similar patterns in childcare arrangements with a different survey that asked about such arrangements used between September 2022 and May 2023.
3. Percentage of children in different childcare arrangements, by income group
Source: Authors’ calculations based on data from the U.S. Census Bureau, 2020 and 2022 Surveys of Income and Program Participation (SIPP), public-use files.
The gap in the use of childcare facilities between the lowest- and highest-income groups was large. In the fall of 2019, 36% of children living in poverty were cared for in childcare facilities, compared with 47% of children in families with the highest income. This gap widened during the pandemic from 11 percentage points to 14 percentage points, even as the use of childcare facilities declined broadly. In the fall of 2021, 26% of children living in poverty were cared for in facilities—down 10 percentage points from 2019; meanwhile, 40% of children in the highest-income families were cared for in facilities in 2021—down 7 percentage points from 2019.5
Figure 3 also shows that use of relatives and grandparents for childcare provision remained relatively stable between 2019 and 2021 for the lowest-income group. However, over this two-year period, the use of relatives increased for the highest-income group—from 53% to 59%—while use of grandparents decreased from 47% to 44%. Similarly, childcare by the mother herself while working or in school increased from 23% in 2019 to 29% in 2021 for those living in poverty and increased even more—from 29% in 2019 to 41% in 2021—for those in the highest-income group.
Mothers living in poverty relied on unpaid childcare
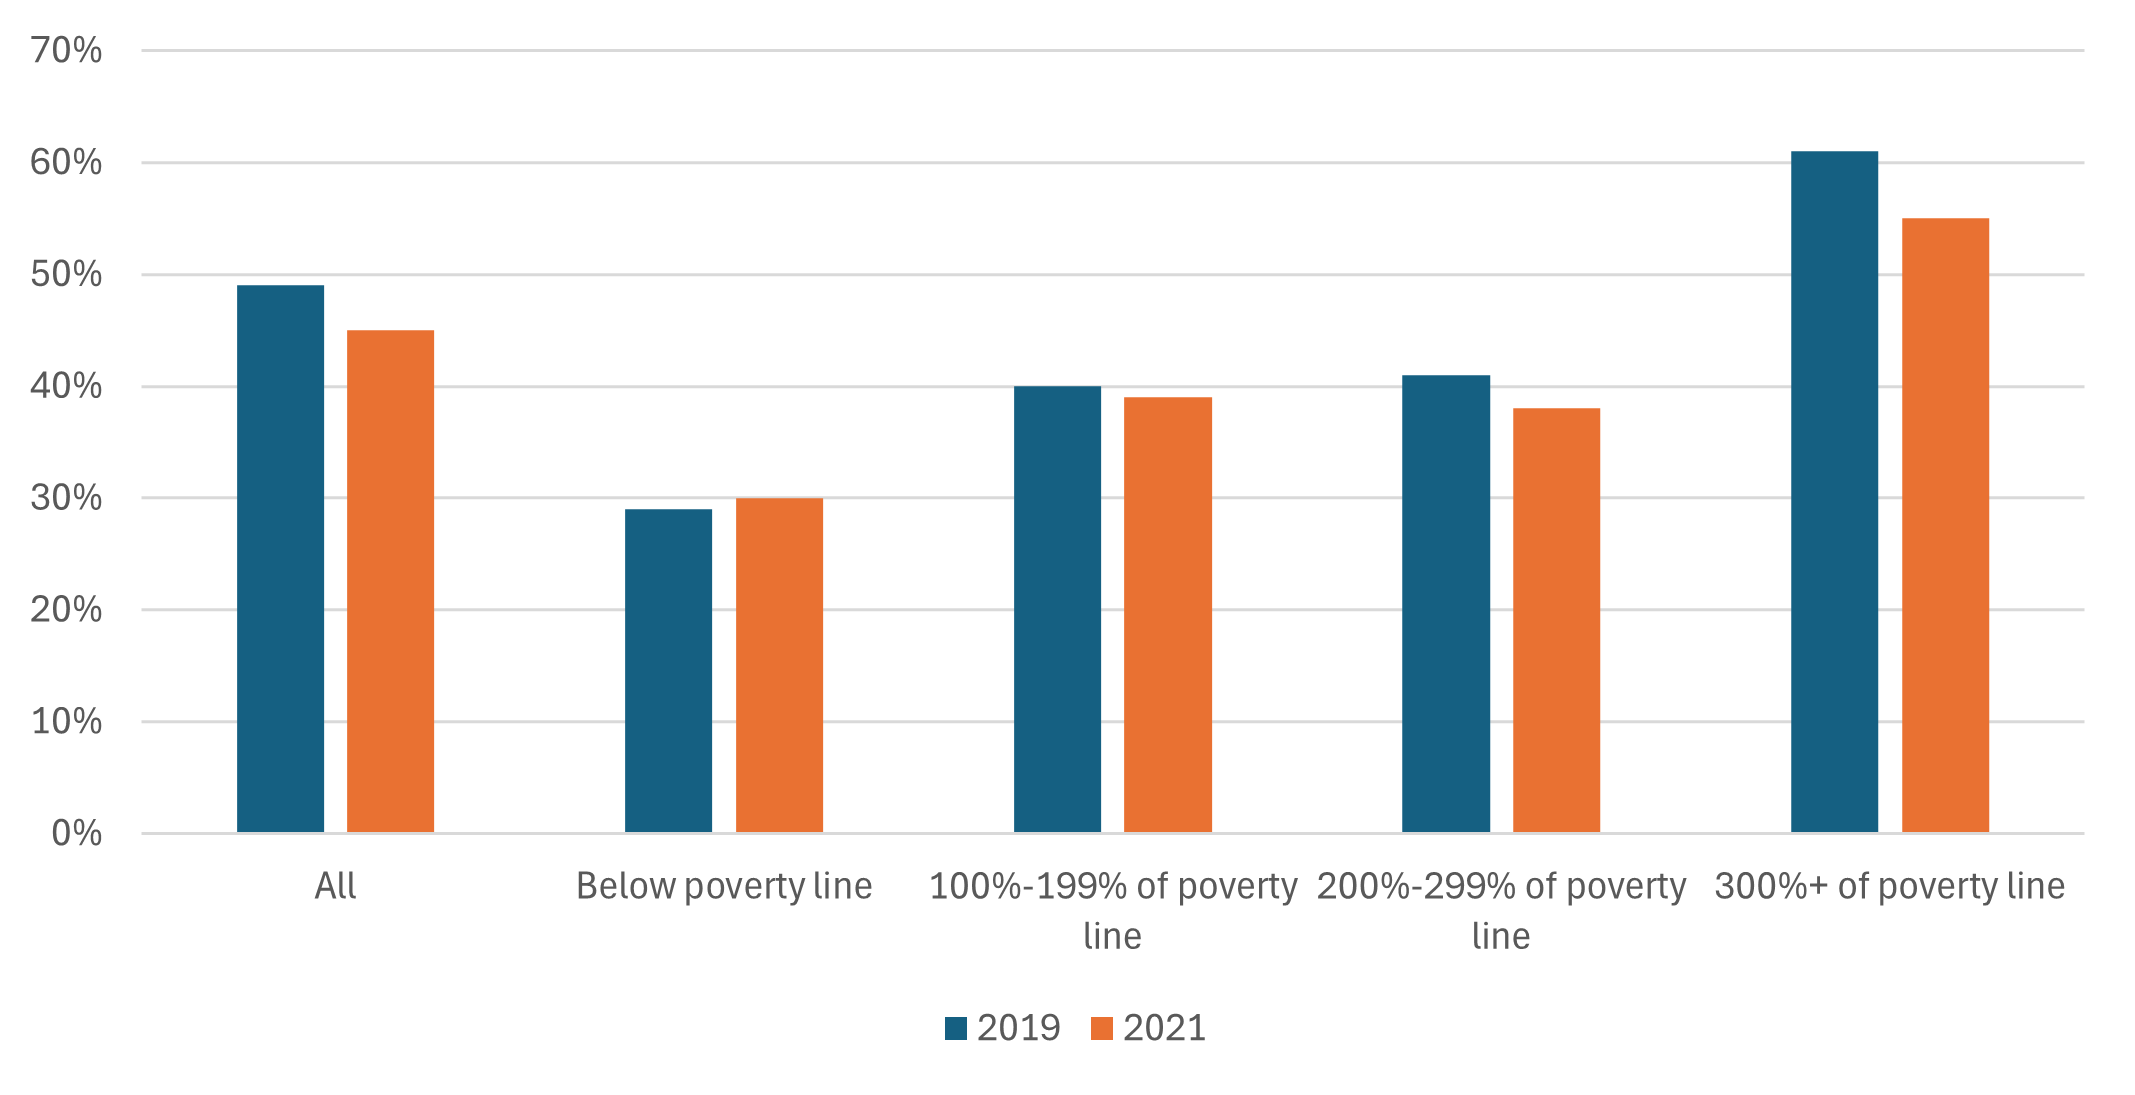
One reason for the gap in facilities use among families in different income groups is that many of them may not typically use paid childcare arrangements. In figure 4 we show that in every income group but the highest, fewer than half of families reported paying any amount for childcare in a typical week in the fall of 2019 and fall of 2021. Before the pandemic about 30% of families living in poverty used at least one paid childcare arrangement, compared with about 60% of families with incomes at least 300% of the poverty line. About 40% of families with incomes at 100%–199% and 200%–299% of the poverty line used a paid childcare arrangement before the pandemic. The gap in who uses at least one paid childcare arrangement between those with the highest incomes and others narrowed during the pandemic; i.e., the share of the highest-income families using paid care fell from 61% in 2019 to 55% in 2021, while the shares of the other families with lower incomes using paid care remained fairly similar between 2019 and 2021.6
4. Percentage of families that used at least one paid childcare arrangement, by income group
Source: Authors’ calculations based on data from the U.S. Census Bureau, 2020 and 2022 Surveys of Income and Program Participation (SIPP), public-use files.
Childcare arrangements differed by whether families paid for care
We now look separately at childcare arrangements for families that did and did not pay for childcare in a typical week. One difference between these groups of families is that families that did not pay for care had a lower labor force participation rate than families that did pay for care. Specifically, in 2021, respondents who paid for childcare during a typical week had an 81% labor force participation rate, compared with a rate of 71% for those who did not pay for childcare in a typical week.7 In this article, we do not analyze whether these differences in labor force participation rates affected if a family paid for care or whether differences in the availability of affordable paid care (or unpaid care from immediate family members) affected labor force participation. We focus on summarizing the arrangements used by families according to whether they did or did not pay for childcare.
We show that families that reported they did not pay for childcare in a typical week primarily relied on immediate family and had limited use of childcare facilities (including Head Start facilities). In contrast, families that reported they did pay for childcare in a typical week made extensive use of both immediate family and childcare facilities. We also discuss how the gap in the use of childcare facilities between different income groups widened during the pandemic.
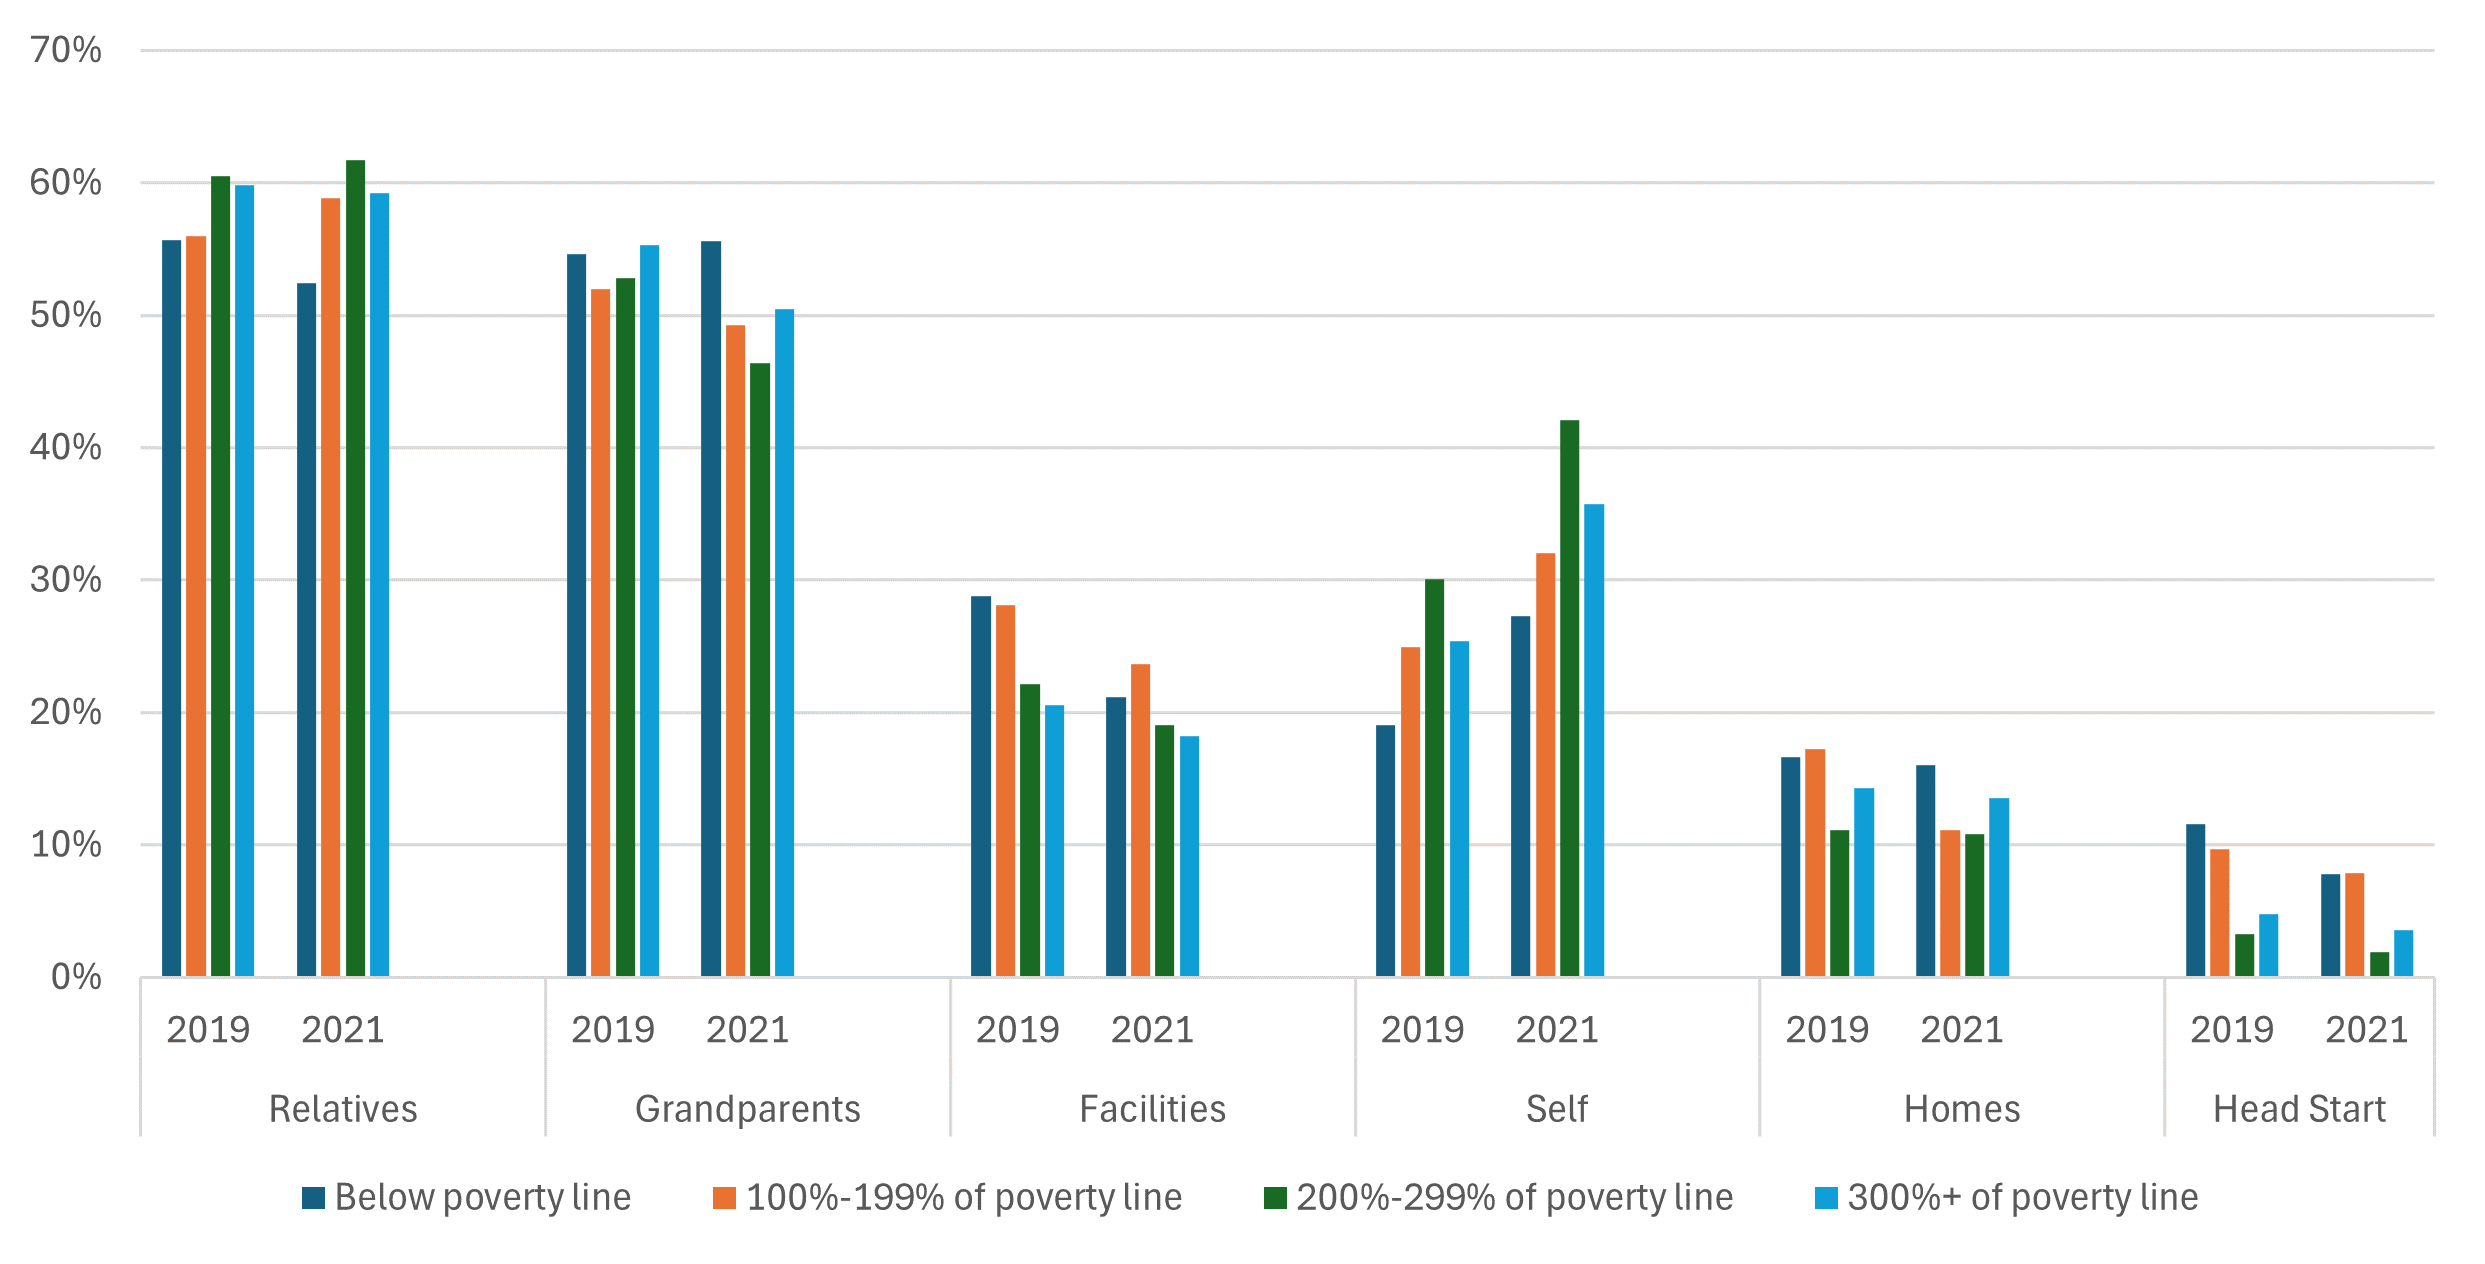
Figure 5 shows the distribution of children across childcare arrangements for families that did not typically pay for childcare by the annual-income-to-poverty ratio. There are some differences across income groups. For example, in 2021, almost 60% of children of families in the highest-income group were in the care of relatives (which include the other parent), compared with just above 50% of children of families living in poverty.
5. Distribution of children in childcare arrangements among families that did not pay for childcare, by income group
Source: Authors’ calculations based on data from the U.S. Census Bureau, 2020 and 2022 Surveys of Income and Program Participation (SIPP), public-use files.
Consistent across all income levels, before the pandemic (in the fall of 2019), around 55% of children whose families did not typically pay for childcare received care from grandparents. Families in poverty relied somewhat more on grandparents for childcare than families in other income groups did in the fall of 2021, more than a year after the pandemic hit the U.S. The percentage of children in the care of grandparents decreased generally between 2019 and 2021, except for the children living in poverty, whose percentage in such care increased slightly.
Among families that did not typically pay for childcare, the share of children cared for by their mothers (self) while they were working or in school tended to increase with family income between 2019 and 2021. A little over one-quarter (27%) of children living in poverty received care from their mothers in 2021, compared with 19% in 2019. More than 35% of children in the highest-income families were cared for by their mothers while they were working or in school in 2021, compared with 25% in 2019.
Among those that did not typically pay for childcare, the gap in the use of facilities between families living in poverty and those with the highest incomes fell between 2019 and 2021, going from 8 percentage points (29% versus 21%) to 3 percentage points (21% versus 18%).8
The percentage of children living in poverty cared for in a Head Start program decreased to 8% in 2021 from 12% in 2019.
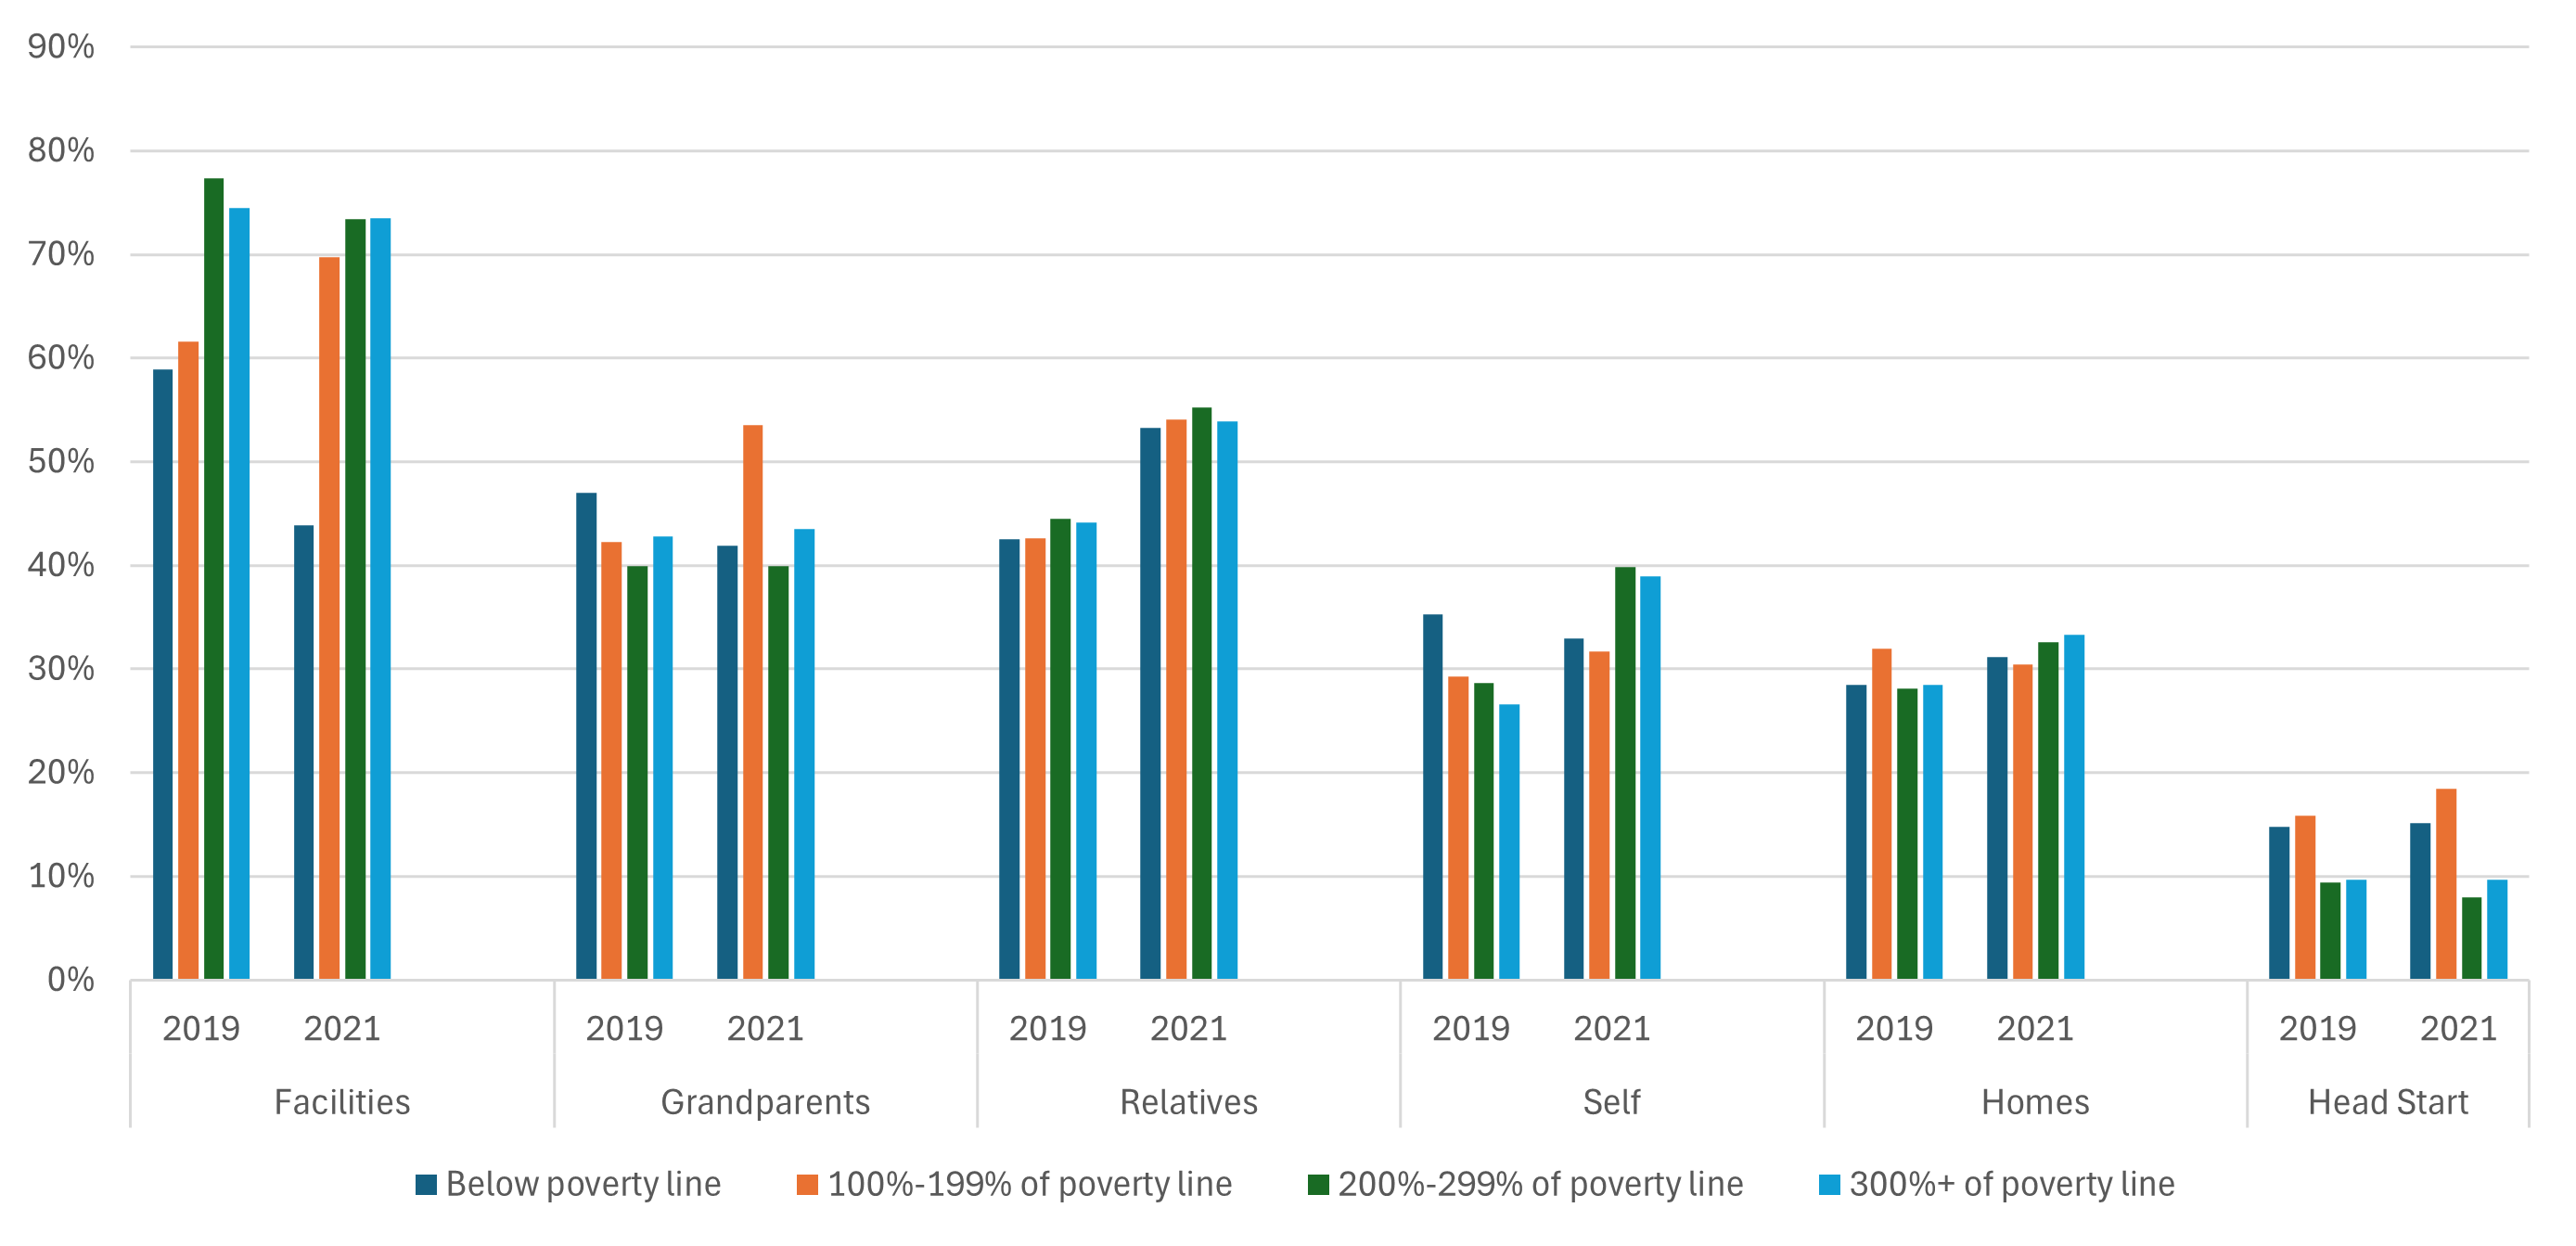
Figure 6 looks at the distribution of children in different childcare arrangements for those who reported that they paid for care during a typical week of the fall of the reference year. In 2019, around 75% of children in the highest-income group received childcare in facilities, and about 60% of children in the two lowest-income groups did. Among families that paid for childcare, the gap in the use of childcare facilities between income groups widened during the pandemic, as the percentage of children of families in poverty in facilities dropped to about 45% while the percentage of children of the highest-income families in facilities remained steady at around 75%.
6. Distribution of children in childcare arrangements among families that did pay for childcare, by income group
Source: Authors’ calculations based on data from the U.S. Census Bureau, 2020 and 2022 Surveys of Income and Program Participation (SIPP), public-use files.
Childcare from family members (relatives and grandparents) also changed during the pandemic, but the shares of these types of arrangements were generally consistent across income groups in each of the two reference years. The share of children cared for by relatives increased to around 55% in 2021 from around 45% in 2019 for all paying families, irrespective of income groups. In addition, the share of children cared for by grandparents ranged between 40% and 47% for all paying families across income groups in both 2019 and 2021 except for those with incomes at 100%–199% of the poverty line (their share of children cared for by grandparents moved up to 54% in 2021 from 42% in 2019).
Among families who paid for childcare, the share of children in the care of their mothers (self) while they were working from home or in school increased the most for the highest-income families: This share rose to almost 40% in 2021 from about 25% in 2019 for families with the highest incomes, while it remained at about 35% for families living in poverty.9
In addition, among families that paid for childcare, care in homes generally remained near 30% of children between 2019 and 2021 for all income groups, though during the pandemic this share for children of the two higher-income families (i.e., those with incomes at 200%–299% and 300% or more of the poverty line) moved up a bit more than for children of the other two groups.
Finally, among those that paid for childcare, the share of children in Head Start programs remained the same at 15% for families in poverty and at 10% for the highest-income families.10
The amount that mothers living in poverty paid for childcare was a disproportionately higher percentage of their income
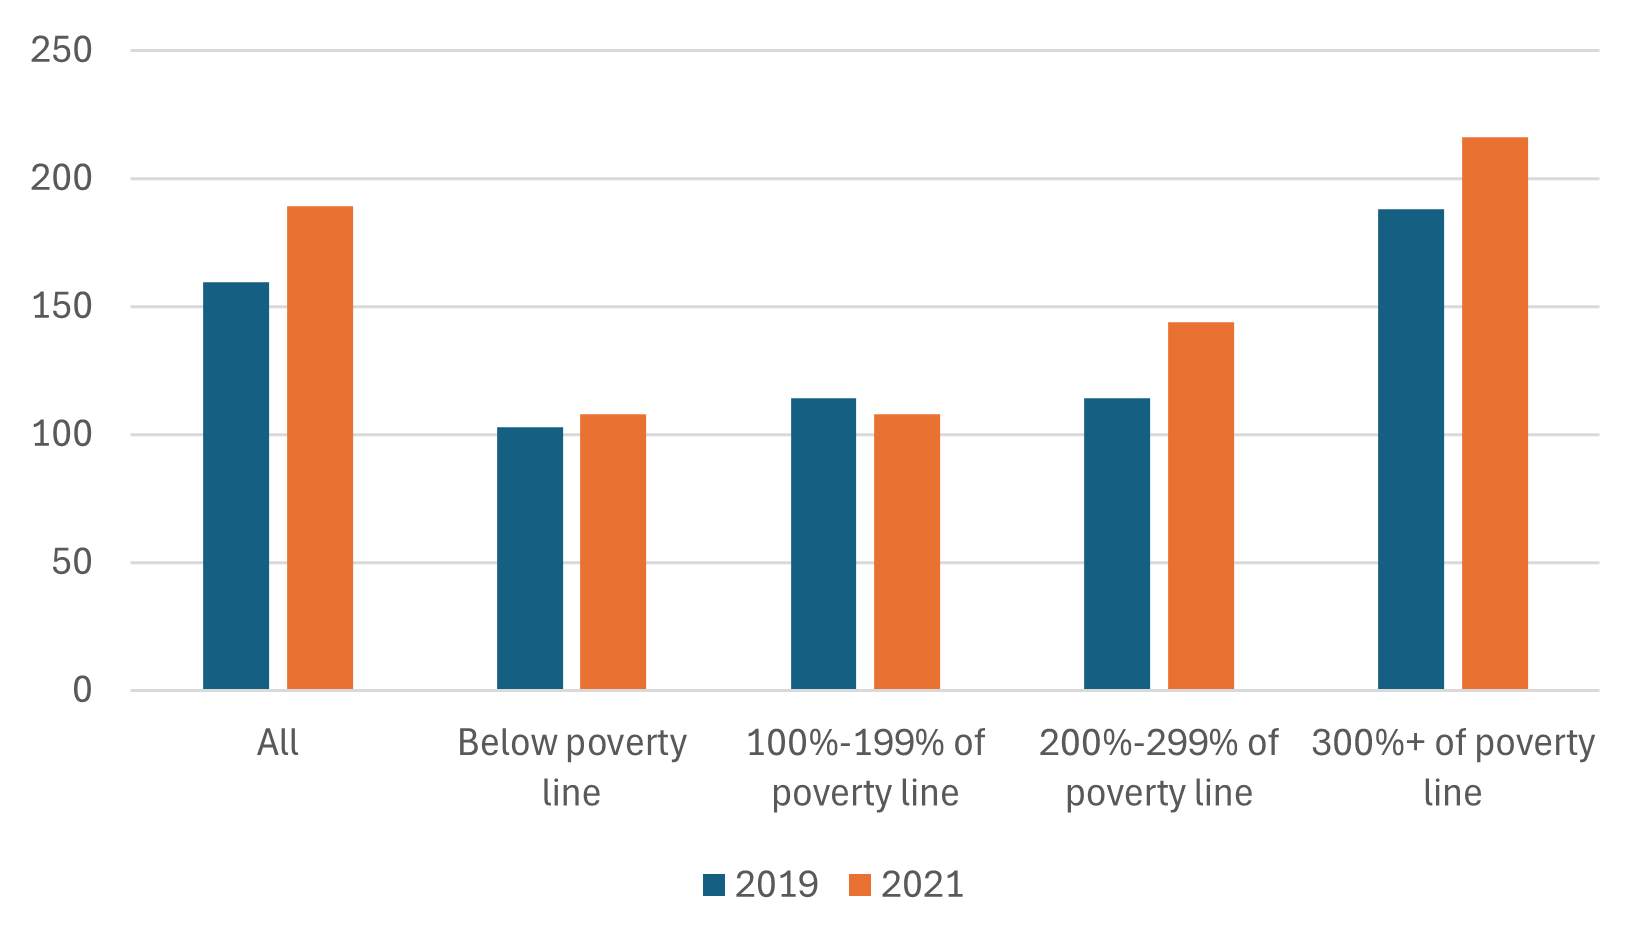
We turn now to analyzing the amount families in our sample paid for childcare, conditional on a positive payment. Figure 7 shows the median amount that families paid per week per child for those families with at least one child under five years old.11 Even within the short two-year period and after controlling for inflation, weekly childcare payments per child for all families in the sample increased to $189 in 2021 from $160 in 2019—more than a 15% increase.12
7. Median weekly costs of childcare per child, by income group
Source: Authors’ calculations based on data from the U.S. Census Bureau, 2020 and 2022 Surveys of Income and Program Participation (SIPP), public-use files.
Families living in poverty paid less for childcare than families with higher incomes. Among families that paid for childcare in 2019, those living in poverty paid a median of $103 per week per child, while those in the highest-income group paid a median of $188 per week per child. These lower payments could reflect many factors, including that families living in poverty have a more limited ability to pay, that they are more likely to have uneven work schedules or other constraints that make it more difficult to use paid childcare arrangements, and/or that they use subsidized childcare services, such as those provided by CCDF programs (see also note 6), relatively more than other families with higher incomes.
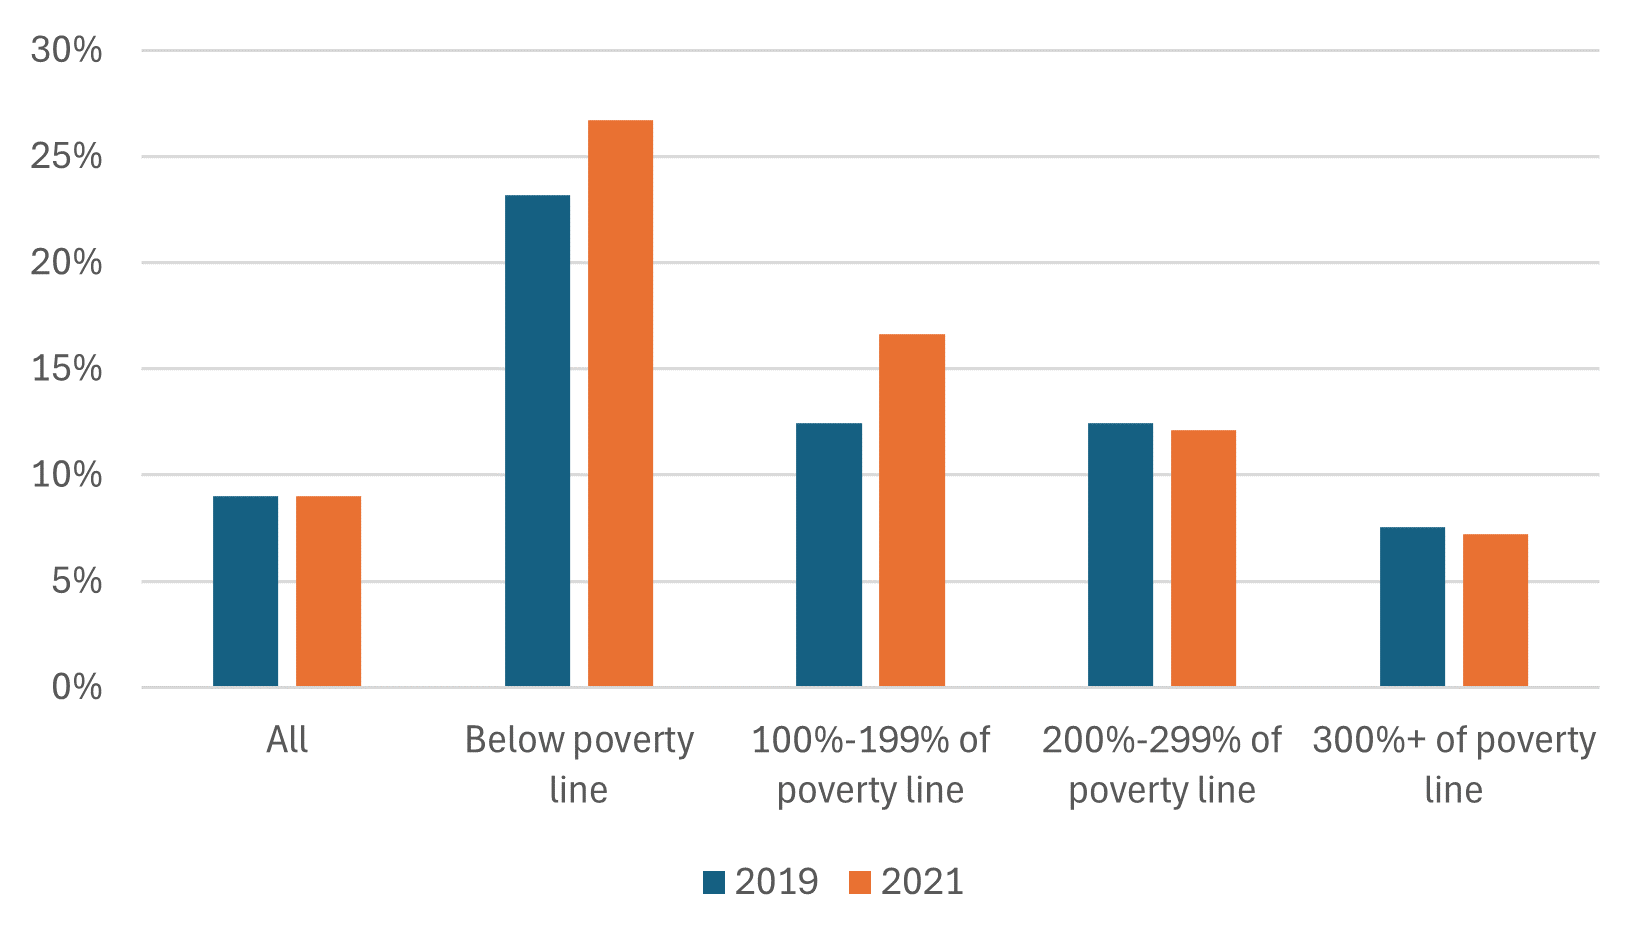
When we consider the burden of childcare payments relative to income, two key facts emerge. Figure 8 shows the total amount paid as a percentage of family income in 2019 and 2021, again conditional on a positive payment for childcare. We report the median percentages for each income group in both reference years. First, childcare payments relative to income are highest for families living in poverty in 2019 and 2021. The U.S. Department of Health and Human Services (HHS) considers childcare affordable when families pay no more than 7% of their income.13 Across nearly every income group in 2019 and 2021 (except for the highest-income group in 2021), we find that families paid a greater share of their income (at the median) than the HHS benchmark of affordability. Policies such as the CCDF exist to help defray the costs of childcare for lower-income parents. Yet to many, childcare affordability remains a challenge, according to the HHS benchmark.
8. Median percentage of income spent on childcare, by income group
Source: Authors’ calculations based on data from the U.S. Census Bureau, 2020 and 2022 Surveys of Income and Program Participation (SIPP), public-use files.
Second, childcare costs relative to income (again, reported as the median shares) increased for all families between 2019 and 2021, except for those with the highest incomes. Those below the poverty line were paying a substantial share of their incomes for childcare, and this share increased from 23% of income in 2019 to 27% in 2021. For those with incomes at 100%–199% of the poverty line, childcare payments were lower relative to income, but they still increased from 12% of income in 2019 to 17% in 2021. For those with incomes at 200%–299% of the poverty line, childcare payments were about 12% of income in both years. For those with incomes at 300% or more of the poverty line, childcare payments relative to income decreased from 8% in 2019 to 7% in 2021.
Conclusion
Using the SIPP, we examined the types of childcare arrangements that mothers used in 2019 and 2021 while they were working, in school, or otherwise unavailable in the United States and how much families paid for childcare in the fall of those two years. We focused on families living in poverty in comparison with other income groups before and after the Covid-19 pandemic arrived in the United States, which disrupted the lives of millions of parents with children as access to paid and unpaid childcare diminished. The full impact of Covid-related disruptions is the subject of much inquiry.14 Families in poverty used paid childcare arrangements, such as day cares, much less than the highest-income families. When families in poverty did pay for childcare, they typically spent a larger share of family income on childcare. We note that the labor force participation rate of those who did not typically pay for childcare and thus who relied more typically on family to provide childcare was lower than for those who typically paid for childcare. In this article, we do not reach any conclusions about whether this difference in labor force participation reflects, even in part, differences in access to affordable paid childcare between these two groups, but that is one potential implication of our analysis.15
Notes
1 This includes any child that attends a childcare location that cares for children in families eligible for Head Start, which means it includes both children in families that receive Head Start benefits and children in families that are not eligible for those benefits.
2 Because the SIPP does not ask the respondent how much time a child spent in any specific care arrangement during the typical week, we cannot tell whether any single arrangement was the primary care arrangement. However, given that the survey question asks about a typical week, the response suggests that any care type listed is likely one in which the child spent some material amount of time.
3 Our sample includes only families with a child under the age of five. However, some of those families also might have had children between the ages of five and 15. Because total amount paid for the childcare arrangement by families with children under the age of five is reported for all children aged 15 and under, not just children under the age of five, the total amount paid for childcare may include some amounts paid for childcare for children aged five through 15 (thus leading to overstated amounts in some cases, which we discuss in more detail in note 11).
4 The fact that this ratio uses before-tax income implies that income also does not include other payments administered through the tax system that many families received in 2021, such as economic impact payments (“stimulus checks”) or advance payments from the expanded child tax credit.
5 The decrease in the share of children cared for in facilities was largest for families living in poverty. For families with incomes at 100%–199% of the poverty line, the share of children in facilities decreased from 39% to 37% between the fall of 2019 and the fall of 2021; and for families with incomes at 200%–299% of the poverty line, it decreased from 35% to 31% over the same period.
6 Families may not report typically paying for childcare when they use arrangements that do not accept monetary payments for care (e.g., the other parent), when they pay for care from time to time but do not consider it typical that they pay because they rely generally on unpaid care, or when they receive benefits, for instance, from the federal or state government, that pay for childcare. One example of a federal program, in partnership with states, is the Child Care and Development Fund (CCDF), which provides vouchers to families with low incomes to access childcare. We find a material amount of families in the SIPP that reported not typically paying for childcare and typically using both facilities and immediate family, yet that did not report Head Start or other benefits that would pay for facilities.
7 This labor force participation rate includes all respondents with any child younger than five years old. When we separately calculate the labor force participation rate by respondents’ reported sex, we find a lower rate for females than males in both groups (i.e., families that paid for childcare in a typical week and those that did not pay for it in a typical week).
8 As noted previously, a family can report typically using a childcare facility, yet also report typically not paying for childcare when they receive benefits from a state or federal program that pays for childcare. In addition, a respondent can give inconsistent answers such as that they used a (paid) facility and (unpaid) immediate family to care for a child during a typical week of fall of the reference year and that they did not pay for childcare during a typical week of fall of the reference year.
9 Again, note that individual SIPP respondents can report multiple types of childcare arrangements; therefore, the care provided by the mothers among families that pay for childcare does not necessarily indicate that the mothers are paying themselves, but rather it indicates that they are paying for care in some form and also looking after their children while working or in school.
10 We assume that children in families with high incomes were listed as being in Head Start when they attended a childcare location that accepted children eligible for Head Start even when the children in the high-income families themselves were not eligible.
11 As noted previously (see note 3), because childcare payments may include payments for children aged five through 15, we will overstate childcare expenses for children under five when a family also paid for childcare for those aged between five and 15. We believe, however, that any such overstatement is small given that most childcare expenses are for children under five years old. We deduce this not only because most paid childcare arrangements are indeed for children under five, but also because paid childcare arrangements for children aged five through 15 are, on average, less expensive than such arrangements for younger children. Consistent with this, we find that only about 25% of families with only children aged five through 15 used paid childcare arrangements and their average weekly childcare payment was over $100 less than the average for families with at least one child under the age of five.
12 Amounts paid are adjusted to 2021 dollars using the U.S. Bureau of Labor Statistics’ CPI (Consumer Price Index) Inflation Calculator.
13 See also the HHS’s final rule for the CCDF, published on March 1, 2024, in the Federal Register.
14 See Eggleston et al. (2023).
15 For more information on labor force participation rates among women with young children during our analysis period and afterward, see Furman, Kearney, and Powell (2021) and Garcia-Jimeno and Hu (2024).


