

In the U.S., many parents of young children may not have enough childcare providers near them, which may limit not only their childcare access but also their employment opportunities. In this article, we explore how data on people’s visiting patterns to childcare providers might help inform our understanding of the geographic distances between where families live and where providers operate, as well as how these distances and the capacity of providers can affect childcare access. Our research is part of the Chicago Fed’s Spotlight on Childcare and the Labor Market, a targeted effort to understand how access to childcare can affect employment and the economy.
Anonymized geolocation data from Advan Research provide us a detailed but incomplete picture of childcare access. These data give us at least two details that can be hard to find in traditional data sources. First, these data allow us to see trips families take from home to a childcare provider and, therefore, the approximate distance traveled between the two locations. Second, by giving us information on the number of trips families take to each provider over a particular period, we can get a sense of the effective capacity of each provider (and how it is changing over time).
We use these two details from the Advan data to create two measures of childcare accessibility in the five midwestern states of the Seventh Federal Reserve District (which is served by the Chicago Fed)—Illinois, Indiana, Iowa, Michigan, and Wisconsin.1 The first measure is the median distance traveled during trips between a residence (specifically, the home census block group) and childcare provider. The second measure is an estimate of “market access” to childcare providers for each census tract in the states we study. In one version of this measure, we explicitly take into account our estimate of the capacity of each provider. By “access,” we mean how many childcare facilities or how much childcare capacity is located within a certain distance of each census tract. Our market access measure estimates the local supply of childcare for each census tract and consists of a weighted sum of the number of childcare facilities or capacity available at each distance from the tract’s centroid (i.e., from the closest to the farthest facility), with closer locations being weighted more heavily.
The key findings from our exploration of these anonymized geolocation data are as follows:
- Anonymized geolocation data appear more likely to capture visits to large facility-based childcare providers and to miss visits to smaller providers that usually have lower capacity, including family day cares.
- In the fourth quarter of 2022, half of the families that traveled to one of these childcare providers traveled at least 3 miles from home.
- Between 2018 and 2022, the median distance traveled between home and childcare provider increased by at least 10% for each of the Seventh District states except for Illinois, where it remained virtually the same.
- Measures of access to childcare show that such market access, on average, was improving before the pandemic hit the U.S. in early 2020, then dropped significantly after the onset of the pandemic, and had not fully recovered by 2022. The version of our market access measure that accounts for provider capacity implies that in 2022 access stood at about half of its level in 2019.
Limitations of confidential and anonymous geolocation data
We use anonymized geolocation data provided by Advan Research that offer a detailed but incomplete picture of visits to childcare providers. When a cellphone user opts in, Advan matches geolocation pings generated by third-party applications on their cellphone to business locations and classifies a visit when the cellphone stays at the location for at least four minutes. To protect the privacy and identity of cellphone users who opt in, Advan reports aggregate visits to origin–destination pairs for each week, with the origin being the inferred census block group where the cellphone owner resides (specifically, the census block group’s centroid) and the destination being the business location. We use weekly data collected over the period 2018–22.
The Advan data have some limitations. For one, the set of cellphone users who opt in and for which Advan observes the geolocation pings is incomplete and changes over time. Advan tracks about 10% of all cellphones in the U.S.
Second, Advan adds artificial data distortions to the counts of visits for origin–destination pairs to further protect the privacy of the cellphone users whose pings Advan receives. This can make the median distances traveled we compute and report in the following sections less accurate.2
A third limitation is that the Advan geolocation data do not capture all visits to childcare businesses. To better understand which childcare locations the Advan geolocation data are likely to capture or miss, we compared the childcare locations we see in these geolocation data with a list of day care providers in Illinois from the Illinois Department of Children & Family Services, which includes the authorized capacity of each provider.3 The childcare providers that appear in both the Advan geolocation data and the Illinois list have much higher average authorized capacity than those that only appear in the Illinois list. We infer that by using Advan data, we are more likely to capture visits to the large facility-based childcare providers in the five Seventh District states and to miss visits to the smaller providers that tend to have lower capacity, such as family day cares.
Measuring how far people travel for childcare
We now turn to our first measure of accessibility: the distance people travel to childcare providers. For each provider, we use the geolocation data to calculate the distance between the centroid of each census block group whose residents visit that specific provider and the location of the provider in a given week. We only include visits to providers in the five Seventh District states from home census block groups in those same states.
In figure 1 we show the median distance traveled to a childcare provider each quarter4 and how that changed between the first quarter of 2018 and the fourth quarter of 2022. The median distance was steadily increasing in the pre-Covid period: It rose from around 2.8 miles in the first quarter of 2018 to 3.2 miles in the third quarter of 2019. With the onset of the pandemic in the U.S., the median distance dropped sharply to about 2 miles in the second quarter of 2020. This decline in median distance traveled between home and childcare provider occurred at the same time as the geolocation data indicate there was a sharp decline in total number of visits to childcare providers (not shown). We speculate that the drop in median distance could have been due to a change in the composition of who was using childcare after the onset of the pandemic in the U.S.—with the people who had used farther-away childcare options having switched to keeping their children at home and the people who had used closer options having kept their children in day care.1. Median distance traveled to childcare in Seventh District states, 2018–22
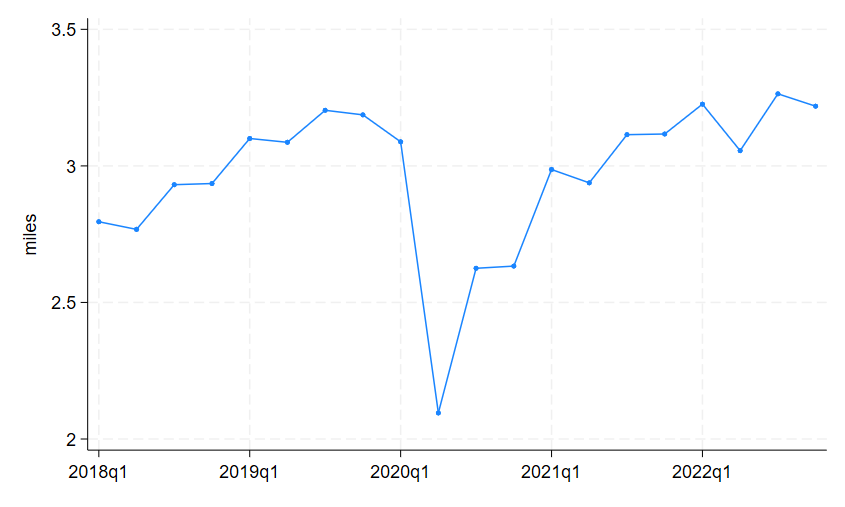
Source: Authors’ calculations based on data from Advan Research.
In 2021 there was a sharp rebound in visits to childcare providers as economic activity bounced back. Since then, the median distance to a provider has been trending upward. We see that in the final quarter of 2022 families typically traveled a little over 3 miles from their homes to get to a childcare provider and that this is about half a mile more than in the first quarter of 2018 (see figure 1). Part of the increase in distance appears to be a reversal of the decrease in distance during the early phases of the pandemic in the U.S., while the remainder may be the continuation of an upward trend that was occurring before the pandemic.
Figure 2 shows the median distance traveled to childcare providers in each of the five Seventh District states for the entire year of 2022.5 Families in Michigan had to travel the farthest (the median being almost 4 miles), while those in Illinois and Wisconsin traveled the least (around 3 miles). Families in Indiana and Iowa traveled between 3 and 3.5 miles. The general time patterns of the median distance to childcare for each Seventh District state (not shown) are all quite similar to the time pattern for the five-state region as a whole shown in figure 1: Each state saw a rising trend in its median distance prior to the pandemic, a decline during the pandemic, and then a subsequent increase. However, figure 3 shows that the states differed in whether the median distance traveled in 2022 was back down to its pre-Covid level (recorded in 2018). In Iowa and Michigan, the median distance in 2022 was above its pre-Covid level by more than 20%; in Indiana and Wisconsin, it was about 10% above its pre-Covid level, but in Illinois it was quite close its pre-Covid level.
2. Median distance traveled to childcare in each Seventh District state, 2022
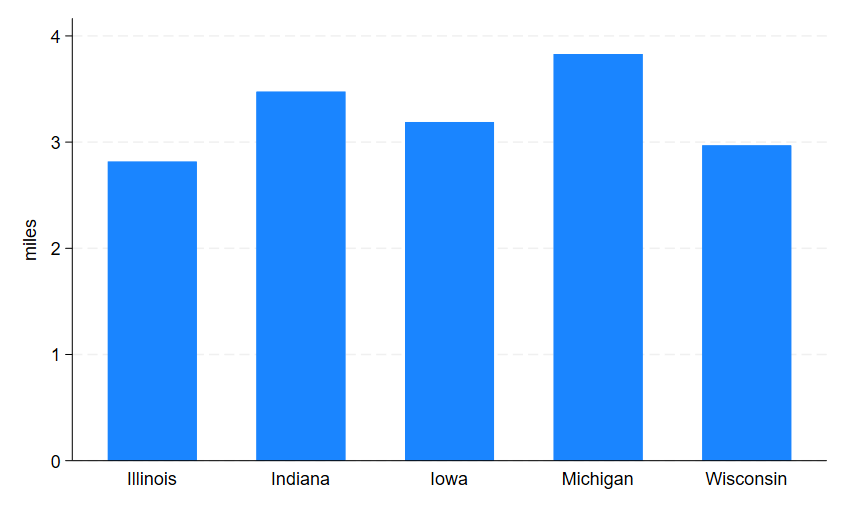
Source: Authors’ calculations based on data from Advan Research.
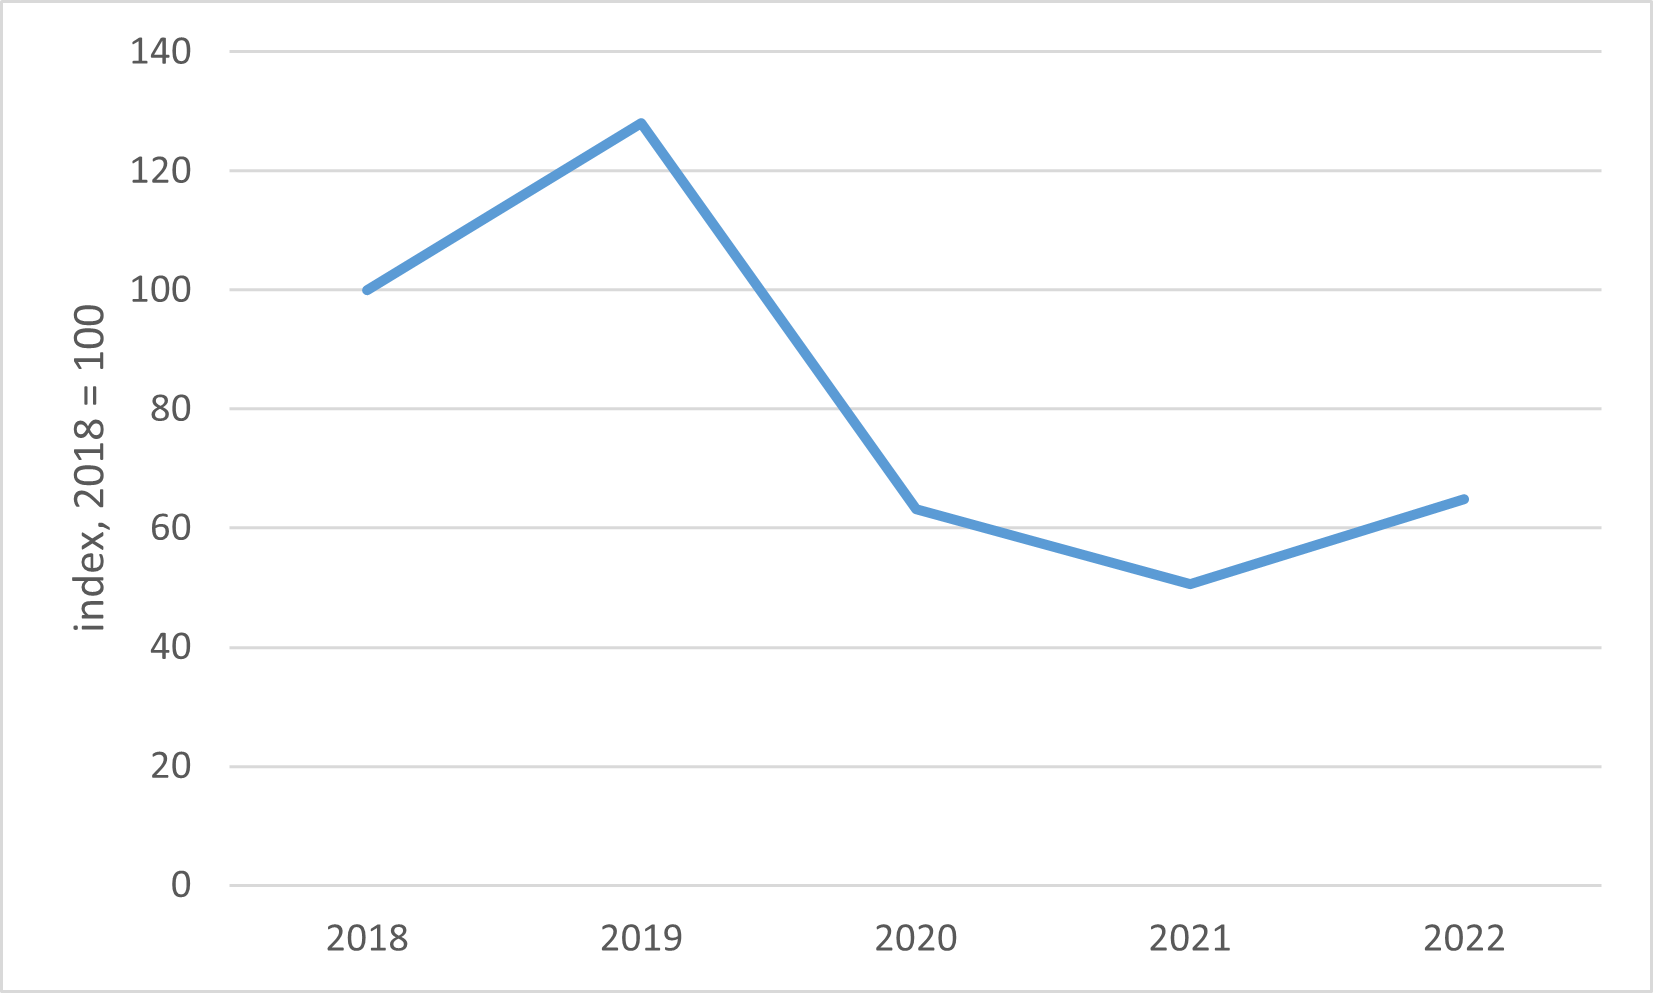
3. Percent change in median distance traveled to childcare in each Seventh District state, 2018–22
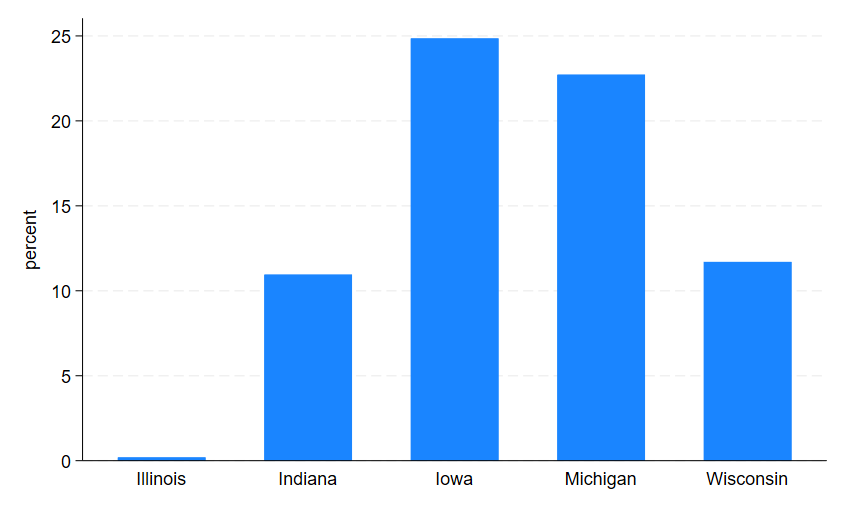
Source: Authors’ calculations based on data from Advan Research.
While the correlation is not perfect across all five states, there does seem to be a relationship between the drop in the number of children aged 0–4 years old in a state and the change in the median distance traveled from home to a childcare provider between 2018 and 2022. Over this span, Illinois had an 11% drop in the population aged 0–4 years old, according to our calculations based on data from the 2018 and 2022 American Community Surveys,6 and saw virtually no increase in the median distance traveled to a childcare provider. Meanwhile, the other Seventh District states had smaller percentage drops in the population aged 0–4 years old (ranging from 4% to 9%) and experienced 10% or higher increases in the median distance traveled to a childcare provider. This correlation is consistent with a story in which diminished nearby childcare capacity required people to travel farther for childcare in states where the population of very young children (who potentially need childcare while their parents work) did not fall very much. However, there are many other possible explanations for the correlation as well.
Measuring market access to childcare providers
We now turn to our second measure of childcare accessibility: market access to childcare providers. Here, we construct a measure of access that residents of every census tract in the five Seventh District states have to childcare locations in those five states. This measure considers families residing in a census tract to have greater access to childcare locations that are closer to the tract’s centroid and less access to locations farther away from the tract’s centroid. We create two versions of this measure—one that accounts for only the location of a provider and a second that accounts for both a provider’s location and effective capacity (the latter based on the peak number of visits to a provider throughout a calendar year).
We refer to the first version of our market access measure as “market access to locations”7 and to the second version as “market access to capacity.”8 Our goal with this second version is to explore whether the geolocation data allow us to generate a more accurate estimate of the number of children each provider cares for (i.e., its effective capacity) rather than the number of children that the law authorizes it to care for (which previous studies on childcare tend to rely on). A more accurate measure of provider capacity is preferable when limited staffing and other factors could cause a location to care for fewer children than the number of children the law authorizes a location to care for. Because we do not observe actual childcare capacity nor the actual number of children associated with any visit to a childcare location directly, we use a proxy measure for capacity—namely, the peak number of visits to the facility throughout the year. We form this proxy measure for each provider by taking the 75th percentile of the weekly count of visits to the provider over the 52 weeks in each calendar year—and by making one key modification in processing the provider capacity data, which we explain in the next paragraph.9
Of course, because we can’t observe the actual capacity of childcare providers, we don’t know how well our proxy performs as an approximation. To check how well it might be performing, we initially compared our 75th-percentile-based proxy of capacity using Advan data (sans any modifications) with Illinois state records on the authorized capacity of childcare providers, included in the list of providers from the Illinois Department of Children & Family Services mentioned previously. We don’t expect these data to exactly match because 1) the Advan data consist of only roughly 10% of cellphones in the U.S. (as we mentioned earlier), 2) multiple people with different cellphones in the Advan data may pick up and drop off one or more children, and 3) the effective childcare capacity of a location may be lower than the authorized capacity as a result of staffing shortages. The first and third factors would lead to the number of visitors counted per week being lower than the authorized capacity of the childcare location; however, the second factor—i.e., multiple people with different cellphones picking up and dropping off the same child(ren) in a particular week—might lead to the number of visitors counted per week being higher. We find that for 92.7% of Illinois childcare locations, our 75th-percentile-based proxy of capacity is lower than the authorized capacity. When we focus solely on these locations with lower than authorized capacity, the correlation between our proxy measure and authorized capacity increases substantially. The lower correlation when all Illinois childcare locations are considered is being driven by a small number of unusually large values for our 75th-percentile-based proxy measure of capacity. After examining the distribution of our proxy measure across childcare locations, we opted to make one key modification: We replaced the largest 10% of the proxy measure with the 90th percentile value in each year.10 We process the data for Illinois and the other Seventh District states in this manner to generate our final metric for market access to capacity.
In figure 4 we describe the time patterns in the two versions of our measure of market access to childcare. For each version, we show the average of that measure across the census tracts in the five Seventh District states.11 In both panels A and B of figure 4, we index market access with 2018 as the base year and set it to 100. Both versions of the market access measure can change over time when the supply of childcare changes, such as when locations close, open, or move. The capacity-based version can also change if our estimate of the capacity of a location changes due to staffing shortages. In contrast, changes in demand, such as changes in the number of young children as a result of families with young children moving closer to or farther away from childcare locations, will not change the measure over time unless these changes cause our proxy measure of capacity to change because more or fewer families are visiting the childcare location. While we were aiming for a measure of peak usage (to approximate effective capacity), we recognize that it is entirely within the realm of possibility that our proxy for capacity is picking up fluctuations in usage driven by changes in demand.
4. Average market access to childcare providers in Seventh District states, 2018–22
A. Market access to childcare locations
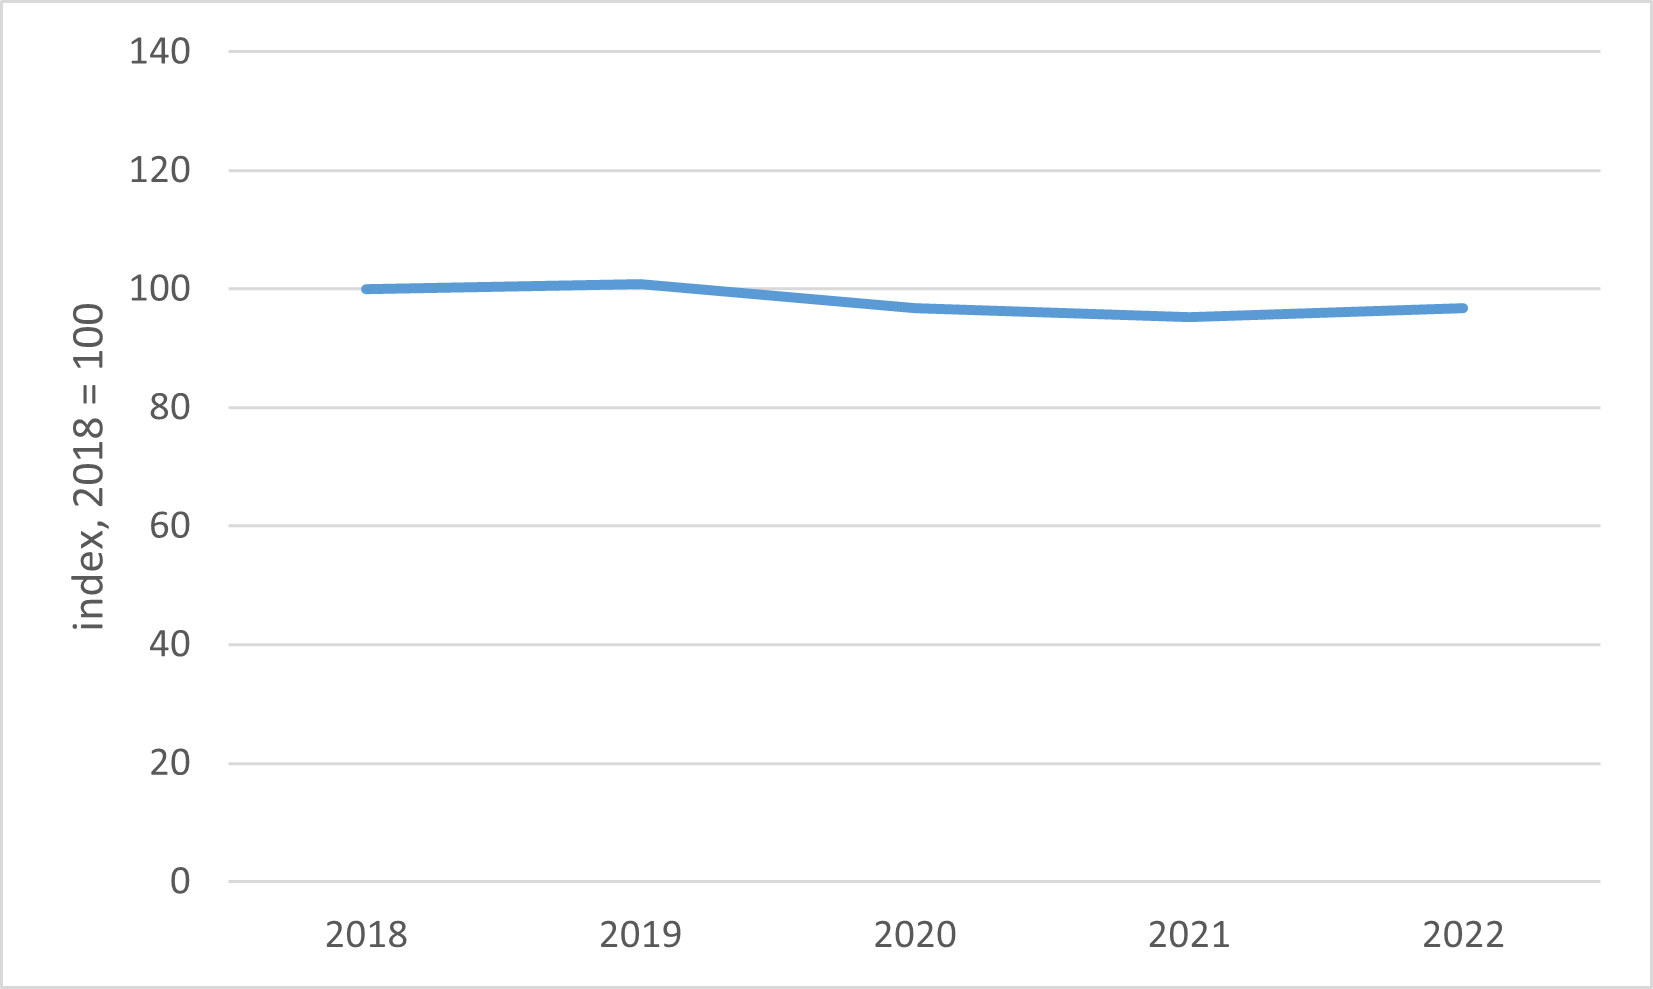
B. Market access to childcare capacity
Sources: Authors’ calculations based on data from Advan Research; and U.S. Census Bureau, American Community Survey, five-year population estimates for 2018–22, from IPUMS NHGIS, University of Minnesota, available online.
As shown in panel A of figure 4, for market access to childcare locations, we find that average access was improving from 2018 to 2019, prior to the pandemic. However, there was a drop in 2020, followed by a more modest decline in 2021 and then a slight improvement in 2022. Overall, however, the average market access to childcare locations in 2022 is about 4% below its level in 2019, driven by increases in the share of temporarily closed locations. We see a broadly similar time pattern in panel B of figure 4, when we consider average market access to childcare capacity. However, by this metric, market access in 2022 is only about half the level it was in 2019, driven by both the increase in the number of temporarily closed locations and large decreases in the number of visitors to still open locations.12 This is consistent with other work using employment and establishment data that shows that there were still fewer childcare workers in 2022 than in 2019, but that the number of establishments was higher in 2022 than in 2019.
Conclusion
For this article, we used anonymized geolocation data from Advan Research to analyze childcare use and accessibility in Illinois, Indiana, Iowa, Michigan, and Wisconsin—the five states that fall within the Seventh Federal Reserve District—between 2018 and 2022. We explored whether these data could help us to gain insights into the distance families travel to childcare locations and the effective capacity of childcare providers. We found that families in the five Seventh District states typically travel around 3 miles to visit a childcare provider, subject to the data limitations we described. This is consistent with other estimates of the distance traveled between home and provider based on confidential household travel surveys. We also show that this distance has been increasing in recent years, but that the upward trend was interrupted during the early phases of the pandemic in 2020. We also developed a measure of market access that quantifies the overall availability of childcare for residents of every census tract in the five midwestern states we studied—with one version of the measure considering just the provider location and the other considering both provider location and capacity. The two versions of our market access measure show that there was a decline in market access after the pandemic began and that there was very little improvement between 2020 and 2022. The decline in childcare access made evident by increasing distances to childcare providers and their decreasing effective capacity following the early phases of the pandemic may be making life more complicated for working parents with young children.
Notes
1 Geolocation data for the entirety of each of the five Seventh District states are used in our analysis, although technically, the Seventh District comprises all of Iowa and most (but not all) of Illinois, Indiana, Michigan, and Wisconsin.
2 In another setting, using smartphone geolocation data (similar to those from Advan) and running simulations, we found such privacy-related data distortions to overstate estimates of visitors’ median distance traveled from their residences to bank branches within the Seventh District by around 10%.
3 We accessed this list from the Illinois Department of Children & Family Services in the fall of 2023.
4 To derive this quarterly median distance, we pool all of the visits between a residence and childcare provider in the quarter across the five Seventh District states and then take the median.
5 To derive this annual median distance, we pool all of the visits between a residence and childcare provider in the year 2022 for each Seventh District state and then take the median.
6 U.S. Census Bureau, American Community Survey, population estimates for 2018 and 2022, from IPUMS NHGIS, University of Minnesota, available online.
7 This is a distance-weighted sum of all open childcare locations, where each location receives a weight of one divided by the distance in miles from the tract’s centroid to the location. For example, this means that locations that are a half mile away from the tract’s centroid get a weight of 2, those a mile away get a weight of 1, and those 2 miles away get a weight of 1/2. A location that is only open for part of the year is counted as the number of weeks open divided by 52 (instead of being counted as one whole location).
8 For this version of our market access measure, instead of a distance-weighted sum of locations, we calculate a distance-weighted sum of the effective capacity of each location (based on the peak number of visits to the provider, as defined later in this section). Again, the weights are equal to one divided by the distance in miles from the tract’s centroid to the childcare location. We include weeks with zero visits to a childcare provider as we determine the peak number of visits to the provider—which is how we implicitly account for any temporary closures.
9 We also experimented with using the median or the 90th percentile of weekly count of visits (with and without the additional modification) and found similar patterns.
10 We are able to match 68% of the Advan childcare locations in Illinois by finding an Illinois licensed provider in that list from the Illinois Department of Children & Family Services within 0.1 miles. Matching in this manner avoids difficulties of inconsistent childcare provider names across the two data sets. We find that the correlation in capacity across the two data sets increases substantially from 0.06 to 0.30 when we focus solely on the locations where our 75th-percentile-based proxy measure of capacity is less than the Illinois maximum capacity in 2022. As stated in the main discussion, the lower correlation is being driven by a small number of unusually large values for our (unmodified) proxy measure of capacity. We find the same correlation of 0.30 when we replace the top 10% of our 75th-percentile-based proxy measure of capacity with its value at the 90th percentile across locations in each year.
11 The time series of the two versions of our market access measure are averages weighted by the population of 0–4 year olds in each census tract. We use five-year tract-level American Community Survey (ACS) population estimates for the 2018–22 period and so our population weights do not change over the period.
12 Population estimates from the U.S. Census (see note 6 for details) show that the number of 0–4 year olds (a proxy for childcare demand) declined in each of the Seventh District states between 2018 and 2022, but by less than the average market access to capacity reported in figure 4, panel B (–35%): –11% in Illinois, –4% in Indiana, –9% in Iowa, –6% in Michigan, and –6% in Wisconsin.


