Overall, economic growth was steady during the first half of 2024 in both the nation and the Seventh Federal Reserve District.1 Real gross domestic product (GDP) growth slowed some in both, but employment growth was up, especially in the District. Over the last few years, the District has almost always lagged the nation in both real GDP and employment growth, continuing a decade-long trend. Slower growth and slower inflation often go hand in hand, and recent data indicate inflation has indeed been somewhat lower in the Midwest.
Growth was solid in the first half of 2024
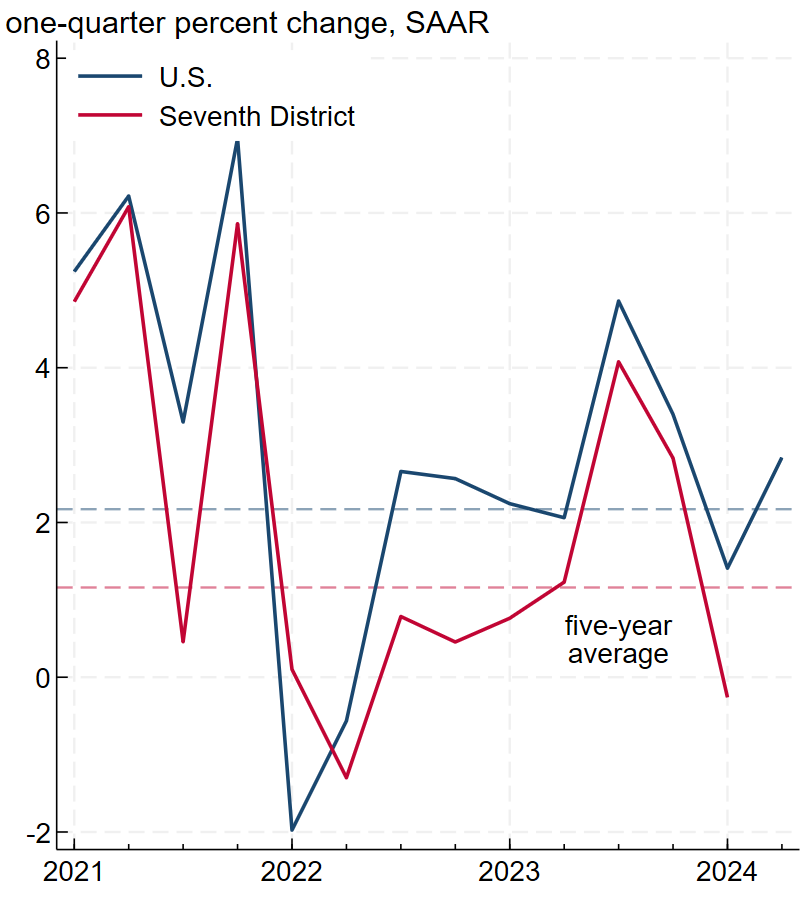
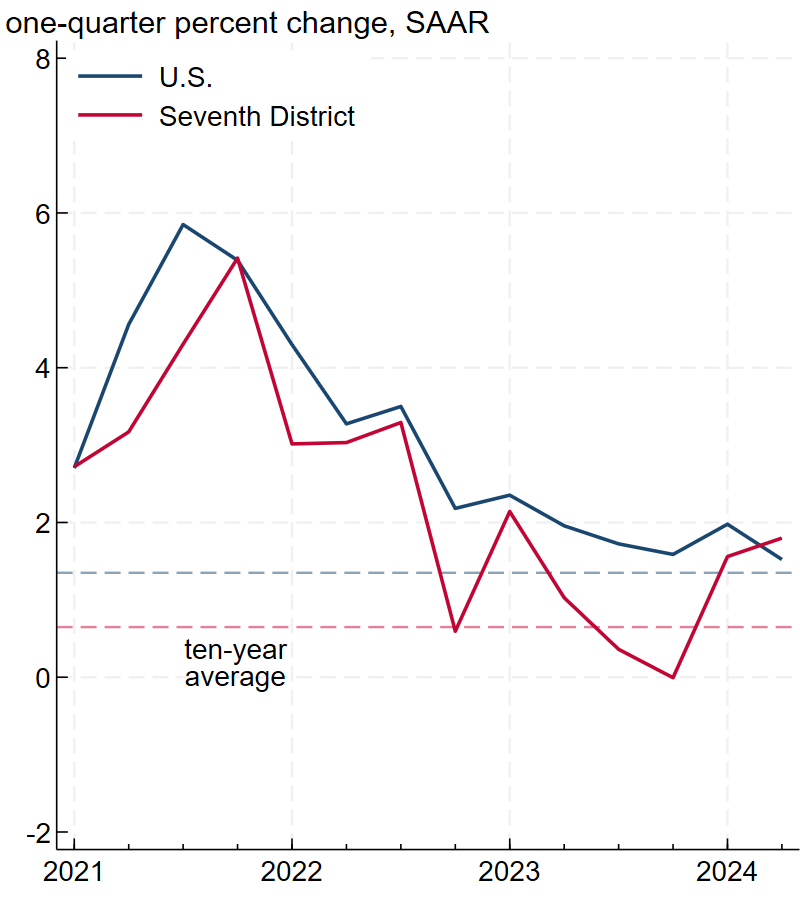
As we discussed in our 2023 year in review, real GDP growth in 2023 was unexpectedly high for both the nation and the District. Panel A of figure 1 shows that so far in 2024, real GDP growth for the U.S. (blue line) has slowed to around its five-year average—a solid result. We do not yet have 2024:Q2 real GDP data for the Seventh District (red line), but as in the nation as a whole, growth slowed sharply in 2024:Q1. However, because real GDP growth in the U.S. picked up in the second quarter, growth in the District is likely to have as well. The employment numbers shown in panel B of figure 1 do not indicate a slowdown through June. Rather, quarterly jobs gains in the U.S. were a bit higher to start 2024 than in the second half of 2023, and gains in the Seventh District were much higher. Consistent with long-run averages (the dashed lines), both real GDP and employment growth continue to be slower in the Seventh District than in the nation as a whole (with the exception of District employment growth in 2024:Q2).
1. Real gross domestic product (GDP) and nonfarm payroll employment growth in the U.S. and the Seventh District
A. Real GDP
B. Employment
Sources: Authors’ calculations based on data from the U.S. Bureau of Economic Analysis and U.S. Bureau of Labor Statistics from Haver Analytics.
Recently, inflation has been slower in the Midwest than in other parts of the country
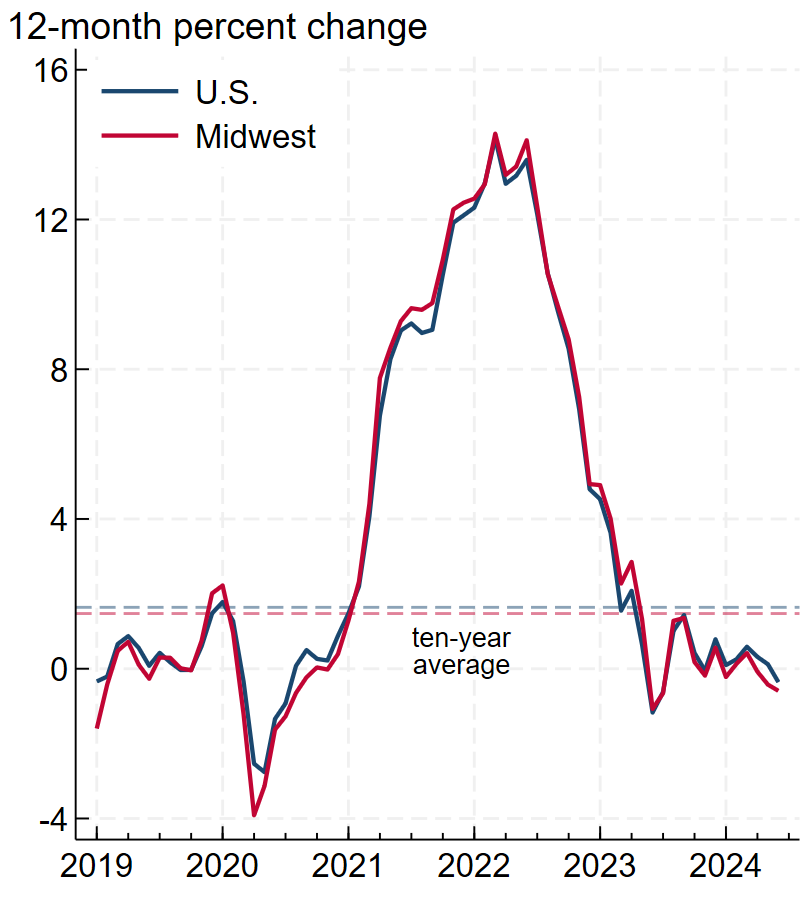
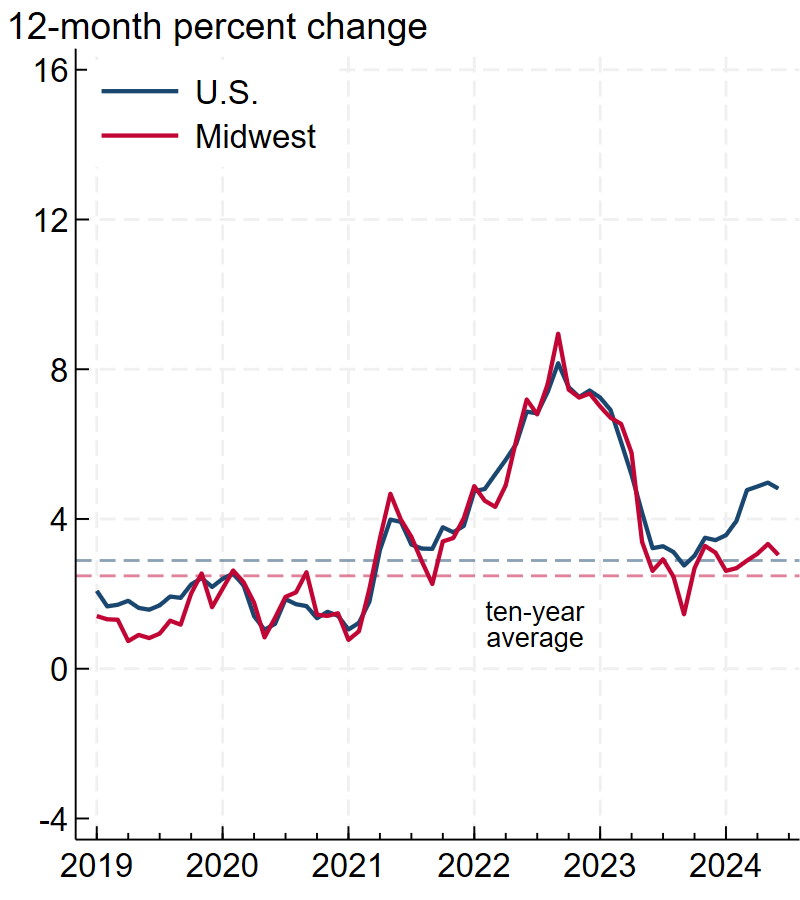
Over the long run, regions with slower growth tend to have slower inflation. We investigate whether Midwest inflation is currently slower than national inflation using the Consumer Price Index (CPI) from the U.S. Bureau of Labor Statistics. CPI data are not available at the state level so we cannot calculate Seventh District inflation, but data for the U.S. Census Bureau’s Midwest region are available, and this region fully encompasses the five Seventh District states.2 Figure 2 shows that year-over-year inflation has indeed been slower in the Midwest than in the U.S. since the middle of 2022—about the time when inflation started falling from the peak it had reached after the start of the pandemic. The two dashed lines in figure 2 indicate that the recent difference between the nation’s and Midwest’s one-year inflation is similar to the difference between their long-run inflation averages.
2. Consumer Price Index (CPI) inflation in the U.S. and the Midwest

Source: Authors’ calculations based on data from the U.S. Bureau of Labor Statistics from Haver Analytics.
Slower relative inflation in the Midwest is due to nonshelter services inflation
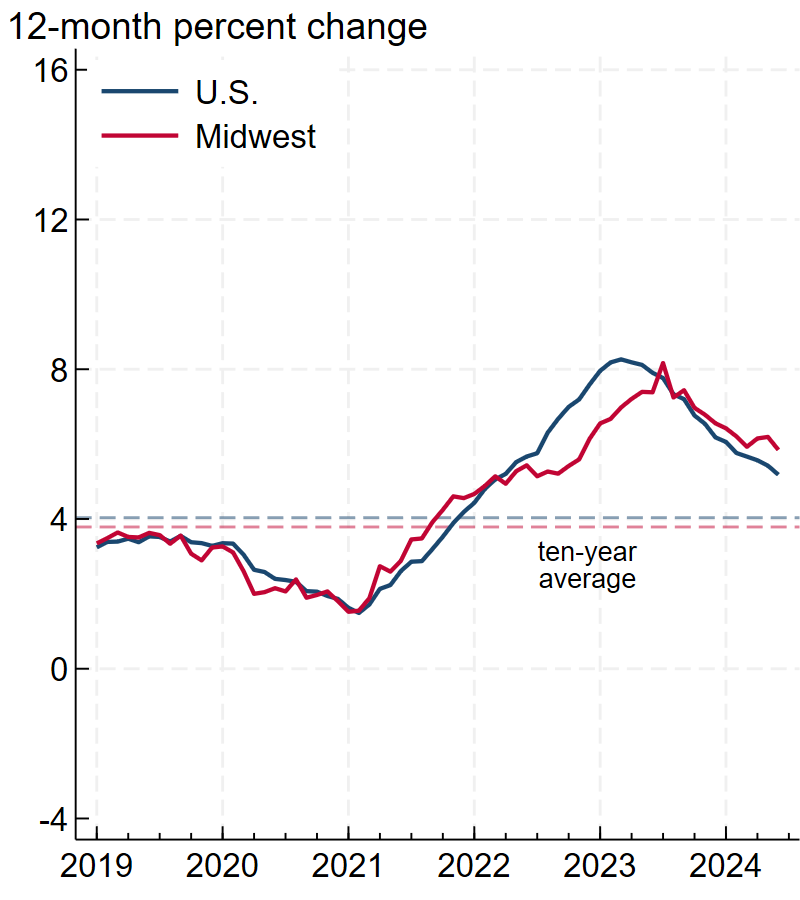
Overall CPI inflation is the average of inflation for a basket of consumer goods and services,3 and we would like to know which categories in the basket are behind the difference between U.S. and Midwest inflation. We divide overall inflation into three major categories—commodities, shelter, and nonshelter services—and display their paths in figure 3. The first category we consider is commodities inflation, which is shown in panel A. Commodities include goods such as food, gas, and household furnishings. There is little difference between commodities inflation in the U.S. and Midwest, both recently and historically. Over the past year, commodities inflation was –0.3% for the U.S. and –0.6% for the Midwest, while over the past ten years it averaged 1.8% and 1.7% (see the two dashed lines), respectively. The difference between the nation’s and Midwest’s one-year commodities inflation is quite small, as is the difference between their ten-year averages. Most commodities (such as fuel and electronics) can be transported at a low cost, which means that if prices are sufficiently different between two regions, there is an arbitrage opportunity.4 The ability for entrepreneurs to arbitrage goods prices helps keep price levels and inflation rates similar across regions.
Unlike commodities, most services are expensive to transport long distances. For example, few people are willing to travel far to purchase restaurant food or childcare. Limits on arbitrage for services means price levels can vary widely across regions and that price inflation can as well. The most prominent service with large price level differences is shelter (the second major category of inflation). For example, according to the Census Bureau’s American Community Survey, median rent in the Los Angeles, California, metro area was $1,887 per month in 2022, while median rent in the Decatur, Illinois, metro area was $774 per month. Panel B of figure 3 shows that shelter inflation for the U.S. and Midwest has followed a similar path in recent years, but there have also been times with notable differences. In 2022, for example, shelter inflation was rising throughout the U.S., but did not rise as much in the Midwest. Midwest shelter inflation caught up to U.S. shelter inflation in mid-2023 and has stayed above it ever since. Historically, shelter inflation in the Midwest has been lower than in the nation as a whole, largely because of the region’s slower economic and population growth. Given the recent real GDP and employment data, it is likely one-year shelter inflation in the Midwest will eventually fall below one-year shelter inflation in the U.S.
Slower shelter inflation is often an important reason that Midwest inflation is below U.S. inflation, but at the moment, Midwest inflation is slower almost entirely on account of slower nonshelter services inflation (the third major category of inflation). Panel C of figure 3 shows that like inflation in shelter, inflation in most other services has historically been lower in the Midwest than in the nation, again largely because of relatively slower economic and population growth. But the gap has been especially large recently. As of June 2024, one-year nonshelter services inflation was 4.8% in the U.S., but just 3.0% in the Midwest. The nonshelter services category covers a wide range of services, including medical care, transportation, higher education, and childcare. In our examination of the inflation numbers for subcategories of nonshelter services, there was no one source of lower relative inflation in the Midwest. Rather, inflation was lower in almost all nonshelter services subcategories.
3. Commodities, shelter, and nonshelter services inflation in the U.S. and the Midwest
A. Commodities
B. Shelter
C. Nonshelter services
Source: Authors’ calculations based on data from the U.S. Bureau of Labor Statistics from Haver Analytics.
Long-run factors appear to be dominating recent developments in both economic growth and inflation
In this regular series of articles on economic developments in the Seventh District, we have been reporting on economic growth moving toward trend in both the U.S. and Seventh District since our 2022 year in review. At this point, growth through 2024:Q2 appears to be near trend in both the nation and the District. This suggests that the influence of short-run, cyclical factors on current economic conditions are limited and that long-run factors are largely driving recent developments. In terms of real GDP and employment growth, the Seventh District has been relatively slow for many years, and that’s what we’re seeing recently. The same is true for inflation: Earlier research from the Chicago Fed showed that Midwest inflation over the period 2002–23 was slower than the nation’s, and we’re also seeing that recently.
Notes
1 The Seventh Federal Reserve District (which is served by the Chicago Fed) comprises all of Iowa and most of Illinois, Indiana, Michigan, and Wisconsin. In this article, we analyze the entirety of each state in the District.
2 The Census Bureau’s Midwest region comprises 12 states: Illinois, Indiana, Iowa, Kansas, Michigan, Minnesota, Missouri, Nebraska, North Dakota, Ohio, South Dakota, and Wisconsin. For details on the Census Bureau’s regions and divisions, see this map.
3 The average is weighted based on items’ expenditure shares as reported by the Consumer Expenditure Surveys program. For more information on how the Consumer Price Index is calculated, see this CPI overview page.
4 For many goods, such as oil, there has long been a worldwide market. In the last few decades, online platforms have created worldwide markets for many consumer goods as well; see here for more details.


