Seventh District Year in Review—A Speedy yet Halting Recovery
The Seventh District (and the nation) experienced strong growth during 2021 as the economy recovered from the pandemic recession. But the ebbs and flows of the pandemic continue to hold sway over the pace of economic activity and prevented a complete recovery. The labor market tightened considerably over the year, while supply chain constraints held back growth in manufacturing. The outlook for 2022 is for another year of strong growth, but that will depend on the pandemic waning and labor supply and supply chain constraints easing.
Strong GDP and employment growth
The latest forecast from the Federal Open Market Committee (FOMC) is for U.S. gross domestic product (GDP) to have increased by 5.5% in 2021, which is well above the committee’s trend growth estimate of 1.8%. While we will not have national 2021 GDP results until late January and Seventh District results until late March, it’s reasonable to expect that Seventh District growth will turn out to have been well-above trend. One reason is that the nonfarm payroll employment data for the Seventh District,1 which are available through November 2021, have been extraordinarily strong (GDP and employment growth are highly correlated). District employment increased by an average of 150,000 in the five years prior to the pandemic, but in 2021, employment grew 614,000 through November.
The District’s employment growth has closely tracked the nation’s since the start of the pandemic. This is clear in figure 1, which shows the month-to-month percent change in employment starting in 2020 (panel A) and 2021 (panel B). In 2020, the District experienced a somewhat steeper decline in employment than the nation, but its initial recovery was also somewhat steeper. The District’s employment growth gyrations in 2021 continued to track those of the U.S. closely. While not the only explanation, the ebbs and flows of the virus account for many of the movements in growth in 2021. During the first half of 2021, growth in both the Seventh District and the nation accelerated in most months as new Covid cases steadily dropped. But in the second half, the direction of growth reversed course with the emergence of the Delta variant. During most of 2021, the District’s growth was slower than the nation’s: From January to November, employment was up 4.3% in the U.S., but up 3.6% in the District.
Figure 1. Employment growth in the U.S. and Seventh District
A. Scaled for 2020–21
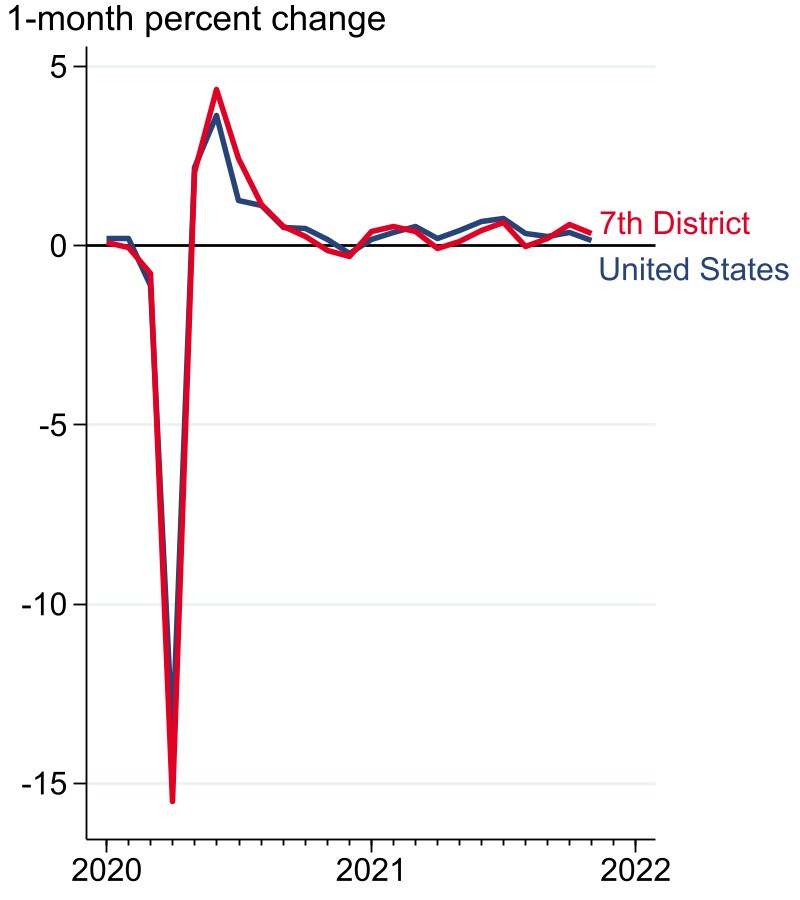
B. Scaled for 2021
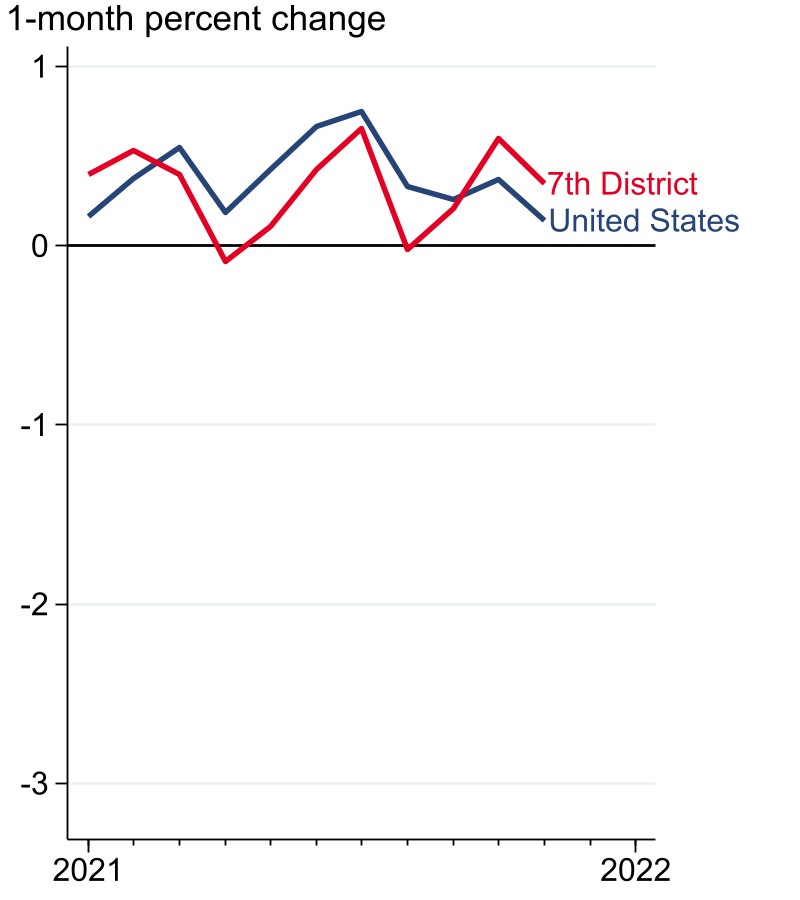
Source: Authors’ calculations based on data from the U.S. Bureau of Labor Statistics from Haver Analytics.
The employment experiences for individual states in the District are summarized in table 1 using an index where the employment level in February 2020 is equal to 100%. (This means all numbers in the table are a percentage of a place’s employment in February 2020.) The drop in employment from February to April 2020 was large everywhere, but Michigan’s was especially sizable. By January 2021, every District state was within 10 percentage points of its February 2020 level, and Illinois and Michigan were the two District states whose recoveries were slower than the nation’s. The pace of growth was slower everywhere in 2021, and as of November 2021, most District states’ recoveries were behind that of the nation—only Indiana’s index value was higher.
Why is the Seventh District’s employment recovery lagging that of the U.S. as a whole? We plan to explore this question in greater detail in future posts, but here we briefly discuss evidence for two general categories of explanations: 1) faster-changing cyclical factors, such as the pandemic; and 2) slower-changing structural factors, such as industry mix and demographics. At this point in the pandemic, it is likely both cyclical and structural factors are at play. On the cyclical side, the size of the drop from February to April 2020 is a strong predictor of where a state’s employment index stood in November 2021 (correlation coefficient of 0.7). To the extent that the size of the drop reflects differences in how much the pandemic has affected states’ economies, this relationship should fade as the pandemic fades. On the structural side, a state’s rate of growth from January 2015 to January 2020 is also a solid predictor of its employment index in November 2021 (correlation coefficient 0.5). We would expect the factors behind states’ long run pre-pandemic growth rates to play a larger role as the pandemic wanes and we return to pre-pandemic trends. The Seventh District’s employment drop at the beginning of the pandemic was a little larger than the nation’s, and its long run pre-pandemic growth rate was slower than the nation’s, so it makes sense that the District’s November 2021 index value is lower than the nation’s.
Table 1. Employment index for the U.S., Seventh District, and Seventh District states
percent, 100 = February 2020
| April 2020 | January 2021 | November 2021 | |
|---|---|---|---|
| United States | 85.3 | 93.6 | 97.4 |
| Seventh District | 83.8 | 93.2 | 96.2 |
| Illinois | 86.6 | 92.1 | 95.7 |
| Michigan | 76.3 | 91.1 | 95.2 |
| Indiana | 84.2 | 95.8 | 97.9 |
| Iowa | 88.8 | 95.2 | 96.8 |
| Wisconsin | 86.4 | 94.7 | 96.5 |
A tight labor market
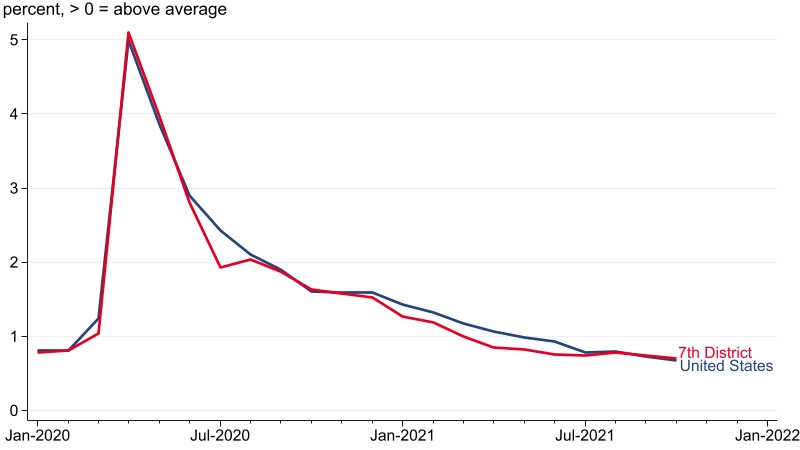
Let’s now turn to how two major storylines for the U.S. economy in 2021 played out in the Seventh District. The first is in the labor market, which tightened significantly through the year because the supply of workers did not keep up with strong growth in demand. The unemployment rate in the District was 6.4% in December 2020 but by November 2021, it had dropped to 4.7%. This occurred while there was little change in labor force participation: As of November 2021, the District’s rate was at 62.9%, still 1.7 percentage points below its 2019 average. One way to measure labor market tightness is to calculate the ratio of the number of unemployed workers to the number of job openings, a measure we show in figure 2 for the District and the U.S. The patterns for both are very similar: The District regained its pre-pandemic level in the spring of 2021 and the nation in mid-summer. By October 2021, the value for both the District and the nation was 0.7, which means there were seven unemployed workers for every ten job openings, a clear sign of a very tight labor market. Many openings and few available applicants means workers have greater leverage in wage negotiations, which led to a substantial increase in wage growth in the second half of 2021.
Figure 2. Unemployed-to-openings ratio
Supply chain headaches
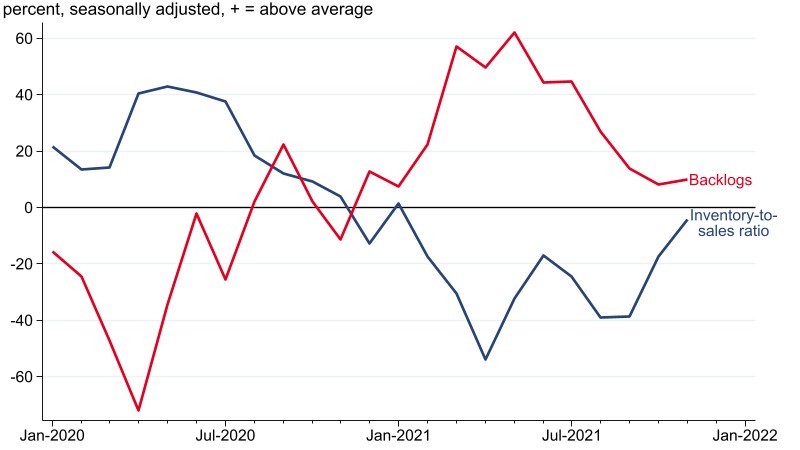
A second major storyline in 2021 was strong demand for manufactured goods in the face of limited supply. A number of factors contributed to the situation. First, financial support from the federal government sustained household incomes despite major employment losses, keeping overall consumption demand solid. Second, pandemic safety restrictions made it more difficult to consume services, leading to greater spending on goods. Third, strong demand for goods overloaded freight networks and, together with other Covid-related issues, pushed up shipping times. And fourth, as in many other industries, manufacturers have struggled to refill positions they eliminated at the beginning of the pandemic. So, after large declines in demand and production early in the pandemic, demand has come back quicker than production, resulting in inventory shortfalls and elevated backlogs among manufacturers. Figure 3 shows how this situation played out for manufacturers in the Seventh District based on results from the Chicago Fed Survey of Business Conditions (CFSBC). Inventories were especially low and backlogs especially high in the middle of 2021. The situation has moved closer to normal in recent months but has not fully unwound.
Figure 3. CFSBC indexes of manufacturers’ inventory-to-sales ratios and backlogs
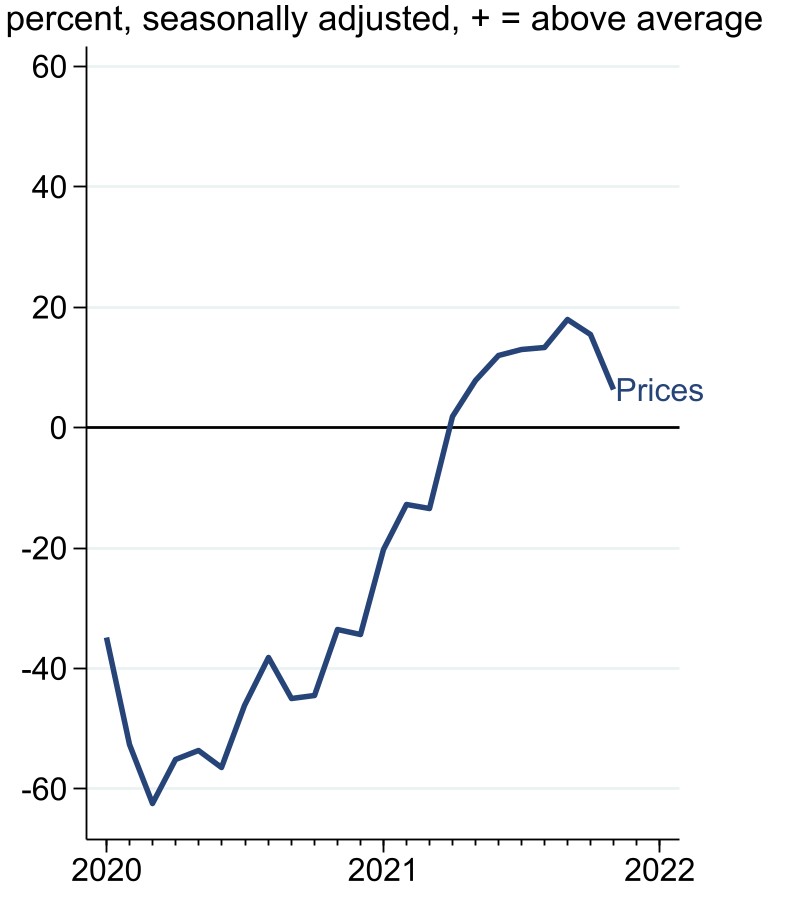
All told, limited supply of labor and materials has driven up wages and input costs across many sectors, not just in manufacturing. According to our CFSBC contacts, strong demand has allowed them to pass on some of the rising costs to their customers, leading to higher prices. As displayed in figure 4, our CFSBC indexes of prices and costs show that 2021 was a year of well above average increases.
Figure 4. CFSBC indexes of input costs and output prices
A. Input Costs
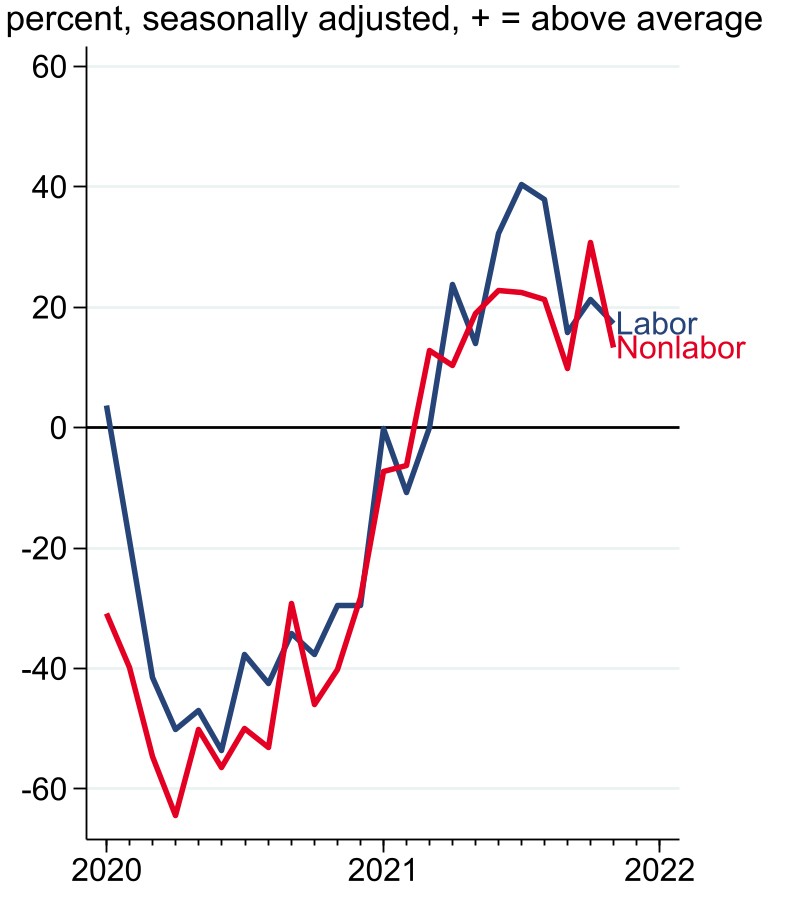
B. Output Prices
Conclusion
Although supply chain disruptions and lower labor force participation have slowed the recovery, growth in the Seventh District in 2021 was almost certainly well above trend—as it was in the entire U.S. The FOMC forecasted last December that growth should continue to be strong in 2022. Median GDP real growth projections stood at 4.0% for 2022, and the unemployment rate is expected to drop to 3.5% by the end of the year. Inflation is expected to ease. As in 2021, it is likely the Seventh District’s experience will be similar to the nation’s in 2022, but with a somewhat slower pace of GDP and employment growth, consistent with pre-pandemic trends.
Note
1 The Seventh Federal Reserve District (which is served by the Chicago Fed) comprises all of Iowa and most of Illinois, Indiana, Michigan, and Wisconsin. In this blog post, we analyze the entirety of each state in the District.


