

Growth in both the Seventh Federal Reserve District1 and the nation picked up in 2023—a development that surprised many forecasters. While employment growth for the Seventh District and the country as a whole was slower in 2023 than in 2022, the labor market remained tight.2 The Seventh District’s economy again grew more slowly than the nation’s, partly because of weak results for manufacturing, especially transportation equipment manufacturing. As of December 2023, the median Federal Open Market Committee (FOMC) participant expected national growth in gross domestic product (GDP) in 2024 to be positive, but below its long-run trend.
Growth in 2023 was better than expected
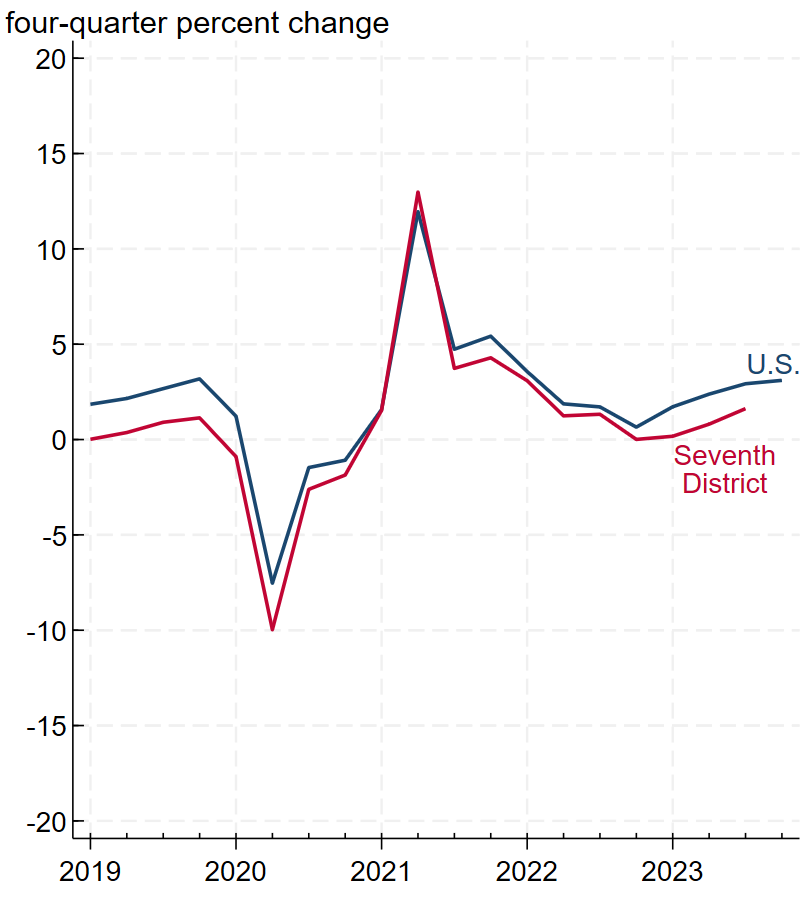
In our 2022 year in review, we noted that some observers—Blue Chip forecasters3 and Chicago Fed Survey of Economic Conditions (CFSEC) respondents among them—were predicting a recession in 2023 in light of high inflation and slowing growth in 2022. Thankfully, those forecasts didn’t turn out to be true. In fact, as panel A of figure 1 shows, U.S. real GDP growth was higher in 2023 (3.1%) than in 2022 (0.7%), while inflation fell (5.4% in 2022 versus 2.6% in 2023, according to the Price Index for Personal Consumption Expenditures (PCE) from the U.S. Bureau of Economic Analysis). We are still waiting for fourth quarter data to know what real GDP growth was for the Seventh District in 2023, but data for the first three quarters suggest that growth was stronger in 2023 than in 2022 for the District as well. Faster growth coupled with slower inflation coincided with improvements in supply-side indicators, including the labor force participation rate, labor productivity, and the New York Fed’s Global Supply Chain Pressure Index. While employment growth slowed in 2023 in both the U.S. and Seventh District, panel B of figure 1 shows that growth rates for 2023 were above their 2019 rates, indicating solid performances for the nation and the District. In terms of both real GDP and employment, the Seventh District’s economy once again grew more slowly than the nation’s in 2023, keeping up a long-run trend.
1. Year-over-year real gross domestic product (GDP) and nonfarm payroll employment growth in the U.S. and Seventh District
A. Real GDP
B. Employment
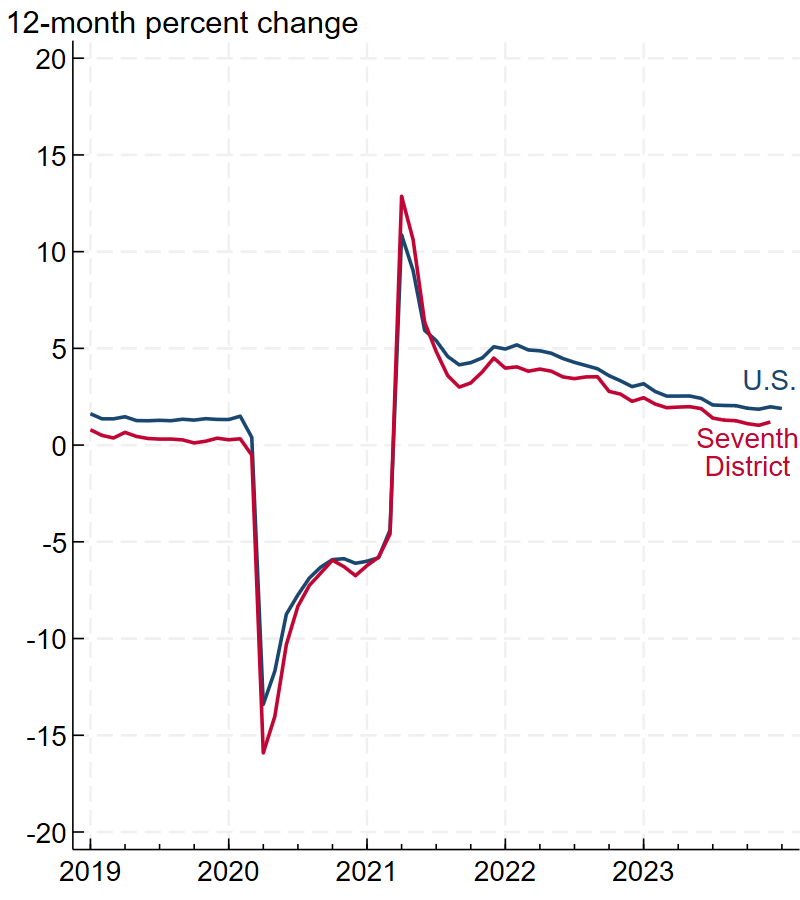
Sources: Authors’ calculations based on data from the U.S. Bureau of Economic Analysis and U.S. Bureau of Labor Statistics from Haver Analytics.
Manufacturing employment growth was slow in the U.S. and even slower in the Seventh District
One reason the Seventh District’s growth has been slower than the nation’s for so long is that it is concentrated in manufacturing—a sector whose growth has also been slower than the national average. This was again the case in 2023: While total U.S. employment grew by 2.0%, U.S. manufacturing employment grew by just 0.2%. On top of the Seventh District being concentrated in an industry that saw below-average growth in 2023, figure 2 shows that manufacturing employment grew slower in the Seventh District (–0.1%) than in the nation. To show what was behind the difference, figure 2 breaks down manufacturing employment growth by major subsectors. The primary reason the Seventh District lagged was weakness in transportation equipment manufacturing. The second row of figure 2 shows that Seventh District employment in transportation equipment fell by 1.0%, but U.S. employment in that subsector increased by 3.9%. This difference matters because the second row also indicates that transportation equipment is the largest manufacturing subsector in the Seventh District, constituting 17% of its total manufacturing employment (versus 13.7% in the nation’s total manufacturing employment). Transportation equipment’s large share means it subtracted 0.17 percentage points from the Seventh District’s manufacturing employment growth rate (see the fifth column of data). In contrast, strong employment growth in transportation equipment for the nation means the subsector added 0.53 percentage points to its growth rate (sixth column). The difference between transportation equipment’s contribution to employment growth for the Seventh District and its contribution for the nation more than covers the overall difference between the District’s and nation’s manufacturing employment growth rates. The Seventh District’s relative losses in the transportation equipment subsector were made up to some extent by faster employment growth in food products and a smaller decline in employment across a range of other subsectors (covered by the “all other” category in figure 2).
2. Employment growth by manufacturing subsector, December 2022–December 2023
| Growth rate | Employment share | Contribution to growth | ||||
|---|---|---|---|---|---|---|
| Seventh District | United States | Seventh District | United States | Seventh District | United States | |
| All manufacturing | –0.13 | 0.19 | 100.0 | 100.0 | –0.13 | 0.19 |
| Transportation equipment | –0.99 | 3.85 | 17.0 | 13.7 | –0.17 | 0.53 |
| Food products | 1.82 | 0.80 | 13.1 | 13.3 | 0.24 | 0.11 |
| Fabricated metals | 1.19 | 1.12 | 12.8 | 11.2 | 0.15 | 0.13 |
| Machinery | 0.17 | 1.25 | 12.0 | 8.7 | 0.02 | 0.11 |
| Chemicals | –0.69 | –0.90 | 4.8 | 7.0 | –0.03 | –0.06 |
| Primary metals | –0.64 | 0.30 | 3.2 | 2.9 | –0.02 | 0.01 |
| Printing | 0.33 | –3.94 | 2.5 | 2.9 | 0.01 | –0.12 |
| All other | –0.95 | –1.27 | 34.7 | 40.3 | –0.33 | –0.51 |
Notes: Seventh District data are the combination of state data for Illinois, Indiana, Iowa, Michigan, and Wisconsin. The growth rate and employment share values are in percent, and the contribution to growth values are in percentage points. The employment shares may not total to 100% because of rounding.
Source: Authors’ calculations based on data from the U.S. Bureau of Labor Statistics from Haver Analytics.
The Seventh District’s weak result for transportation equipment manufacturing in 2023 was not an anomaly. Figure 3 shows that during the past decade, the Seventh District states’ share of U.S. employment in this subsector peaked in 2017, took a major hit with the shutdown of the auto industry at the start of the pandemic, and then recovered quickly, but it started shrinking again in 2021. In October 2023, the share dropped especially quickly because the United Auto Workers (UAW) strike had a larger impact on the Seventh District than elsewhere, but it did bounce back somewhat when the strike ended. The downward trend since 2017 is a combination of the auto industry shifting to other parts of the country and faster growth in other transportation equipment manufacturing subsectors, particularly aerospace, which is not concentrated in Seventh District states. While 91% of the Seventh District’s transportation equipment manufacturing employment is in the auto industry, 58% of the nation’s is in auto, with another 30% in aerospace.
3. Seventh District share of U.S. transportation equipment manufacturing employment
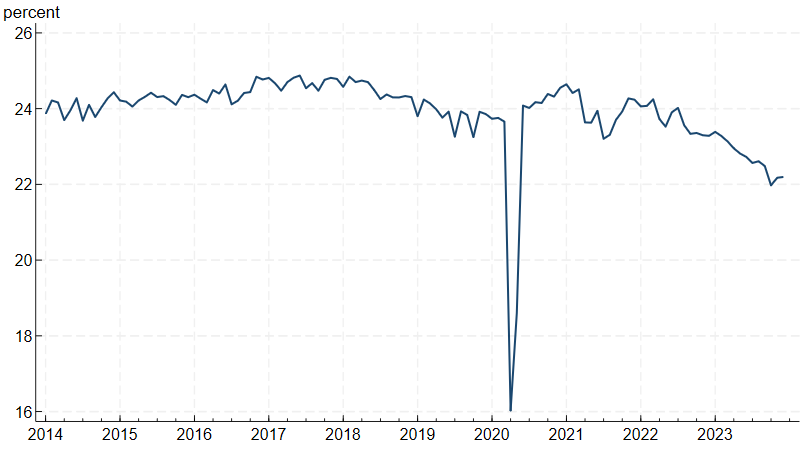
Source: Authors’ calculations based on data from the U.S. Bureau of Labor Statistics from Haver Analytics.
Growth is expected to be slower, but still positive in 2024
Real GDP growth was unexpectedly strong in 2023, but as of December 13, 2023, the median FOMC participant expected 2024 growth to slow as the federal funds rate4 remains above its projected longer-run level. Slower growth does not mean negative growth, though; and figure 4 indicates that the median FOMC forecast is for a 1.4% increase in U.S. real GDP in 2024. What does this mean for the Seventh District? Growth here is almost always positive when U.S. growth is, but 2024 will probably be another year where the District’s growth is slower than the nation’s.
4. Year-over-year real gross domestic product (GDP) growth in the U.S. and Seventh District: Actual and forecasted
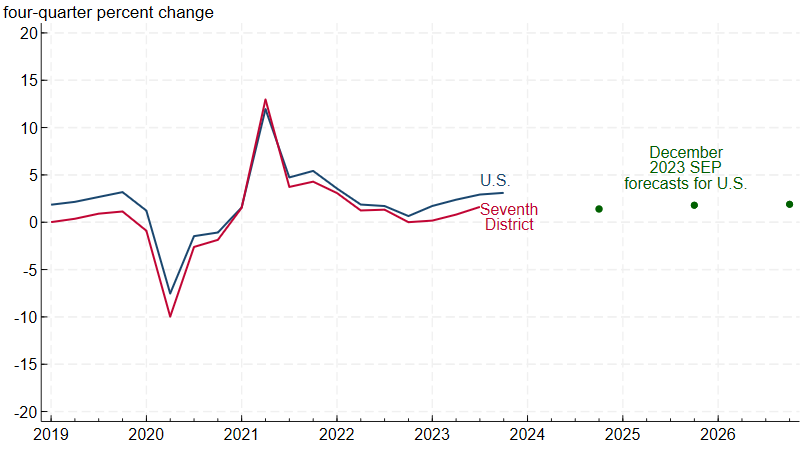
Sources: Authors’ calculations based on data from the U.S. Bureau of Economic Analysis from Haver Analytics; and the Federal Open Market Committee, December 2023 Summary of Economic Projections (SEP).
Notes
1 The Seventh Federal Reserve District (which is served by the Chicago Fed) comprises all of Iowa and most of Illinois, Indiana, Michigan, and Wisconsin. In this article, we analyze the entirety of each state in the District.
2 For more analysis, see Bognar et al. (2023).
3 Blue Chip forecasters refer to private sector forecasters who participate in Wolters Kluwer’s Blue Chip Economic Indicators survey.
4 The federal funds rate is the Fed’s traditional policy tool for changing the short-term nominal interest rate. It is the interest rate at which depository institutions lend reserve balances to other depository institutions overnight. For more information, see this primer.


