

This article examines how well the Chicago Fed Survey of Business Conditions (CFSBC) Activity Index does at predicting U.S. real gross domestic product (GDP) growth for the current quarter (nowcasting). It also compares the index’s nowcasting performance with those of other economic indicators.
The Chicago Fed Survey of Business Conditions is a survey of business contacts conducted to support the Seventh Federal Reserve District’s contribution to the Beige Book.1 The survey is conducted biquarterly and covers a number of topics, including demand for products and services, hiring, capital spending, and input costs. Respondents report how these aspects of their businesses have changed over the past four to six weeks (or are expected to change in the next six to 12 months) on a seven-point scale, ranging from increased substantially to decreased substantially. From these responses, Chicago Fed staff construct diffusion indexes that provide summary measures of their prevailing directions and magnitudes.2 The survey started in March 2013 (though its results were not regularly published until January 20163). So, while the survey is still fairly new, it has been running long enough now that I can begin to explore whether or not it can provide useful information on the current state of the U.S. economy.
In this Chicago Fed Letter, I investigate whether the headline diffusion index—the CFSBC Activity Index—is useful for nowcasting4 U.S. real GDP growth, which is widely viewed as the most comprehensive measure of the overall state of the U.S. economy.5 It is possible to nowcast real GDP growth because the CFSBC Activity Index is released more frequently than GDP data are (biquarterly versus quarterly) and the index reading comes out sooner after the end of a reference period (about two weeks versus four weeks later). If the CFSBC Activity Index reliably predicts GDP growth, it can offer useful information about the current state of the U.S. economy earlier than the official GDP release can.
In the next section, I show that over the span when readings of the CFSBC Activity Index are available, its movements are strongly related to U.S. real GDP growth. I then explore whether the index does better at nowcasting GDP growth than the Blue Chip Economic Indicators consensus nowcast.6 I also compare its nowcasting performance with those of similar survey-based indexes from the Institute for Supply Management (ISM) and other regional Federal Reserve Banks. I find that the CFSBC Activity Index does quite well at nowcasting real GDP growth in comparison with all of these measures—particularly in the middle of the quarter, when little of the underlying data used to calculate GDP growth are available.
How well does the CFSBC Activity Index track U.S. real GDP growth?
I first examine the historical relationship between U.S. real GDP growth and the CFSBC Activity Index. Figure 1 shows the two series together, with the real GDP growth rate represented by blue bars and the CFSBC Activity Index represented by an orange line. For this figure, I have rescaled the index so that it is in terms of real GDP growth (see figure 1’s notes for a description of how this is done). The CFSBC Activity Index tracks real GDP growth from 2013 through the present quite well: It does especially well at capturing the strong pickup in growth in the beginning of 2014 and the slow decline that started in the second half of 2014 and continued through the first quarter of 2016. The index is less volatile than real GDP growth, so while it usually is right about whether growth sped up or slowed down from quarter to quarter, it often understates the degree of the pickups and slowdowns. In figure 1, the average of the absolute differences between the CFSBC Activity Index and real GDP growth is 0.93 (when nowcasting, this average is known as the mean absolute error).
1. U.S. real GDP growth and the CFSBC Activity Index

Sources: Author’s calculations and U.S. Bureau of Economic Analysis data from Haver Analytics.
Comparisons with other survey measures
While it is clear from figure 1 that the CFSBC Activity Index is closely related to U.S. real GDP growth, there are many other economic indicators that also have this feature. So, does the CFSBC Activity Index provide any information about the current state of the economy that isn’t available from these other indicators? To investigate this, I compare the performance of the nowcast generated from the CFSBC Activity Index with that of the Blue Chip consensus nowcast, which is an average of nowcasts based on other economic indicators. For a fair comparison, it is important to align the information sets used for the CFSBC Activity Index and Blue Chip consensus nowcasts as closely as possible. Both nowcasts are revised as new information comes in—the CFSBC Activity Index’s because respondents’ respective average responses are updated each survey round7 and the Blue Chip consensus’s because new economic data are released on almost a daily basis. For example, it would be unfair to compare a nowcast based on the CFSBC Activity Index released in April with a Blue Chip consensus nowcast from February because the former would have two additional months of information available to it. The GDP growth data are also subject to revision, so for the sake of consistency, I will test how well the CFSBC Activity Index and Blue Chip consensus nowcasts do at predicting the initial release of a quarter’s real GDP growth.
Because the CFSBC Activity Index is released biquarterly, I make two comparisons for each quarter. The first comparison (in panel A of figure 2) is between the CFSBC Activity Index nowcast at the middle of a quarter and the Blue Chip consensus nowcast at the end of the second month of a quarter. So, for instance, I evaluate how well the nowcast from the CFSBC Activity Index released on November 30, 2016, and the consensus nowcast from the Blue Chip Economic Indicators released on December 16, 2016, do at predicting the fourth quarter of 2016’s real GDP growth rate, as released on January 27, 2017. The second comparison (in panel B of figure 2) is of the end-of-the-quarter nowcasts, which would be available one to three weeks before the initial official release of a quarter’s GDP growth.8
2. Nowcasts of U.S. real GDP growth
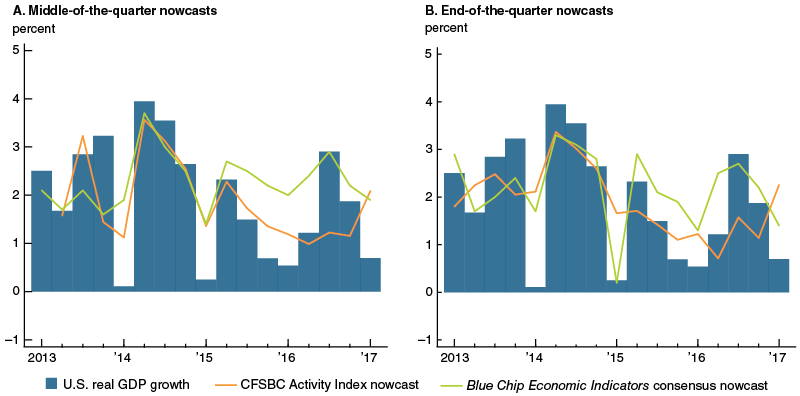
Sources: Author’s calculations and Wolters Kluwer and U.S. Bureau of Economic Analysis data from Haver Analytics.
The middle-of-the-quarter comparison shows that the CFSBC Activity Index and Blue Chip consensus nowcasts are quite similar until the third quarter of 2015, at which point the CFSBC Activity Index nowcast does a better job of tracking the moderation in real GDP growth. This pattern continues until the second half of 2016, at which point the Blue Chip consensus nowcast is closer to real GDP growth. Over the entire period of comparison, the CFSBC Activity Index nowcast’s mean absolute error is 0.68 and the Blue Chip consensus nowcast’s is 0.74. The end-of-the-quarter comparison indicates that the Blue Chip consensus nowcast does better overall than the CFSBC Activity Index nowcast (the former is helped in particular by its strong performance in the first half of 2015 and the second half of 2016). While the Blue Chip consensus nowcast’s mean absolute error is 0.57, the CFSBC Activity Index nowcast’s is 0.78.
My findings (which are certainly preliminary) show that the CFSBC Activity Index nowcast does better in the middle of a quarter and the Blue Chip consensus nowcast does better at the end of a quarter. These results are possibly due to the fact that by the end of a quarter, most of the underlying data used to calculate GDP growth have been released. Some of these underlying data are quite difficult to predict, so after their release, it is easier to predict what GDP growth will be. While the Blue Chip consensus nowcast incorporates new releases of underlying data, the CFSBC Activity Index nowcast does not because it is based on survey responses alone.
As a final assessment, I also consider whether the CFSBC Activity Index does a better job of nowcasting U.S. real GDP growth than indexes from similar surveys of business leaders. Figure 3 shows the mean absolute errors of the nowcasts generated from surveys conducted by the Institute for Supply Management and by other regional Federal Reserve Banks (it also includes the mean absolute errors of the Blue Chip consensus nowcast). For the period when readings for the CFSBC Activity Index are available, it is the top performer for middle-of-the-quarter nowcasts (figure 3, panel A) and the third-place performer for end-of-the-quarter nowcasts (panel B). The Blue Chip consensus nowcast is the best performer for end-of-the-quarter nowcasts.
3. Performance of nowcasts of U.S. real GDP growth by surveys of business leaders, 2013:Q1–2017:Q1

Sources: Author’s calculations based on data from the Institute for Supply Management (ISM), Wolters Kluwer, regional Federal Reserve Banks, and U.S. Bureau of Economic Analysis from Haver Analytics.
Conclusion
While the CFSBC is still fairly new, this article shows that its headline index—the CFSBC Activity Index—has done a very good job of tracking the performance of the U.S. economy so far. These results are unquestionably preliminary: There are not enough data to draw a strong conclusion about the CFSBC Activity Index’s nowcasting capability or to even seasonally adjust the index. That said, the index’s strong nowcasting performance to date suggests that its results are worth paying attention to.
1 Background information on the CFSBC is available at https://www.chicagofed.org/cfsbc. The Beige Book is a Federal Reserve System report describing current business conditions in each of the Fed’s 12 Districts (https://www.federalreserve.gov/otherfrb.htm) that is released to the public two weeks prior to meetings of the Federal Open Market Committee, the monetary policymaking arm of the Fed; for more information, see https://www.federalreserve.gov/monetarypolicy/beigebook/. The Seventh Federal Reserve District (which is served by the Chicago Fed) comprises all of Iowa and most of Illinois, Indiana, Michigan, and Wisconsin; for more details, see https://www.chicagofed.org/utilities/about-us/seventh-district-economy.
2 Notably, the CFSBC’s diffusion indexes are adjusted for inherent biases in measurement and interpretation because they are calculated based on whether survey participants’ answers are above or below their respective average answers. For a detailed description of the diffusion indexes, their properties, and their construction, see the article that introduced the CFSBC: Scott A. Brave, Thomas Walstrum, and Jacob Berman, 2015, “The Chicago Fed Survey of Business Conditions: Quantifying the Seventh District’s Beige Book report,” Economic Perspectives, Federal Reserve Bank of Chicago, Vol. 39, Third Quarter, pp. 77–89, https://www.chicagofed.org/publications/economic-perspectives/2015/3q-brave-walstrum-berman.
3 The public CFSBC results are available at https://www.chicagofed.org/publications/publication-listing?filter_series=19.
4 The term nowcasting is derived from combining the words now and forecasting. The aim of nowcasting is to predict the present (and recently past) values of standard measures of the economy (such as real GDP), which are released weeks or even months after the reference period.
5 Official GDP data are from the U.S. Bureau of Economic Analysis. While survey participants come only from states within the Seventh Federal Reserve District, my Chicago Fed colleagues and I have found that the CFSBC Activity Index does better at predicting U.S. real GDP growth than real GDP growth across Seventh District states. We believe that this is because many of our contacts come from businesses with a national or international client base.
6 For information on Blue Chip Economic Indicators consensus nowcasts and forecasts, visit https://lrus.wolterskluwer.com/product-family/blue-chip.
7 See the article referenced in note 2 for more details.
8 A preferable comparison would be to estimate the parameters of a nowcasting model using earlier (or in-sample) CFSBC Activity Index values and then to use later (or out-of-sample) CFSBC Activity Index values to test whether that model does better than the Blue Chip consensus nowcast at predicting real GDP growth. Unfortunately, at this point, the CFSBC Activity Index has too few observations to perform such a test.


