The relationship between tariffs and employment remains a point of debate among policymakers. Proponents of tariffs claim that protecting domestic industries from foreign competition preserves and creates jobs at home. According to this view, when domestic industries are protected from cheaper imports, they can maintain or expand their operations, potentially increasing hiring both in these protected industries and in related sectors along the supply chains.
Critics, however, argue that tariffs can reduce employment. They point out that many domestic companies rely on imported materials and components for their production processes. When these imports become more expensive because of tariffs, input costs rise, potentially forcing businesses to reduce their workforce or pass on costs to consumers in the form of higher prices. Tariffs can also act as an aggregate demand shock, resulting in decreased employment due to lower consumer demand for goods. Ultimately, evaluating whether tariffs increase or decrease the number of jobs domestically requires empirical evidence.
In this article, we examine how the 2025 U.S. tariffs affected employment growth through two channels: increased input costs and industry protection from foreign competition. First, we examine how tariff-induced increases in input costs relate to payroll employment growth. Second, we develop a measure of industry protection from tariffs and assess its relationship to employment growth. Our approach relies on comparing industries that are more exposed to tariffs with those that are less, and therefore, it is unlikely to isolate the aggregate demand channel.
To study the tariffs’ impacts on employment growth, we first combine monthly survey data from the U.S. Bureau of Labor Statistics’ (BLS) Current Employment Statistics (CES) program, annual data from the U.S. Bureau of Economic Analysis’s (BEA) supply-use tables and import matrices from the U.S. Input-Output Accounts, and monthly data from the U.S. Census Bureau on import duties and values (primarily made up of U.S. customs data).1 After merging these data sets, we estimate the relationship between tariff-induced change in input costs (expressed as a share of an industry's total input costs) or industry protection (measured as a commodity's import penetration share weighted by its effective tariff rate) and changes in industry employment growth. We control for each industry’s 2019–23 share of foreign-born workers because concurrent immigration policy changes may have independently affected industries that have historically employed more foreign-born workers (see, e.g., Butcher and García-Jimeno, 2025).
We find that tariff costs and tariff protection are both concentrated in manufacturing industries. Despite the variation in tariff exposure across different industries, we find weak evidence that either tariff-induced input costs or tariff protection significantly affected employment growth in the short run.
The 2025 U.S. tariff costs: Timing and affected industries
Our first measure of tariff exposure is industry tariff costs—calculated as a percentage of all intermediate input costs for an industry.2 To calculate tariff costs, we compute the effective tariff rate for a commodity by dividing the calculated duty (from monthly U.S. customs data) by the import value of that commodity. We then apply the effective tariff rate to the 2024 BEA use and import data by calculating the share of an industry's imports subject to this tariff rate and expressing that share as a percentage of all inputs. Specifically, for a commodity c, we calculate the following:
where τ is the effective tariff rate for commodity c that varies by month t.3
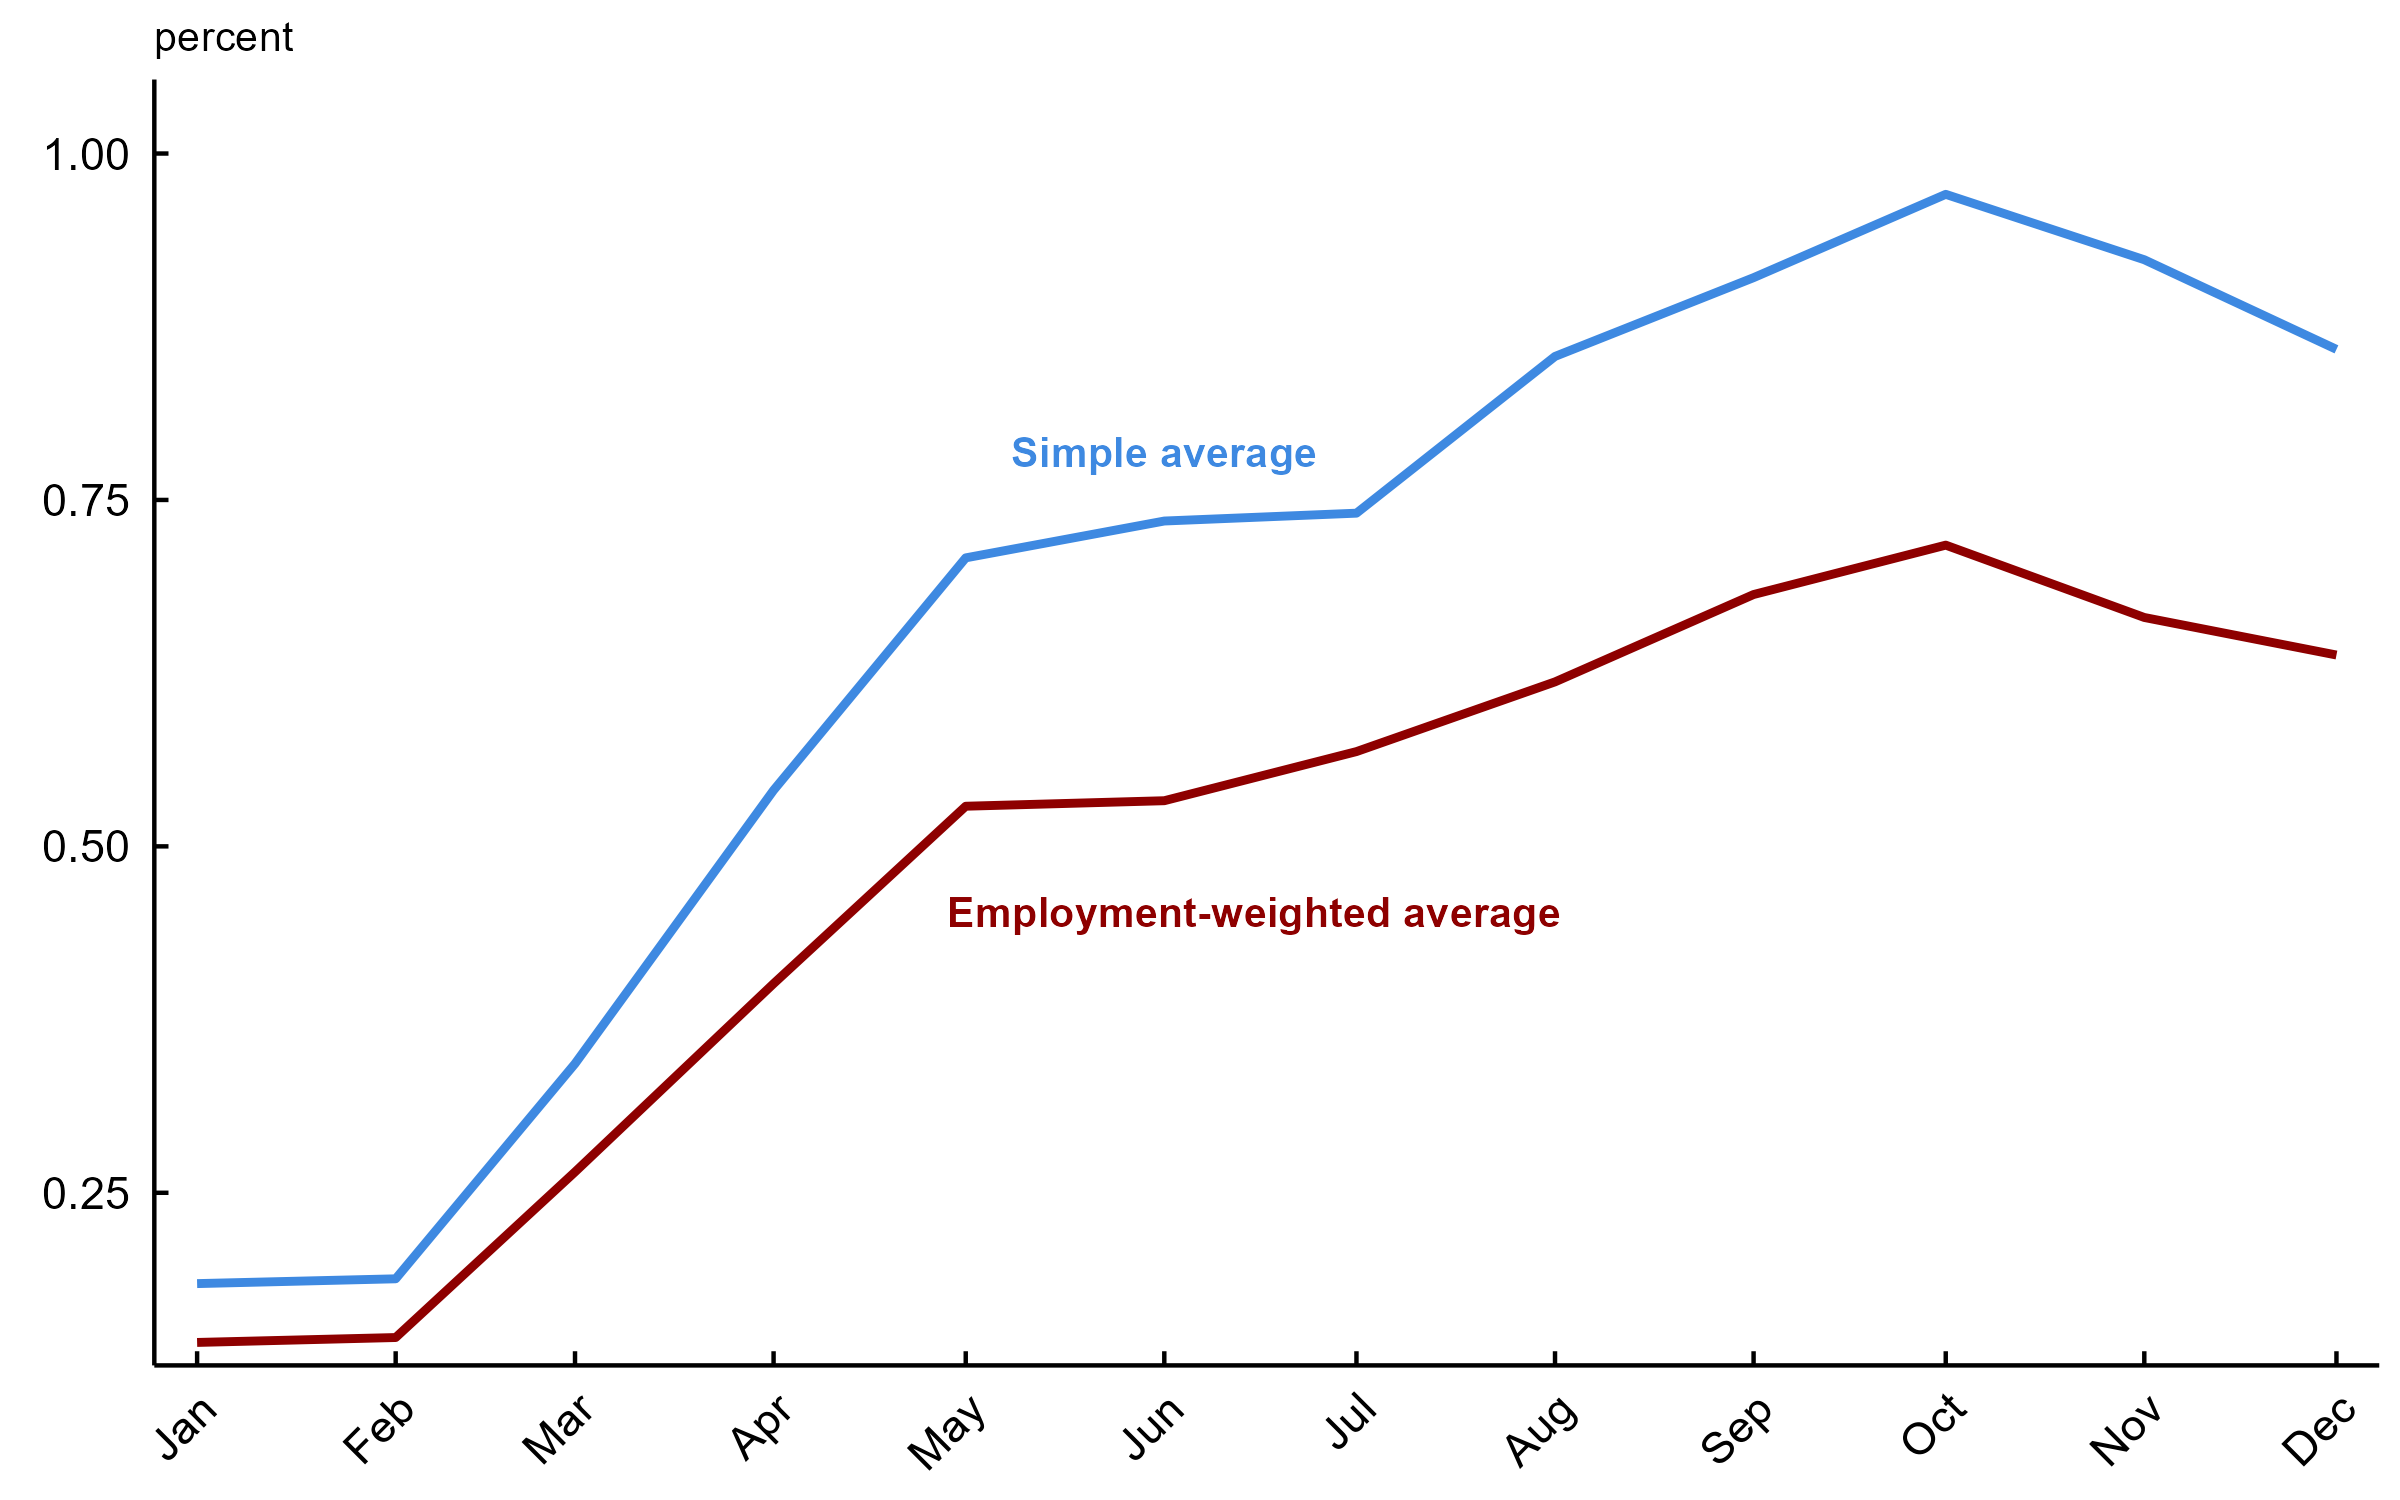
Figure 1 plots average tariff costs across all industries for each month in 2025. The figure shows that industry-employment-weighted average tariff costs and simple average tariff costs follow similar patterns. Tariff costs began to increase in March 2025 and remained elevated through December 2025. For the purposes of this article, we define March through December as the period when the 2025 tariffs were in force and use the simple average tariff costs for each industry over those months to estimate the effect of tariffs.
1. Average tariff costs across all industries, by month, January–December 2025
Sources: Authors’ calculations based on data from the U.S. Bureau of Labor Statistics, U.S. Bureau of Economic Analysis, and U.S. Census Bureau.
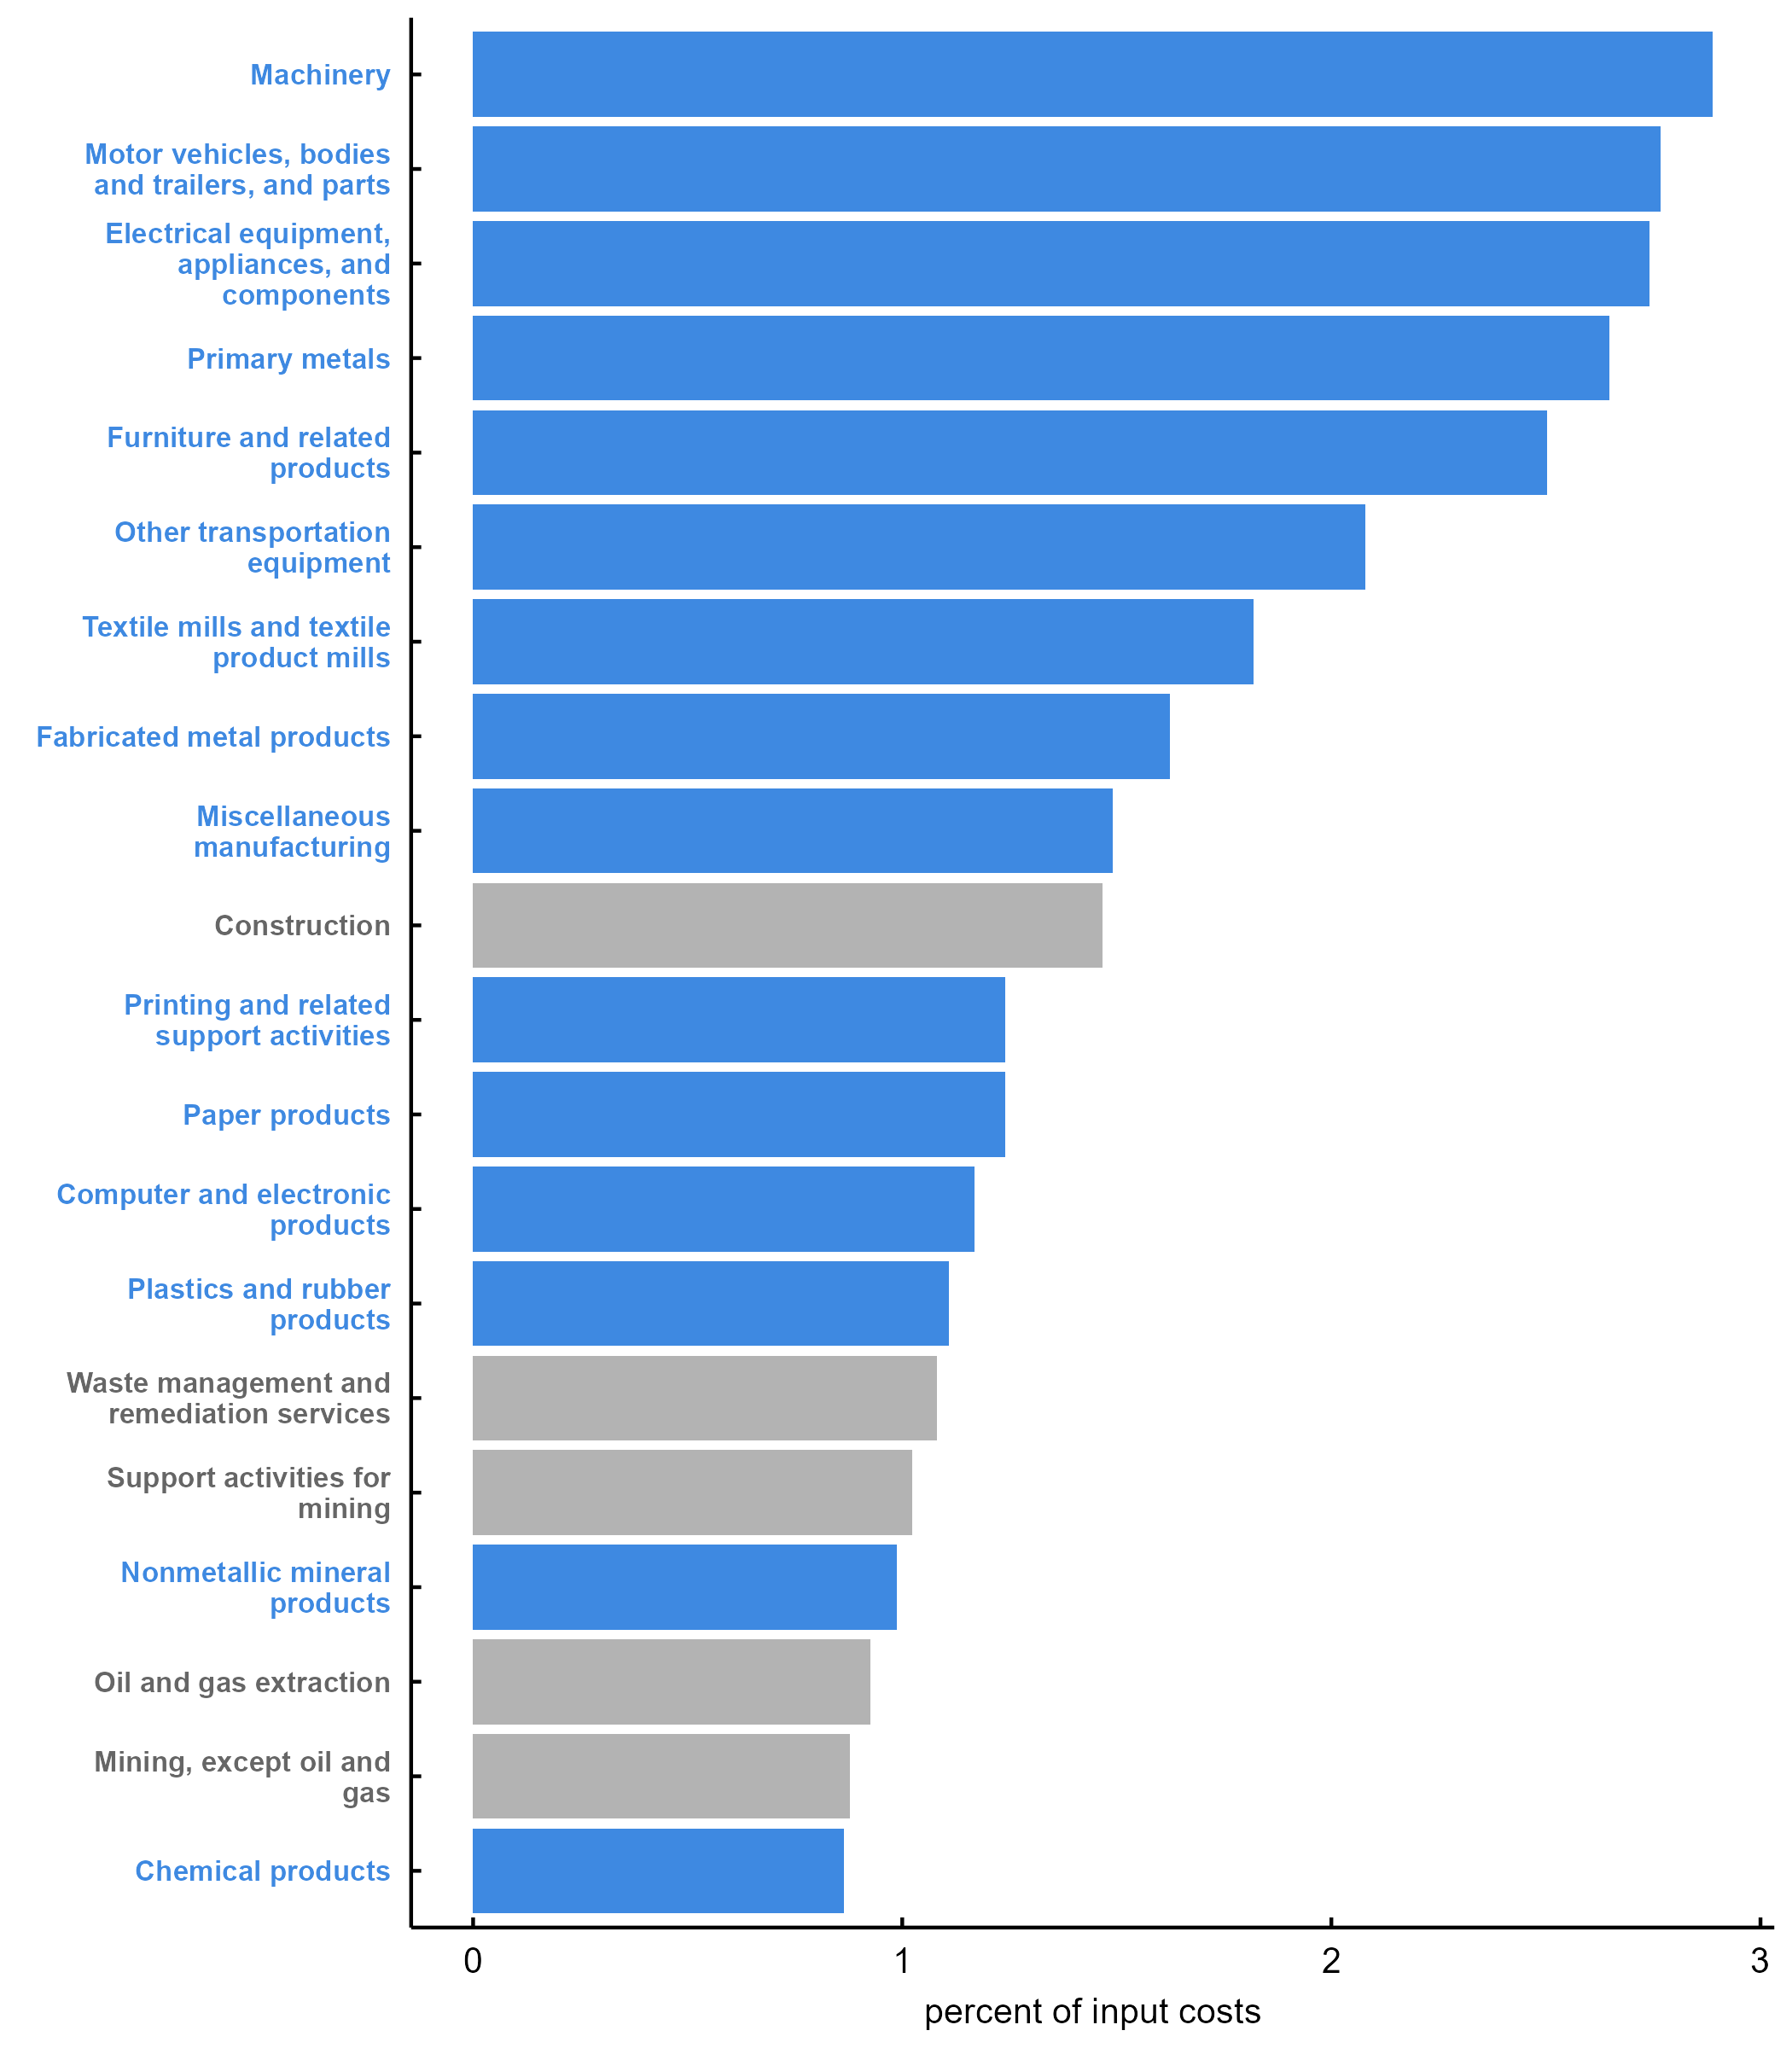
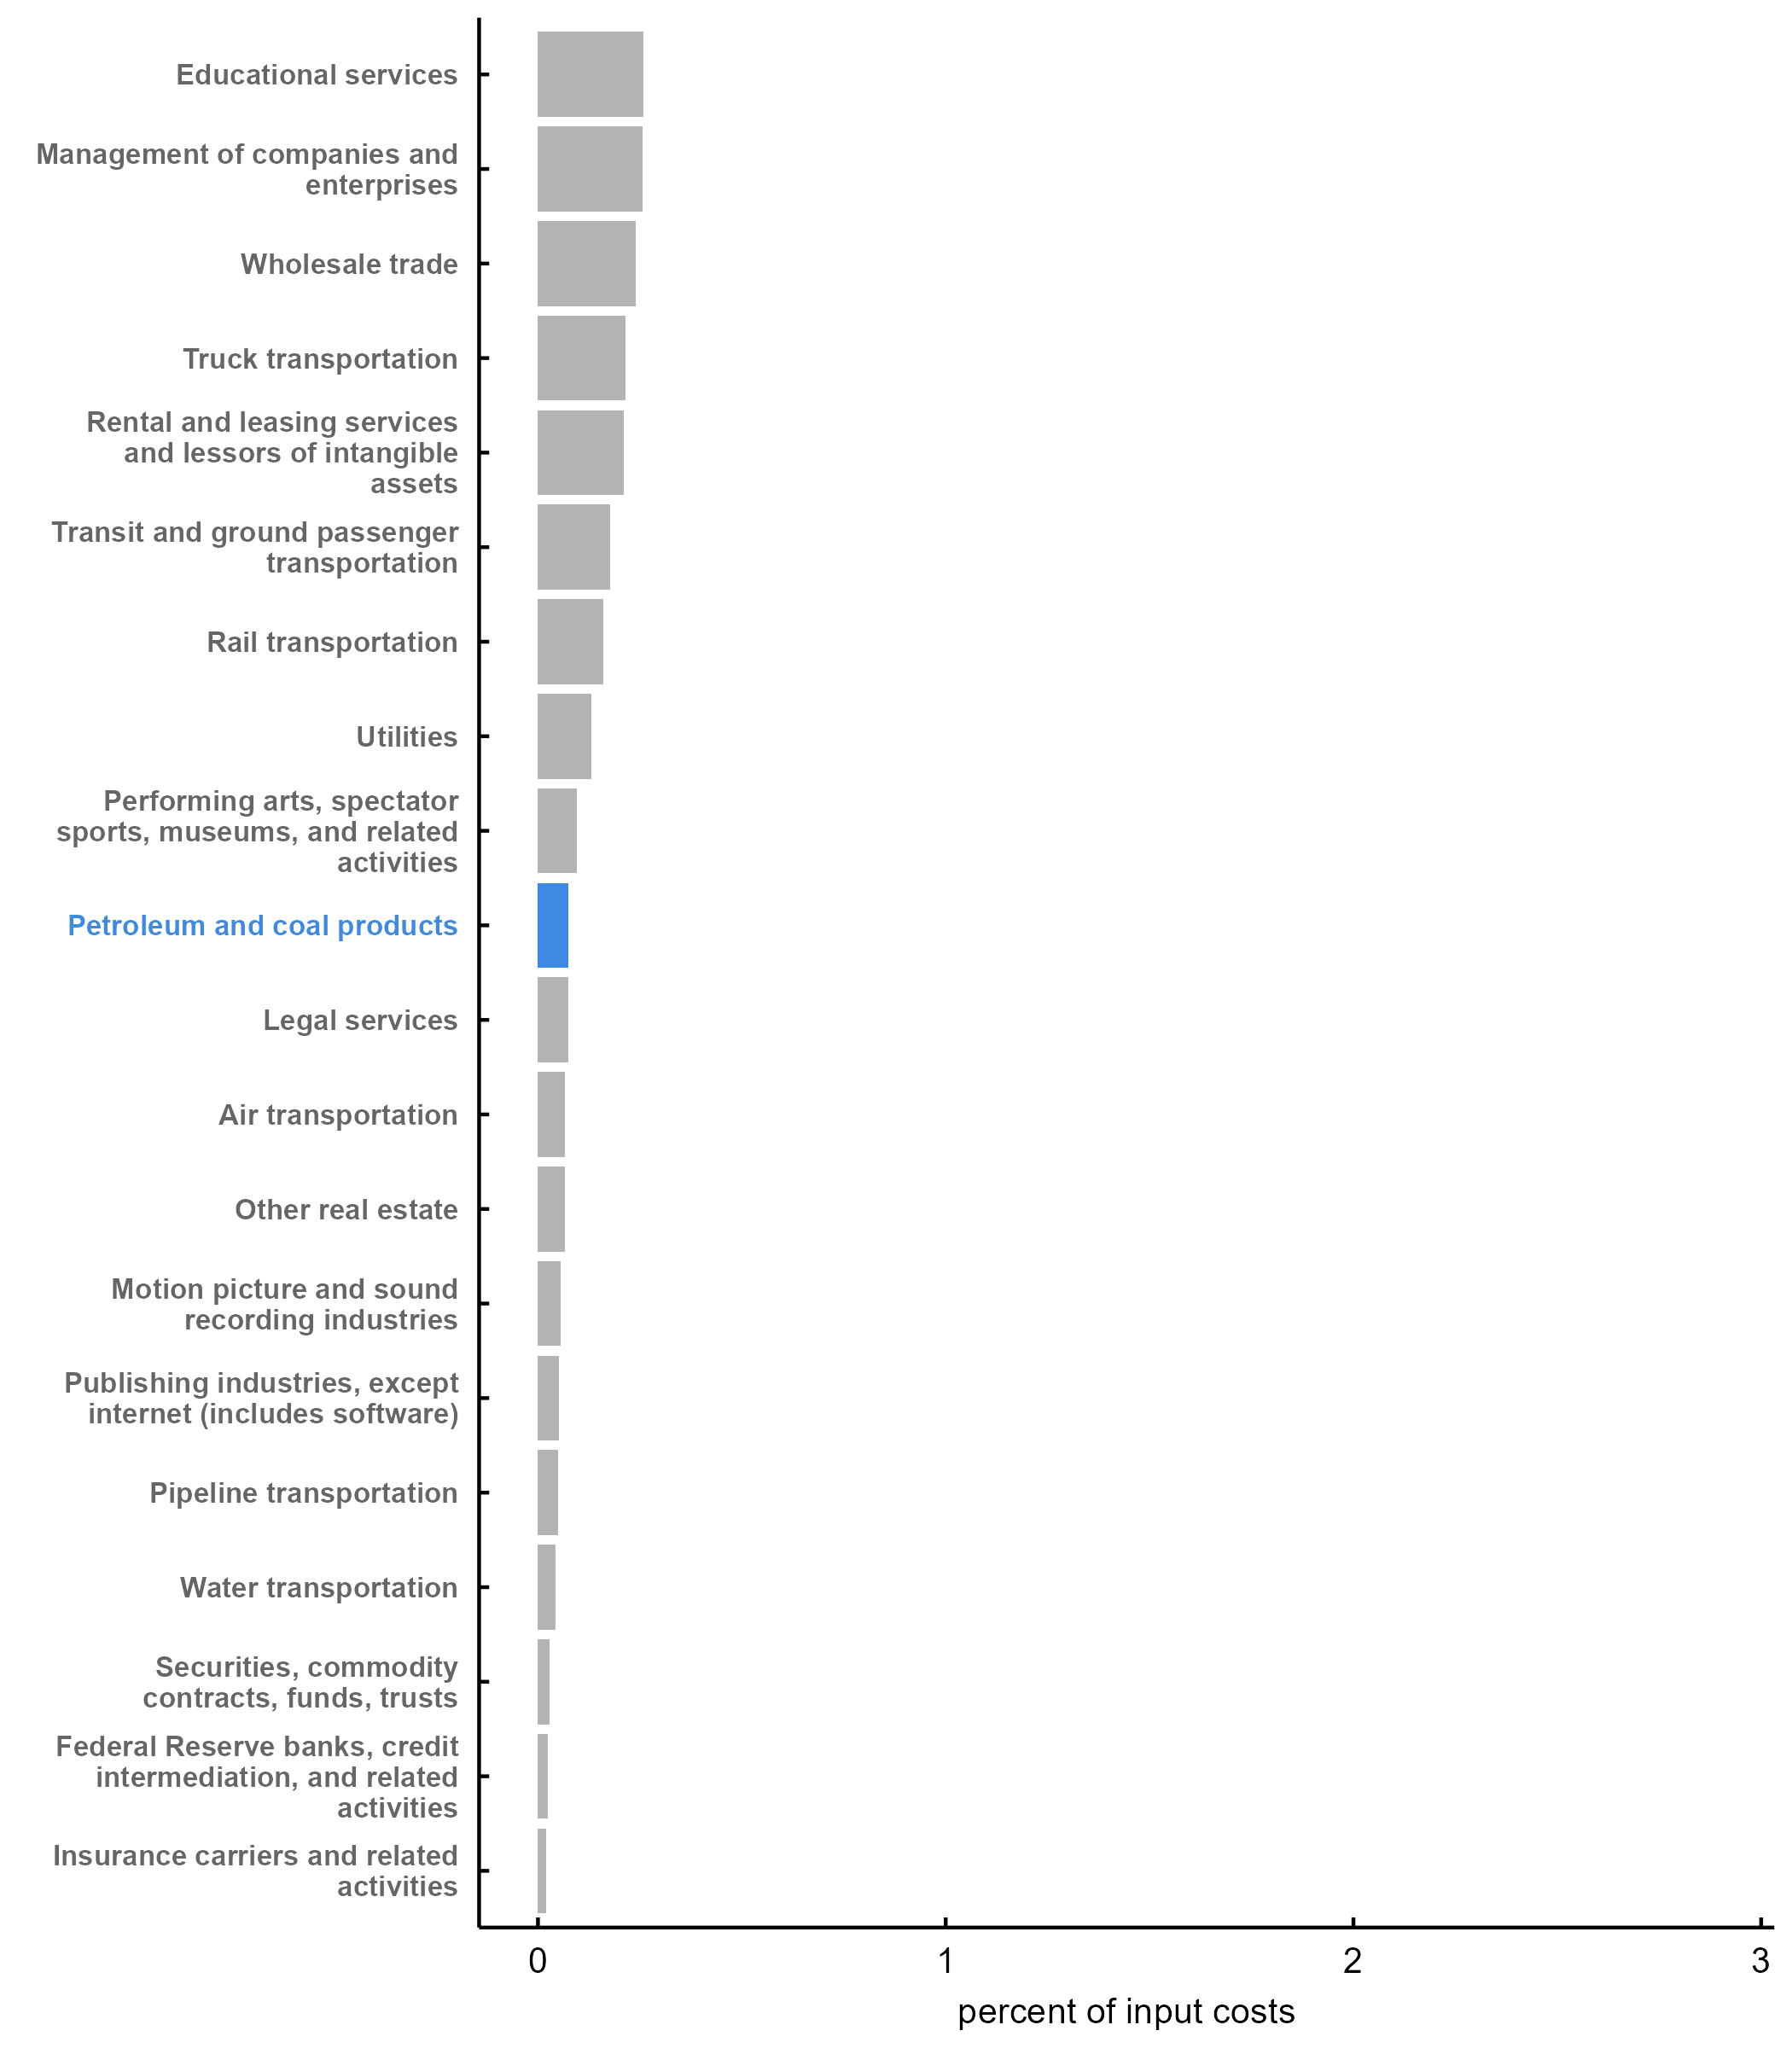
Figure 2 plots the average tariff costs over the months March–December 2025 by industry. Panel A shows the 20 industries most exposed to tariff costs, while panel B shows the 20 industries least exposed.4 For the most part, tariff costs are highest in manufacturing industries (denoted with blue bars): Of the 18 manufacturing industries we study, 15 of them appear in panel A of figure 2.5
2. Average 2025 tariff costs, by industry, March–December 2025
A. Top 20 industries, by tariff costs
B. Bottom 20 industries, by tariff costs
Sources: Authors’ calculations based on data from the U.S. Bureau of Labor Statistics, U.S. Bureau of Economic Analysis, and U.S. Census Bureau.
Which industries are protected by the 2025 tariffs?
In addition to analyzing how tariffs increase production costs, we examine whether tariffs support employment by protecting domestic industries from foreign competition.
To measure this protection, we construct an industry-level protection exposure. For each commodity c, we first calculate its import penetration ratio (πc): the share of domestic consumption met by imports rather than domestic production. We obtain this by taking the total domestic use of each commodity from the BEA use table and subtracting exports and inventory changes, which gives us the amount available for domestic consumption. We then divide imports by this domestic consumption measure.
Next, we multiply each commodity's import penetration ratio by its effective tariff rate (τc,t) to capture how much protection the tariff provides. A high tariff on a heavily imported commodity provides substantial protection; a high tariff on a rarely imported commodity does not.
Specifically, for a commodity c, we calculate the following:
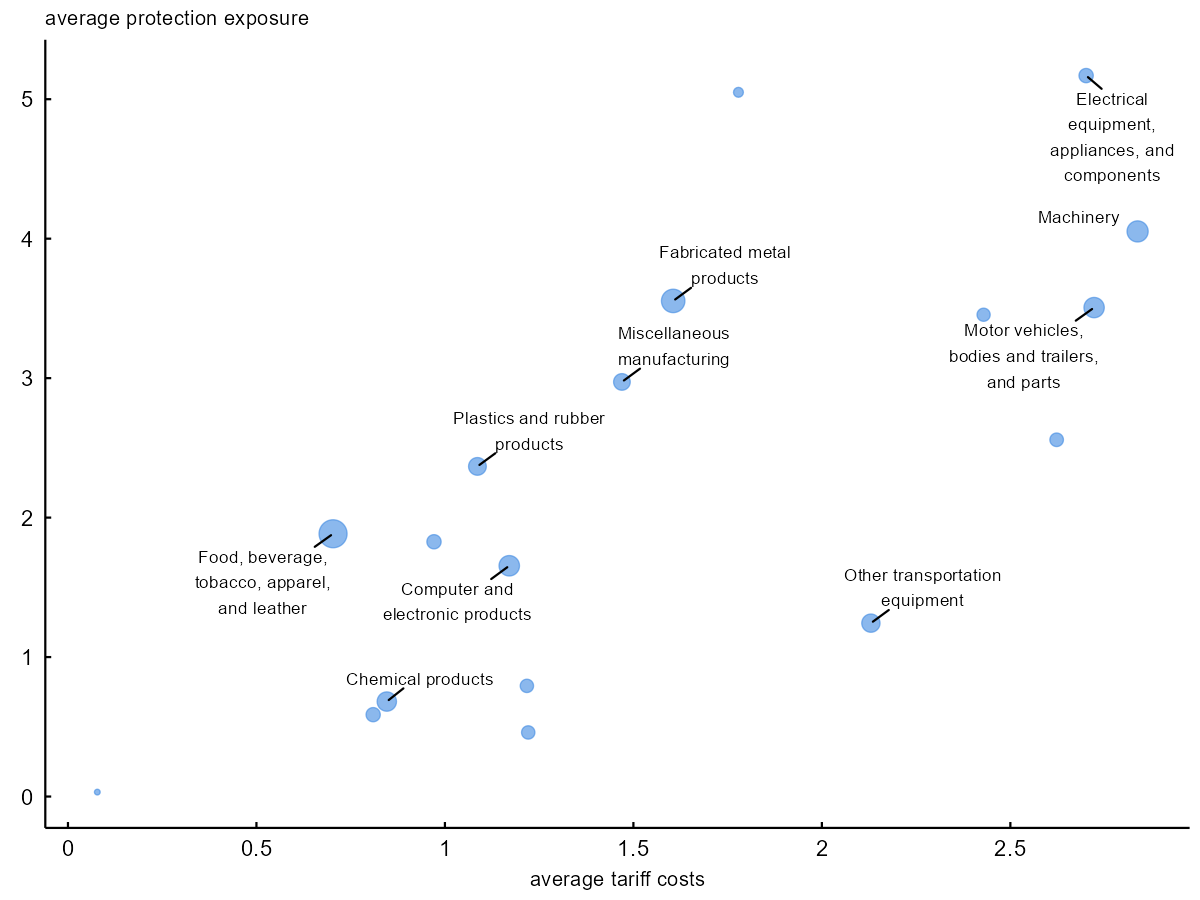
Tariff costs and protection are related, but they measure different aspects of tariff exposure. Tariff costs capture how much an industry pays for tariffed imported inputs, while protection exposure captures how much domestic producers are shielded from tariffed imported products that compete with their output. Many manufacturing industries experience both tariff effects channels simultaneously—they may rely on imported inputs that become more expensive as a result of tariffs, while they also produce goods that compete with imports subject to those same tariffs. This explains why tariff costs and protection tend to be positively correlated, as shown in figure 3.6
3. Average tariff protection exposure versus average tariff costs for manufacturing industries, March–November 2025
Sources: Authors’ calculations based on data from the U.S. Bureau of Labor Statistics, U.S. Bureau of Economic Analysis, and U.S. Census Bureau.
Notably, the two measures are not perfectly correlated: Some industries face high tariff costs but receive little protection, while others receive protection without bearing significant tariff costs.
Methods
We use an empirical model to estimate the effect of tariffs on employment. The model relates the change from March 2025 onward in average industry tariff costs and protection exposure (i.e., excess tariff costs and excess tariff protection) to excess employment growth. Excess employment growth is calculated as the difference between the average month-to-month employment growth rate in April–December 2025 and the average month-to-month employment growth rate in November 2024–March 2025. The difference between these two averages reveals whether employment growth accelerated or slowed relative to the pretariff trend.
We estimate the following regression model,7 weighted by each industry's (i) average 2024 employment:
Both excess tariff costs and excess tariff protection are calculated as the difference between their average over the months March–November 2025 and their average over the months October 2024–February 2025.8
The parameters of interest are
- b, which represents the relationship between the change in tariff costs and excess employment growth, holding protection and foreign-born share (share FBi) constant, and
- c, which represents the relationship between the change in the protection measure and excess employment growth, holding costs and foreign-born share constant.9
We control for each industry’s share of foreign-born workers over the period 2019–23 (measured using the U.S. Census Bureau’s American Community Survey, or ACS) to account for concurrent immigration policy changes that may have independently affected employment in industries with historically higher concentrations of foreign-born labor.
We weight by industry employment to give more influence to industries employing more workers, making our estimates more representative of a typical worker's experience and use robust standard errors to account for nonconstant variance of the error term (see note 9) across industries.
We estimate this model both economy-wide and restricted to manufacturing industries only, given they are where the tariffs’ impacts are concentrated.
Results
The results from estimating the regression equation from the previous section are reported in figure 4.
4. The estimated relationship between excess tariff costs, excess tariff protection, and employment growth
| All industries | Manufacturing | |
|---|---|---|
| Excess tariff costs | –0.010 (0.073) |
–0.150 (0.198) |
| Excess tariff protection | 0.032 (0.032) |
0.139 (0.113) |
| Share of foreign-born workers | 0.541 (0.371) |
0.287 (0.537) |
| Constant | –0.131** (0.056) |
–0.129 (0.150) |
| Number of observations | 57 | 18 |
| 0.047 | 0.225 | |
| Adjusted | –0.007 | 0.059 |
Figure 4 shows the results for all 57 industries in the first column of data and the results restricted to manufacturing industries in the second column. The estimates reveal no statistically significant relationship between tariff costs or protections and employment growth.
The manufacturing-only analysis in the second column, however, reveals an interesting pattern. Though the point estimates remain imprecise, they suggest some offsetting effects between tariff costs and protections. Specifically, tariff costs are associated with employment declines, while tariff protections are associated with employment gains. These forces are similar in magnitude: A one-unit increase in tariff costs corresponds to roughly a 15 percentage point decrease in employment growth, whereas a one-unit increase in tariff protection corresponds to about a 14 percentage point increase. Translating these magnitudes to jobs implies that a 1 percentage point increase in tariff costs corresponds to about 985 jobs lost, on average, per month in manufacturing; the same increase in tariff protection corresponds to about 1,066 jobs gained per month. This offsetting pattern likely reflects the high correlation between tariff costs and protections: Industries receiving tariff protections simultaneously face rising input costs from tariffed materials, creating downward pressure on employment that counterbalances any protective benefits.
Conclusion
In this article, we examined whether the 2025 tariffs affected U.S. employment growth over the short run through two potential channels: by raising input costs (which could reduce employment) and by protecting domestic industries from foreign competition (which could increase employment).
We find no statistically significant relationship between either tariff costs or protection exposure and industry employment growth during 2025. This absence of a clear relationship holds both economy-wide and when we focus specifically on manufacturing industries, where tariff impacts were concentrated last year.
These results contrast with simulation-based predictions, such as those in Paulson et al. (2025), which forecasted that 2025 tariffs would increase manufacturing employment within the first year through protection effects. Several factors may explain why we do not observe these predicted effects in the data.
First, offsetting forces may be at work. Because tariff costs and tariff protection are highly correlated, industries receiving tariff protection may simultaneously face rising input costs from tariffed materials, creating downward pressure on employment that offsets any protective benefits, resulting in little net change.
Second, our analysis captures only short-run responses. Employment adjustments may take longer to materialize than the sample period we examine, particularly if firms initially respond to tariffs by adjusting hours, overtime, or the number of temporary workers before making permanent hiring decisions.
Third, our measurement approach makes several simplifying assumptions that may affect our ability to detect employment effects:
- Fixed input and import shares. We hold the composition of each industry's inputs and the share coming from imports constant at their 2024 levels. Firms may substitute toward domestic or nontariffed inputs when tariffs rise, which would change both their effective tariff exposure and their need for labor adjustments.
- No export channel. Our analysis does not account for potential retaliatory tariffs on U.S. exports, which could reduce employment in export-oriented industries and offset potential protective benefits.
- Measurement error. “Crosswalking” trade data, reported in Harmonized System (HS) codes, to employment data, reported in the North American Industry Classification System (NAICS) codes, via BEA commodity classifications introduces potential misclassification that could attenuate our estimates.
- Aggregate demand channel. The analysis relies on comparing employment growth in more-tariff-exposed sectors and less-tariff-exposed sectors to their pretariff employment trends and is therefore not likely to pick up aggregate demand effects of tariffs.
As more time passes, longer-term analyses may provide clearer evidence on whether these tariffs ultimately affected job growth. For now, the short-run data reveal neither the clear employment gains that tariff proponents anticipated nor the significant job losses that critics feared.
Appendix: Data construction and industry classification
We conduct the analysis at approximately the BEA summary level, which roughly corresponds to the three-digit NAICS industry level, allowing us to merge our various data sets. The industry level is nearly but not exactly the summary level because a few payroll series include more than one BEA summary industry, and we aggregate those industries in our analysis accordingly.
Employment data. The seasonally adjusted monthly payroll data come from the BLS Current Employment Statistics survey data for November 2024 through December 2025 and are reported at the three- or four-digit NAICS level. The CES also includes information on average hourly earnings and work hours, but only for a subset of industries. Using a crosswalk provided by the BEA, we map BEA summary-level industries to 2017 NAICS codes. A separate crosswalk maps 2017 NAICS codes to the 2022 NAICS codes currently used by the BLS.
Foreign-born worker share. The share of foreign-born workers is calculated using the 2023 five-year estimates from the American Community Survey. The ACS indnaics variable (which approximates but does not precisely follow the standard NAICS format) was manually aligned to the appropriate BEA summary-level industry using the NAICS-to-BEA crosswalk as a reference.
Tariff costs. Tariff costs are calculated by combining three data sources: 1) the 2024 BEA use table, which provides information on an industry's use of commodities; 2) the 2024 BEA import matrix, which shows imports by industry; and 3) U.S. Census Bureau data (based on U.S. customs data and other sources) detailing calculated import duties at the ten-digit Harmonized System (HS10) goods level. A crosswalk provided by the U.S. Census Bureau here (under Concordance, then Imports, and then Codes, click 2025) allows us to map HS10 goods to NAICS codes, which we then map to BEA summary-level categories using the NAICS-to-BEA crosswalk.
To calculate tariff costs, we first compute the average effective tariff rate for each BEA summary-level commodity by dividing the calculated duty for that commodity by its total import value. We then calculate each industry's tariff-induced input costs as the sum of its imported inputs weighted by their respective effective tariff rates, expressed as a share of the industry's total input costs.
Notes
1 The specific time series data we use from the U.S. Census Bureau is called Monthly U.S. Imports by Harmonized System (HS) Code, which is available among its international trade data sets.
2 These input costs come from the commodity rows of the BEA’s summary-level use table (under the BEA’s supply-use framework). The primary rows indicate intermediate commodity and service inputs across industries. We do not include compensation of employees in the tariff cost denominator.
3 Note that this equation has a similar structure to a shift-share expression: τ is the time-varying shifter multiplying the time-invariant total inputs (and time-invariant import share) of an industry.
4 In total, we study employment in 57 industries based on three-digit North American Industry Classification System (NAICS) industries “crosswalked” to BEA summary-level industries; see the data appendix for details.
5 The fact that manufacturing is highly exposed to tariffs was also highlighted in the short-run employment analysis conducted by Bangert-Drowns (2025).
6 Tariff protection exposure is close to zero for almost all nonmanufacturing industries because the U.S. Census Bureau’s crosswalks end up mapping nearly all imported products in the U.S. customs data as outputs of manufacturing industries; see the appendix for details.
7 A linear regression is a statistical process that measures the degree of correlation between two variables—an independent (predictor) variable and a dependent (response) variable—while holding constant the other independent variables; the estimated coefficient from a regression represents the mean change in the dependent variable for a one-unit change in the independent variable.
8 We define the tariff period for average tariff rates as the months March–November 2025, thereby allowing for a one-month lag in employment's response to tariff changes.
9 Note that a is the intercept (the value the model predicts for the outcome when all the input variables are zero); d represents the relationship between the change in an industry’s foreign-born share and excess employment growth, holding costs and the protection measure constant; and ui is the error term, which captures the random variation, unmeasured factors, and imperfections that are left out by the regression model's predictors (see note 7).