

The following publication has been lightly reedited for spelling, grammar, and style to provide better searchability and an improved reading experience. No substantive changes impacting the data, analysis, or conclusions have been made. A PDF of the originally published version is available here.
A six-car collision on Tampa’s two-lane Howard Frankland Bridge—the locals call it the “Frankenstein”—causes a three-hour traffic jam during rush hour. A dam bursts near Toccoa, Georgia, killing 39 residents—mostly children—of a tiny Bible college. A bridge collapses on Interstate 95 in Connecticut, hurling six people into the river some 75 feet below, killing three and injuring several others.
Such accidents and disasters happen almost daily in the U.S. They are outward signs of a growing affliction—the decay of our national infrastructure. But not only safety and convenience are affected. There are deeper implications of this national neglect for the health of the U.S. economy. Indeed, as Bill Clinton, governor of Arkansas, recently wrote, “America is falling apart, literally. Federal budget pressures and changes in the Federal tax law in the 1980s have steepened a decline in public works spending that dates to the 1950s.”1
This Letter looks at recent trends in public works expenditures and relates the falloff in such spending with the productivity slowdown that became evident in the U.S. around 1970. The decline in public capital spending—on dams, highways, sewers, mass transit, etc. —relative to employment and private investment in plant and machinery forces private business to absorb higher costs, and thereby lowers productivity. And lower productivity, sooner or later, means a lower standard of living.
A stronger commitment to America’s infrastructure by the public sector is necessary for at least two reasons. First, a well-maintained public works system contributes to an expanding, robust economy. Second, directly and indirectly, it contributes to an improved standard of living.
A checkup
On the basis of most external appearances, the economy’s health is robust. We are experiencing an expansion of output that is progressing into its sixth year; economists are raising their forecasts for this year’s growth rate of gross national product (GNP); we see surging employment and a declining unemployment rate. To be sure, we see some threats of inflation, but not the inflation fever of other periods.
A complete physical examination, however, produces evidence of economic atrophy. The growth of output that is not explained by increases in labor and private capital inputs—generally called “total factor productivity”—has slumped during the last decade and a half. Indeed, the annual growth rate of total factor productivity in the private business economy has plummeted from 1.5% from 1951 to 1960 and 1.8% from 1961 to 1970 to 0.8% in the 1970s and a dismal 0.7% in the first half of the 1980s.
When an economy begins to produce less per worker, as has been the experience in the U.S. of late, commonsense suggests various possible solutions. Households can scale back consumption purchases in line with reduced income growth. Firms can reduce expenditures on capital goods in the face of lower profit margins. Or the government can reduce its own spending on goods and services (consumption spending), leaving a larger slice of output to be allocated to competing private sector needs. However, none of these resolutions has occurred, or at least have not occurred sufficiently enough to match the diminished availability of domestically produced goods and services.
Instead, households, businesses, and the government have saved less and borrowed more in the attempt to consume, invest, and finance public spending in excess of their income, cash flow, and tax revenue.
After averaging 9% of GNP during the 1960s, the private savings rate fell to 8.3% during the 1970s and even lower, to 6.2%, during the first half of the 1980s. Also, there has been a high budget deficit as the government sector’s outlays exceeded the pace set by tax revenues. During the last years of the Carter Administration and throughout the Reagan Administration, budget deficits ballooned, with the excess of spending over revenues peaking at 5.4% of GNP in 1984.
In turn, the national attempt to spend beyond our present means has forced up real interest rates as well as caused a trade deficit in the international accounts. Higher interest rates work to choke off private expenditure, particularly on durable goods, thereby lowering the demand for borrowed funds. At the same time, higher domestic interest rates—relative to foreign rates—also attracted foreign capital. This had the desirable effect of allowing a higher private investment rate, thereby enhancing future productive capacity, than would have occurred in an economy closed off from international capital markets. Still, this has resulted in a large liability to the rest of the world. Indeed, by most accounts, the U.S. went from being the world’s largest creditor to the world’s largest debtor in less than a decade.
The ultimate consequence of the productivity disease then will be a lower standard of living as we pay back the debt held by foreigners.
Previous diagnoses
Prior studies of the falloff in productivity have centered on a relatively small number of potential causes. A surge in aggregate productivity can be expected whenever resources are shifted from less to more productive sectors of the economy. The migration of labor from farm to nonfarm occupations had such an effect, but mostly came to a halt by the mid 1960s. Certain economists, most notably Zvi Griliches of Harvard University, have emphasized a general slowing of expenditures on research and development and a related slowing of technological change.
But, the combination of these factors does not go far enough in explaining the productivity decline. The Bureau of Labor Statistics, for example, estimates that these factors probably account for only one-fourth or so of the slower productivity growth in the private economy. Lower rates of capacity utilization also may explain some of the reduction in total factor productivity; after averaging 84.1% during 1951 to 1970, the rate of capacity utilization fell to 79.5% in the period 1971 to 1985. But changes in capacity utilization rates, largely driven by erratic fluctuations in aggregate demand for goods and services and transitory technological shocks, are more likely to explain short-term, rather than long-term movements in productivity.
A new diagnosis
One place to search for a plausible reason for the productivity decline is in the government accounts—how the government gets and spends its money. Many have insisted that the financial status of the public sector—the budget deficit and consequent creation of government bonds—may play an important role in influencing the economy’s performance. Specifically, it is argued that high public sector bond issuance forces up real interest rates and drives down the new private investment spending that is essential for fostering economic growth and technological improvement.
I suggest, however, that it is more reasonable to look at the physical aspects of the government budget, at the distribution of government spending across various broad categories.
As it happens, there is a remarkable correlation between the level of total factor productivity and the level of the nonmilitary public capital stock over the last 35 years. My empirical results suggest that movements in public capital are capable of explaining a large portion of the longer-term movements in productivity in the private sector over the period 1949 to 1985.2
Roughly, a one percentage point increase in the level of the net stock of public capital relative to the level of private sector inputs of labor and capital brings forth a one-third of one percentage point (.33) rise in productivity. Table 1 translates this result into an accounting mechanism for the growth rate of total factor productivity during the high-growth period 1950-70 and the subsequent low-growth period 1971-85. While productivity growth fell from 2% to 0.8% per year—a falloff of 1.2 percentage points—the growth rate of the net stock of nonmilitary public capital shriveled from 4.1% to a mere 1.6% per annum. Even more striking, the growth rate of the public capital stock relative to a “combined” unit of private labor and capital went from a strongly positive 2.4% to a negative 0.6% in the slowdown period.
Table 1. Average annual growth rates
| of: | 1950-85 | 1950-70 | 1971-85 |
|---|---|---|---|
| Productivity | 1.5% | 2.0% | 0.8% |
| Public capital | 3.0% | 4.1% | 1.6% |
| Public capital relative to private inputs | 1.1% | 2.4% | –0.6% |
| Capacity utilization | 0.2% | 0.3% | 0.1% |
Multiplying the slump in the growth in public capital by the sensitivity of productivity to public capital growth—the previously mentioned 0.33—shows that fully (3.0) x (.33) = 1.0 percentage point of the total decline in productivity of 1.2 percentage points can be attributed to the neglect of infrastructure.
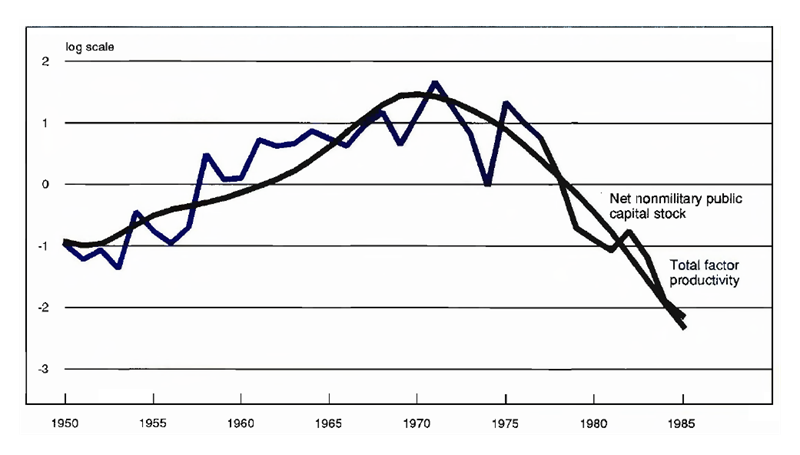
Figure 1 vividly illustrates the tight relationship between public nonmilitary capital and total factor productivity by comparing levels of total factor productivity and the stock of public structures and equipment after removing time trends. As is clearly demonstrated, this relationship holds for the period of rising productivity growth during the 1950s and 1960s as well as for that of falling productivity growth during the last decade and a half. And, as low productivity growth leads a low standard of living by the hand, insufficient investment in the economy’s infrastructure will soon force individuals to trim their style of living. Senator Quentin Burdick of North Dakota warns, “We have produced a high standard of living, but we are beginning to see cracks in that high standard, and a less than adequate infrastructure has been identified as the cause.”3
Figure 1. Tandem downturn: U.S. productivity and government investment
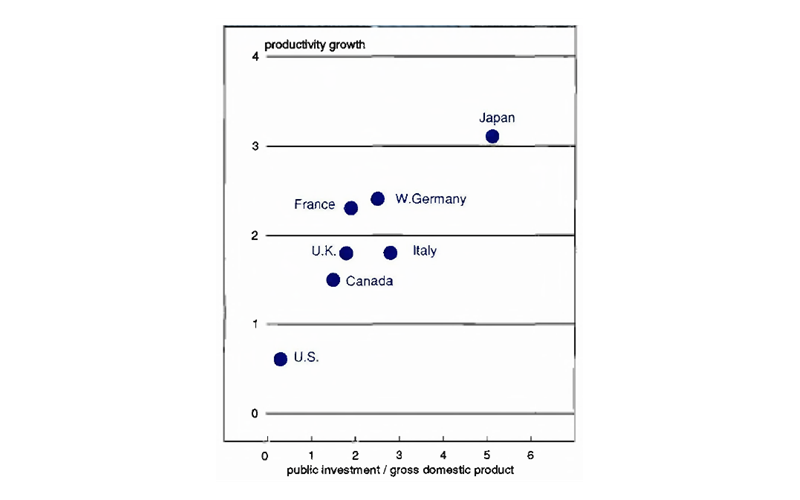
We would also expect that countries that sustain a high level of public investment relative to output would experience higher productivity growth than countries that do not invest in infrastructure. Figure 2 illustrates precisely this result, plotting combinations of annual growth rates of gross domestic output per employee hour and ratios of public investment spending to gross domestic output for the “G-7” countries over the period 1973-85. Japan has invested about 5.1% of output in public facilities and achieved productivity growth of 3.3%; at the other end of the spectrum, we find the U.S. with a low public investment of 0.3% per year and low productivity growth of 0.6% per annum. At the same time, productivity growth in these countries was negatively related to government consumption spending.
Figure 2. Back of the G-7 pack
While total government outlays relative to GNP have risen from 26% in the late 1950s to 35% in the middle of the l980s, public nonmilitary capital expenditures have slid precipitously. Dana Huestis, president of Associated General Contractors of America, has stated in congressional testimony, that “the infrastructure crisis is real. As a nation, we have not been investing enough in our public facilities to either keep up with new growth, or to rebuild and protect what is falling into disrepair.”4
Thus, a root cause of the decline in the competitiveness of the U.S. in the international economy may be found in the low rate at which our country has chosen to add to its stock of highways, port facilities, airports, and other facilities that aid in the production and distribution of goods and services. Just as thoughtful athletes would not think of neglecting their health for fear of failing to compete well on the playing field, we as a country should be vitally concerned with the viability of our economic lifelines that enable us to meet the challenge of an increasingly competitive world marketplace.
In the words of Nancy Rutledge, executive director of the National Council on Public Works Improvement, “If we spend too little on public works…society loses more than the direct public cost. In the long run, our ability to compete in the international economy will be weakened, and our standard of living will suffer.”5 Nearly echoing her remarks, Peter Butkus, a public works manager for the State of Washington, has said that “good public works becomes the single most important thing that local governments can provide in the nation’s effort to maintain and expand foreign trade and competitiveness.”6
Prognosis
The chance for a recovery from a physical condition such as a minor hardening of human arteries is usually quite good if it is identified early enough, and the patient adopts a proper counting of calories, a good diet, and a certain amount of exercise. Similarly, given the stability of the relationship between the economy’s infrastructure and the productivity of private factors of production, we may be confident that a more balanced distribution of public sector resources, shifting some from consumption and into capital accumulation, will rejuvenate the economy’s lifelines.
Raising the level of public investment spending from its current abysmal level of less than one half a percent of GNP to a modest 2% percent—some $80 to $90 billion per year—would work wonders, quite likely wonders comparable to those of modern medicine in dealing with human disease.
MMI—Midwest Manufacturing Index
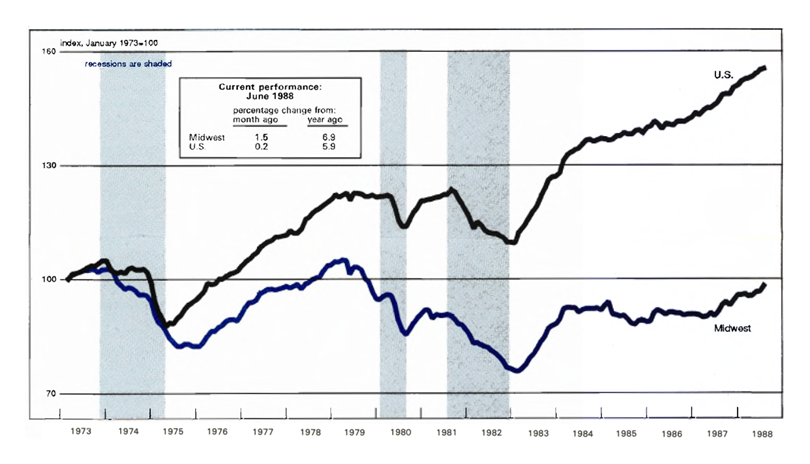
Industrial production in the nation grew at its second lowest rate of the year in June, according to the Federal Reserve Board. Flatness in auto assemblies, which have been a major source of strength all year, accounted for much of the slowdown. Industries supplying the auto industry, such as primary metals, also experienced some slowing. Nondurables continued to be weak relative to durables.
Midwest Manufacturing activity jumped by 1.5 percent in June. This was the largest increase in the MMI of the year. Transportation equipment continued its strong performance with a 2.2 percent rise. Food processing and chemicals each rebounded from a sluggish May with increases of 2.7 percent and 2.2 percent, respectively.
Notes
1 “America is Buckling and Leaking,” New York Times, June 24, 1988.
2 These estimates are contained in David Alan Aschauer, “Is Public Expenditure Productive?” Federal Reserve Bank of Chicago, working paper, in press.
3 Senate Hearings, Subcommittee on Water Resources, Transportation, and Infrastructure, October 21, 1987.
4 Senate Hearings, Subcommittee on Water Resources, Transportation, and Infrastructure, October 6, 1987.
5 Fragile Foundations, National Council on Public Works Improvement, February 1988.
6 Senate Hearings, Subcommittee on Water Resources, Transportation, and Infrastructure, November 4, 1987.


