

After showing the promise of a sustainable economic resurgence, has the Midwest reverted to its previous downward spiral? We think the answer is a qualified no—the recent weakness in the region's economy is not as self-perpetuating as it has been in the past. However, the marked slowdown in the natural economy exposed the soft underbelly of the Midwest economy—its auto industry. In a sense, the national economy was growing too slowly to allow the Midwest to offset the negative effects of restructuring the auto industry.
The following publication has been lightly reedited for spelling, grammar, and style to provide better searchability and an improved reading experience. No substantive changes impacting the data, analysis, or conclusions have been made. A PDF of the originally published version is available here.
After an export-driven boom in 1987 and 1988, the Midwest turned in a disappointing performance in 1989. It grew at a slower pace than the nation for the first time in three years—some of its industries experienced recession-like conditions.
After showing the promise of a sustainable economic resurgence, has the Midwest reverted to its previous downward spiral? We think the answer is a qualified no—the recent weakness in the region’s economy is not as self-perpetuating as it has been in the past. However, the marked slowdown in the national economy exposed the soft underbelly of the Midwest economy—its auto industry. In a sense, the national economy was growing too slowly to allow the Midwest to offset the negative effects of restructuring the auto industry.
This Chicago Fed Letter is the third annual review of the performance of the Midwest economy. The analysis is based on the growth of manufacturing and service sector activity in 1989, measured by the Midwest Manufacturing Index (MMI) and the newly constructed Midwest Service Index (MSI).1 Both indexes represent estimates of real output and, thus, demand for Midwest products and services. Dissecting them into subsectors and subregions provides some insights into the strengths and weaknesses of the Midwest economy.
National economy shifts into low gear
For the Midwest, which depends heavily on demand for consumer and producer durable goods, the link to the national economy was an important constraint on the ability of the region to grow in 1989. Gross national product, a measure of real output for the nation, grew 3% in 1989 (on a year-over-year basis), compared to 4.4% growth in 1988.
That slowdown, however, occurred mostly in the second half of 1989, dropping from a respectable 3.2% in the first half to 2.3% in the second—barely keeping ahead of labor growth. Moreover, the components of GNP that contributed most to the slowdown nationally in 1989 were key to the Midwest economy.
Consider, for example, that consumer durables, equipment investment, and exports were largely responsible for the national economic slowdown in 1989. Each component grew at roughly half its previous year’s pace. Even so, each was expanding at a faster pace than some other components of the economy, including residential and nonresidential building and the consumption of nondurable goods and services. Indeed, growth in output of consumer services in 1989 was virtually unchanged from the previous year and grew more slowly than equipment investment and less than half as fast as exports.
Given the characteristics of the national slowdown, a slump in the Midwest economy would seem unavoidable. But the extent of the regional weakness still depended upon the success of Midwest businesses at retaining their share of the national market for goods and services. Last year’s review issue of the Fed Letter anticipated a slowing of the regional economy.2 What was unknown at that time was whether the Midwest could maintain its relative success by outpacing the nation in the face of a pervasive weakening of demand.
A beating from autos
Manufacturing has been the cornerstone of the Midwest’s revival in recent years. Not only has it been growing faster than the service sector, but it has also outpaced manufacturing for the nation as a whole.
In the aggregate, the performance of Midwest manufacturing in 1989 suffered a serious setback (see figure 1). Manufacturing activity in the Midwest was up 1.8% (again on a year-over-year basis), compared to 2.6% nationwide. By growing at roughly two-thirds the pace of the nation, the Midwest lost some of the market share it had struggled to recapture in the previous two years.
Figure 1. Manufacturing output over the current expansion
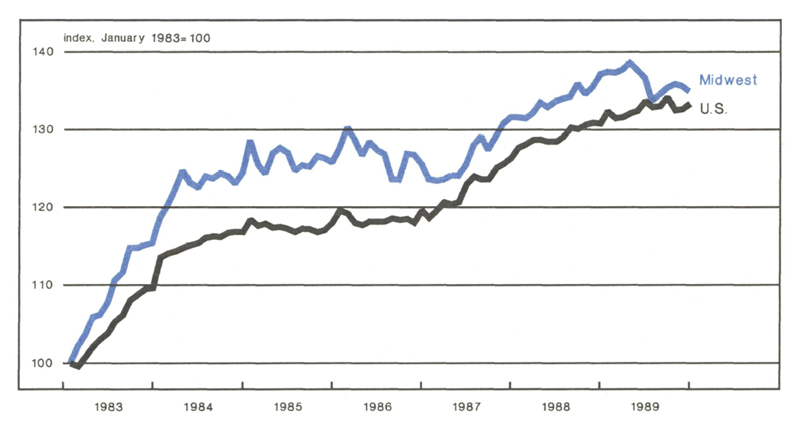
Source: Federal Reserve Bank of Chicago.
But as disappointing as that performance was, there is reason to believe that the poor performance may be temporary. For example, during the first half of the year, Midwest manufacturing was expanding at a healthy 3.4% annualized pace, still ahead of the 3.1% national pace. In the second half of the year, however, manufacturing activity in the Midwest declined 3.7%, even though manufacturing nationwide merely flattened out. In other words, when the national economy was fairly robust, Midwest manufacturing was able to capture a healthy share of that national growth. Only when economic growth turned anemic did Midwest manufacturing slump.
Consider next the subregional distribution of manufacturing growth. We use employment growth of the five states that compose the Seventh Federal Reserve District as indicators of the subregional distribution of output growth (see table 1). Iowa’s and Indiana’s manufacturing sector grew faster than the national average. Both Illinois and Wisconsin nearly equaled the national pace. Only Michigan saw a reduction in manufacturing, and its problems are deeply rooted in the restructuring taking place in the automobile industry. Since early 1987, 11 domestic auto plants have been permanently closed—four in Michigan and one in Wisconsin. While only two have occurred since the end of 1988, the spillover effects from the previous plant closings were still generating employment losses for Michigan and the Midwest in 1989.
Table 1. Employment growth—1989
| Manufacturing (percent) | Service (percent) | |
|---|---|---|
| Illinois | 0.9 | 1.6 |
| Indiana | 1.4 | 3.0 |
| Iowa | 3.2 | 2.8 |
| Michigan | –0.2 | 2.3 |
| Wisconsin | 0.9 | 2.4 |
| Midwest | 0.7 | 2.2 |
| U.S. | 1.1 | 3.2 |
Source: Department of Labor, Bureau of Labor Statistics.
Spillover effects
The effect of the second-half slump in the automobile industry is captured by the distribution of output growth for the major sectors of the MMI (see table 2). Particularly, the Midwest’s transportation sector, which alone accounts for 12% of Midwest manufacturing production, declined a crippling 4% in 1989. While transportation nationwide was one of the weakest sectors in manufacturing, its growth was still positive at 1.2%. The difference between the region and the nation reflects in part the structural adjustments that have been occurring in that industry over the entire decade and is not representative of the competitive strength of most Midwest plants.
Table 2. Manufacturing output—1989
| Midwest (percent) | U.S. (percent) | |
|---|---|---|
| Metalworking | –0.7 | 0.8 |
| Machinery | 0.9 | 0.5 |
| Transportation | –4.0 | 1.2 |
| Chemicals | 6.1 | 5.2 |
| Consumer | 2.3 | 3.4 |
| Total | 1.8 | 2.6 |
Evidence of the harmful effects of Michigan’s auto industry troubles on the Midwest economy can be seen in other measures of production trends. For example, production for the 1989 model year was 1.8% above 1988’s model year (roughly from September to September). However, car assemblies in Michigan (representing one-third of the total) declined 7%. Illinois provided some offset to Michigan’s losses by increasing car assemblies by 30%. But Illinois’ auto industry is only about one-fifth the size of Michigan’s.
The spillover effects from the auto cutbacks in 1989 can be seen in raw steel production. Total raw steel production in 1989 declined 2% in both the nation and the Midwest (Indiana, Illinois, and Michigan produce 37% of the national total). The estimated value of that Midwest production decline was greater than the nation’s, suggesting that product mix had an adverse effect and that there was a decline in the higher quality steels that go into auto production.
Exports of manufactured goods (unadjusted for inflation) rose 17% in the nation during 1989. Exports from the Midwest, which account for about one-tenth of total exports of manufactured goods, rose only 11%. Thus, export activity was clearly holding back manufacturing growth in the Midwest. Here again, auto production was a partial factor. Illinois, Indiana, and Iowa were roughly in step with the nation in terms of their export growth. Michigan, the largest exporting state in the region, had low export growth because most of its trade is with Canada and is linked to auto production.
The service sector keeps rolling, but…
The service sector includes four major subsectors: FIRE (finance, insurance and real estate), TPU (transportation and public utilities), services (personal and business), and trade (wholesale and retail). Growth in consumer spending on services tends to follow a stable growth path, and, with growth at 3.7%, 1989 was no exception.
The service sector managed to grow 50% faster than the manufacturing sector in 1989. But it was only the first time in three years that service-sector growth outperformed the manufacturing sector. Moreover, service-sector growth in the Midwest lagged the national average, as it has consistently done over the current economic expansion (see figure 2). Thus, while service-related jobs were being created faster than manufacturing jobs were being lost in the Midwest, the service sector has been unable to maintain its share of the national service economy.
Figure 2. Service sector output over the current expansion
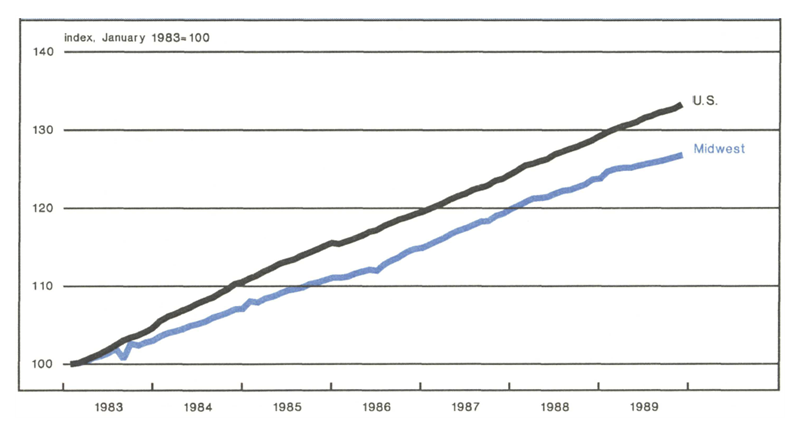
Source: Federal Reserve Bank of Chicago.
The lagging growth in the Midwest’s service sector may be attributed to several factors. First, service-related activity has been hampered by the region’s slow growth in population. In addition, per capita income growth in the Midwest has been lagging the nation for many years, leaving less discretionary income to be spent on personal services, relative to other parts of the nation. Finally, business services have been constrained by the shrinkage of the manufacturing base in the early 1980s—there were fewer businesses to serve. The loss of relatively high-paying manufacturing jobs in the Midwest may account for both the low population growth (or high outmigration) and falling relative per capita income.
Unlike the manufacturing sector, however, the lagging performance in the service sector was pervasive across subsectors and subregions. Every state in the Midwest experienced slower service sector growth than the nation (see table 1). Interestingly, service sector growth was weakest for Illinois and strongest for its neighbor, Indiana. The difference seems to be related to Indianapolis’ emergence as a service center and Chicago’s inability to take full advantage of its dominant size to expand its role as an export center of services. Michigan was again something of an exception, in that its service sector did relatively well despite a decline in manufacturing output. Either Michigan has been more successful than other Midwest states in diversifying its economy toward service-related industries that are independent of manufacturing activity or, as suggested above, its weakness in auto manufacturing does not truly represent the competitive strength of the state’s manufacturing base.
Among subsectors, both the finance, insurance, and real estate industry and the personal and business services industry, which are the core of the “new” service economy, grew roughly 50% faster for the nation on average than for the Midwest (see table 3). Surprisingly, wholesale and retail trade grew faster in the Midwest than in the nation. But growth in trade services, especially in wholesale trade, may be linked to the gains in manufacturing over the last few years.
Table 3. Services output—1989
| Midwest (percent) | U.S. (percent) | |
|---|---|---|
| Finance, insurance, and real estate | 2.0 | 3.1 |
| Personal and business servies | 3.1 | 4.5 |
| Transportation, communications, and public utilities | 1.8 | 3.8 |
| Wholesale and retail trade | 5.4 | 3.4 |
| Total | 3.0 | 3.5 |
Hope for the 1990s
Despite falling short of the pace set by the nation in 1989, the Midwest economy did show some rays of hope that the 1990s will see further improvements in the competitive performance of the region. To be sure, overall growth of the Midwest economy slowed markedly in the second half of last year, but that was true of the national economy as well. And both manufacturing and service activity in the Midwest lagged their national counterparts, but some sectors continued to outperform the nation. Much of the difference between manufacturing growth in the region and the nation can be attributed to ongoing structural adjustments, especially in Michigan’s auto industry. Indeed, if the auto industry is dropped from the measure of manufacturing activity, the Midwest grew at virtually the same rate as the nation.
If it is true that service activity in the Midwest is still adjusting to the structural upheaval of the region’s manufacturing sector during the first half of the 1980s, Midwest service performance relative to the nation could turn around in the 1990s. All these qualifications support the conclusion that the Midwest in 1989 retained at least some of the economic momentum attained in recent years. That bodes well for the future if economic growth strengthens nationally.
But with the national economy expected to slow even further in 1990, the Midwest is likely to experience another year of sluggish growth with some sectors lagging and others exceeding the national pace. The consensus forecast for 1990 indicates that exports, investment, and consumer durables will continue to weaken.3 The U.S. Department of Commerce has forecast that steel mill products, household consumer durables, and motor vehicles will all decline in 1990. Machine tools, which grew by 30% in 1989, will grow by only 1% this year. The key industries in the Midwest cannot be expected to generate much growth for the region. At least one more auto plant will close its doors in the Midwest—Chrysler’s Jefferson plant in Michigan—and that will be replaced by a new plant not scheduled to open until 1991.
If its service sector also continues to lag the national pace, the Midwest economy must again expect to lag the national economy. In order to offset the weakness that is being transmitted through its industrial structure, the Midwest needs a healthy growing national economy to achieve its best performance.
Notes
1 Service-sector activity is measured by the Midwest Service Index, MSI, and the U.S. Service Index, USSI, which are constructed under the same general methodology as the MMI and the USMI with two notable exceptions (for more details, see “Reconsidering the regional manufacturing indexes,” Economic Perspectives, Vol. XIII, Issue 4, July/August, 1989). First, because electrical power data are not readily available for most service-related industries, only employment is used to estimate monthly output. An implicit assumption is that the share of labor and capital in the value of total industry output is constant over the period of extrapolation, so that output can be projected from employment trends alone. Second, Gross State Product (GSP) data are used to establish annual benchmarks, rather than value added (as is used in measuring manufacturing output). Monthly patterns are interpolated from monthly employment data. Estimates of service output beyond 1986 (the most recent year that GSP data are available) are extrapolated.
2 See Chicago Fed Letter, No. 20, April 1989.
3 See Chicago Fed Letter, No. 30, February 1990.


