

The following publication has been lightly reedited for spelling, grammar, and style to provide better searchability and an improved reading experience. No substantive changes impacting the data, analysis, or conclusions have been made. A PDF of the originally published version is available here.
New jobs are a sign of a healthy, growing economy. Some 21 million jobs have been created in the U.S. since the present expansion began in November 1982. As a result, the U.S. unemployment rate, which hit 11.2% in the first quarter of 1983, has been hovering at 5% to 5.5% for the past year or so. This rate is close to the “natural rate” of unemployment—the rate that will occur even in a full-employment economy because of job changes and other factors.
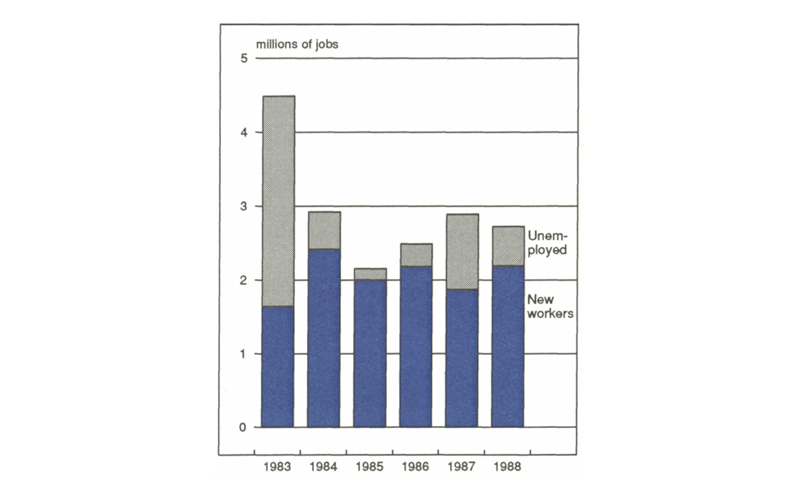
But filling new jobs is only partly a matter of rehiring the unemployed. It is also a question of demographics. There needs to be a constant stream of new workers to maintain a growing economy. For example, figure l shows that since 1984 the bulk of employment gains have come from new workers who have entered the labor force, not from the pool of the unemployed. This Chicago Fed Letter looks at demographic trends and the problems and opportunities that the changing U.S. population will present in the next 20 years or so.
1. Who got the new jobs
Population growth is slowing
The continued economic expansion and the concurrent decline in unemployment has reduced the number of unemployed people available to fill the jobs created by additional growth in the economy. Increasingly those people must come from additions to the labor force, ordinarily people who have reached working age, usually about age 20.
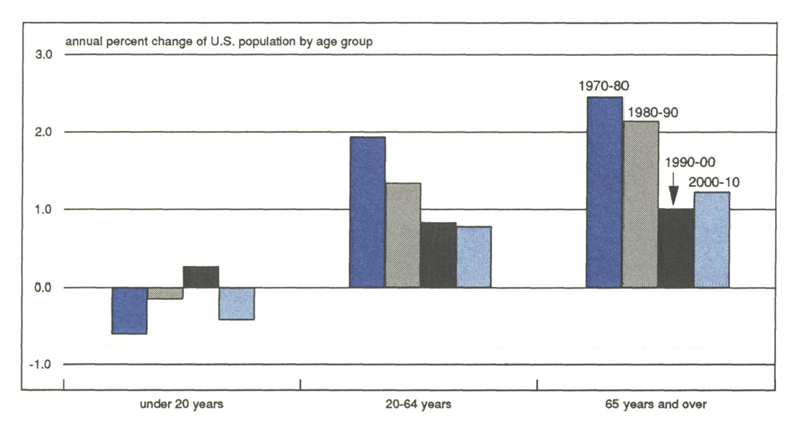
But at the same time that the unemployment rate has been declining, the rate of population growth in the U.S. has also been decreasing. Although the U.S. population will grow over the next 20 years, the rate of growth will continue to decline as it has over the last four decades. Thus, the average annual rate of population growth—1.79% between 1950 and 1960—should be no more than 0.5% between 2000 and 2010.
The slower rate of population growth will affect the size of the available labor force. Between 1970 and 1980, the number of persons in the 20-to-64 age group, i.e., the potential work force, was increasing at an annual rate of 1.93% as a result of the post-World War II “baby boom.” This age group is projected to increase only at an annual rate of 0.78% between 2000 and 2010 (see figure 2).
2. Fewer workers in the pipeline
Participation rates are converging
The future supply of labor in the U.S. depends, of course, not only on the growth in population but also on the rates of labor force participation.
During the last two decades, the increase in participation in the labor force by women has added substantially to the available labor supply. The labor force participation rate for men, 16 and over, was 79% in 1972, while that for women in the same age group was 44% (see figure 3). Since then the rate for men has declined slightly to 76% in 1988, while that for women has been steadily increasing so that it is now 57%. By the year 2000, the participation rate is projected to reach 62% for women and 75% for men.
3. Closing the gender gap
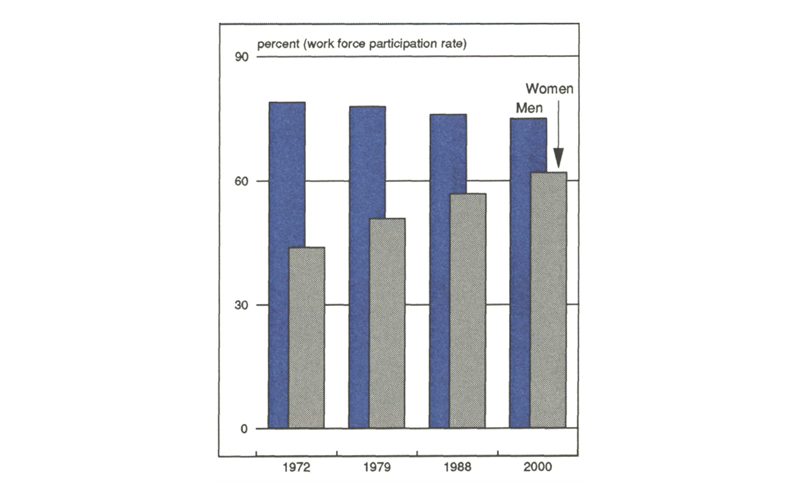
Thus, the projected increase in the growth rate for women in the labor force for the next 12 years is less than half that of the past 16. This slowdown will reduce the growth in the available labor supply.
Fewer entry-level workers
One early effect of the decline in the growth rates of the potential workforce has been the increasing difficulty in recruiting entry-level workers. These are primarily people in the 18-to-24 age group.
There has been a substantial decline in the number of persons in this age group nationally in the 1980s. This decline will continue during the ‘90s. After the year 2000, the number of persons in this age group should increase as the children of the “baby boom” parents—the “echo boom” as some have called it—reach this age group.
The ongoing decline in the rate of population growth for the 18-to-24 age group means that there will be fewer people available for entry-level jobs. In addition, an increasing percentage of high school graduates attend college. Although such people eventually become part of the labor force, the delay tends to slow the labor force growth rate in the short run.
More older workers
In recent years the general trend has been toward a decrease in the average retirement age, particularly for men. For some this has been a voluntary decision, made possible by adequate financial resources. In some cases, companies have offered early retirement to their older employees, generally in cost-cutting and restructuring moves.
Labor force participation rates for men ages 55 to 64 reflect this trend. In 1980 the participation rate was 72.1% for men in this age group, but by 1988 it had declined to 67.0%. For women in the same age group, however, the participation rate has continued to increase. In 1980, the participation rate was 41.3% for women in this age group. By 1988, it had risen to 43.5%. Partly this reflects the general increase in labor force participation rates for women. However, in many cases, women have not been in the labor force as long as their male counterparts. Thus, they have not acquired sufficient pension benefits to fund a comfortable early retirement.
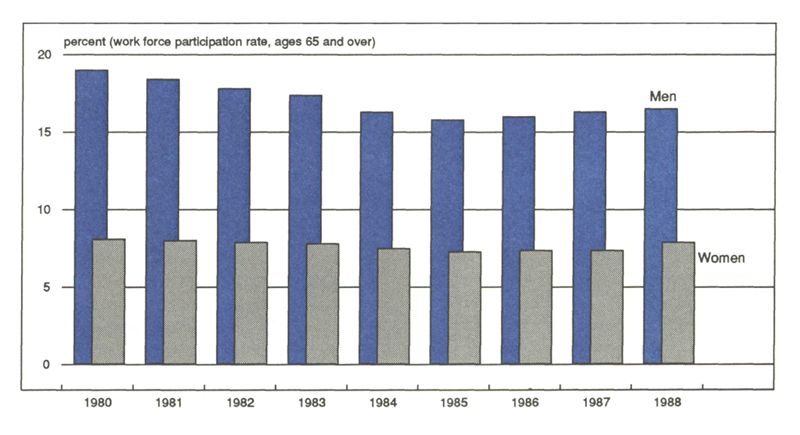
Labor force participation rates for both men and women over 65 years of age were declining until 1985 but have turned up since then (see figure 4). Although it is too early to be certain, this may be an indication of the developing need to augment our labor supply through the increased use of older workers.
4. Older workers: an available resource
Uncertain number of immigrants
Employment opportunities in the U.S. have always been attractive to residents of less affluent countries. As a result, immigrants to this country have been a continuous source of labor supply. As the rate of growth in the labor force slows, there is no doubt that immigrants will continue to flow into the labor pipeline.
Population projections recognize the additions to the growth in population from immigrants from other countries. In general the projections are based on the assumption that past trends in numbers and destinations within the U.S. will continue. It is possible that as growth in the domestic supply of labor slows more immigrants will come to the U.S. than in the past. However, the actual increase is difficult to project and additions to the labor force from this source are generally uncertain. Demographic projections of increases in the illegal component of immigrant labor are, of course, even cloudier.
Slower growth in Seventh District
Growth in the supply of labor in Seventh District states—Illinois, Indiana, Iowa, Michigan, and Wisconsin—is likely to be even slower than that nationally. As a result, if present trends continue, employment growth in the District will probably be less than that experienced in the rest of the U.S.
Recent population projections by the Bureau of the Census indicate that the level of population in all of the District states will be declining after 1990. Between the years 2000 and 2010, the average annual rate of decline of population is projected to range from -0.07% in Illinois to -0.68% in Iowa.
The projected declines in the Midwest population after 1990 will reduce growth in the size of the potential work force. In Iowa, the number of persons in the 20-to-64 age group is expected to be declining between 1980 and 2010. In the other states in the District, the potential work force will show only slight growth.
Policy options
Projections of the future labor force based on growth rates in the population and participation rates strongly suggest that the labor supply will increasingly act as a constraint on the expected employment growth over the next 20 years. A continuation of past trends in economic growth will therefore increasingly require more productive use of the existing supply of labor.
Training for the usual labor force age group—ages 18 to 65—becomes even more important if we are to increase productivity. Continuous upgrading of skills is necessary to incorporate new techniques for production and management.
Young people who drop out of high school before graduation are a potential source of workers, particularly for entry-level jobs. However, employers may increasingly find it necessary to provide on-the-job training as a substitute for the education that they did not receive in high school. This is also true for those high school graduates who do not receive an adequate basic education in high school. Indeed, there are many indications that businesses already recognize the need to address such educational deficiencies.
The projected decline in population of the 18-to-24 age group, which is the primary source of workers, mandates that older workers should be encouraged to continue working if overall employment levels are to continue to grow. To make the most productive use of these employees, training and promotion opportunities will need to be provided.
Not only should older workers be retained, but growth of the population in this age group suggests that the older age group would be a likely source for the recruitment of workers. They generally offer the advantages of long experience and limited family obligations.
Recent legislation raised the future age for retirement with full Social Security benefits. It also increased the amounts that Social Security beneficiaries could earn up to age 70 without losing their benefits.
Although the general intent of the legislation was to maintain the solvency of the Social Security system, a side effect could be an increase in the available labor supply. Certainly, delaying the retirement age and encouraging employment by older workers, even part-time, by permitting them to keep a larger portion of their earnings contributes to growth in the labor force.
But, if employers are to make full use of their workers, training and promotion opportunities should be made available to all workers regardless of age. All too frequently, younger workers are encouraged to continue their education while working, at their employers’ expense, and then leave for other positions with their new skills. The older worker who is more likely to stay with the company may be less likely to receive such encouragement.
Immigrants also represent a potential addition to the labor supply. Productive use of their skills may require not only the usual education and training, but also require specialized education in language skills.
The demographic trends now becoming apparent suggest that in the 1990s U.S. business will have to give more emphasis to human capital investment. Failure to respond creatively to the nearly inexorable changes in the population structure and labor supply will place American business at a considerable disadvantage to our global competition.
MMI-Midwest Manufacturing Index: Current expansion
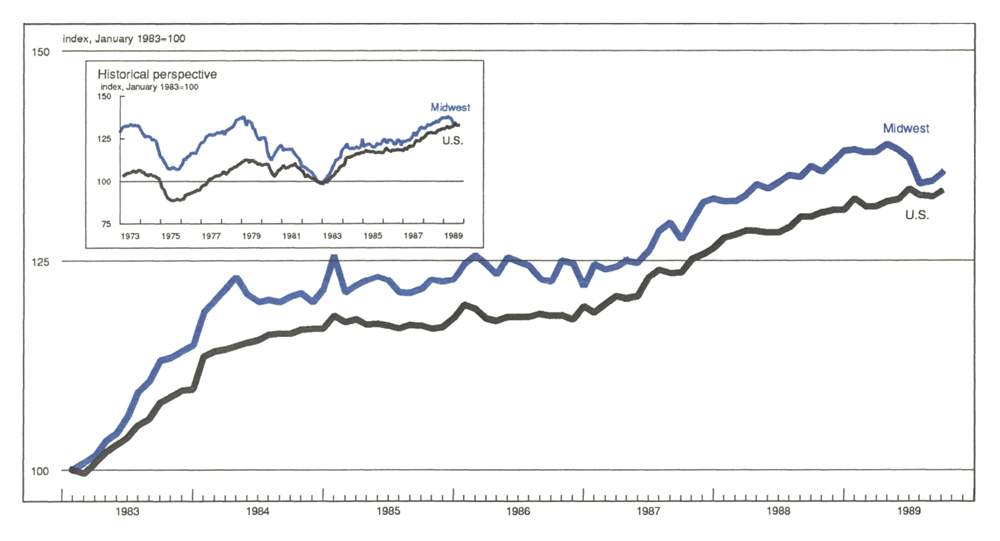
Manufacturing activity in the Midwest, measured by the MMI, improved slightly in September, with the gain in line with the improvement in the U.S. manufacturing index. Four major sectors contributed to the Midwest’s advance, with the only exception being metalworking which registered its second decline in three months.
While gains in manufacturing activity nationwide, measured by the USMI, were comparable to the Midwest, the major sectors in the national index suggested underlying softness in the nation’s performance. Three sectors—machinery, metalworking, and transportation—were declining and the consumer-related sector was flat, leaving gains coming only from the chemical sector.


