

The following publication has been lightly reedited for spelling, grammar, and style to provide better searchability and an improved reading experience. No substantive changes impacting the data, analysis, or conclusions have been made. A PDF of the originally published version is available here.
The U.S. banking industry has undergone significant challenges over the past five years due to well-publicized problems associated with LDC (lesser-developed countries) debt, commercial real estate, highly leveraged transactions and, in some instances, significant regional economic downturns. These events, in conjunction with the thrift crisis and the diminished resources of the bank insurance fund, have led many analysts to become pessimistic about the future of the industry.
However, an analysis of the aggregate financial condition and performance of the commercial banking industry at year-end 1991 provides a different story. Contrary to many perceptions, the commercial banking industry weathered the storms of the 1980s quite effectively. During 1991, only 10.6% of the banks reported losses, down from 12.5% in 1990. The 1991 rate is the lowest since 1982. Regionally, the largest percentage of banks with losses in 1991 was concentrated on the coasts—the Northeast and West—with the Midwest having the lowest percentage of unprofitable institutions. In 1991, 46% of the insured commercial banks in the nation, representing 37% of the industry’s assets, reported ROAs greater than 1%. Many of these banks were located in the Midwest, which has a high concentration of smaller institutions.
This Chicago Fed Letter briefly discusses some of the changes in commercial banks’ balance sheets and earnings over the last five years, including the major components of the balance sheet, suggests reasons for the shifts in asset composition both nationally and in the Seventh Federal Reserve District,1 and reflects on their significance for the future. Credit quality indicators are also analyzed and their effect on earnings is illustrated. In addition, the performance of the industry is assessed and a discussion of the outlook for banks concludes the article.
Securities
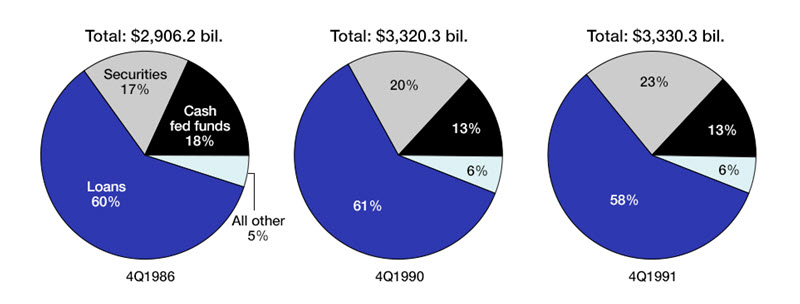
During the past five years, the most significant changes occurring on the balance sheet of the U.S. banking industry have been the increase in securities and the decrease in commercial loans. As illustrated in figures 1 and 2, the percentage of bank assets in securities has increased while the loan portion of the balance sheet, particularly the commercial segment, has decreased over the past five years. Over the past year, securities holdings as a percentage of total assets have increased 3 percentage points while total loans as a percent of total assets declined by that same percentage. These significant changes reflect the continued disintermediation of financial services as well as structural changes in the types of assets held by commercial banks.
1. U.S. balance sheet
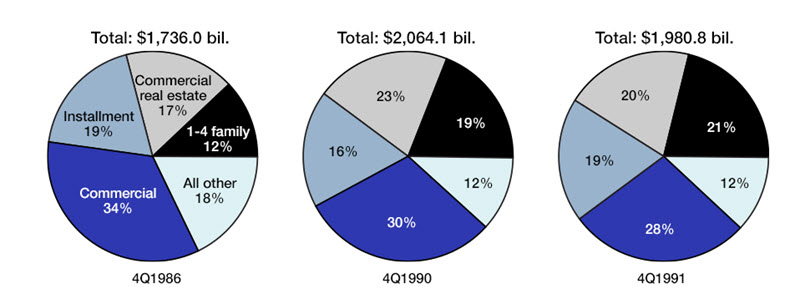
2. Loan portfolio analysis
The composition of the securities portion of assets held by U.S. banks has changed quite substantially since 1986. Securities issued by states and municipalities are no longer the primary component of securities. Since the Tax Reform Act of 1986, this category has declined rapidly as the tax advantages of holding municipals were reduced and as the credit quality of these securities decreased due to the financial difficulties experienced by an increasing number of municipalities. At the same time, the phenomenal increase in the secondary mortgage market resulted in the increased availability of Fannie Mae and Ginnie Mae securities such as collateralized mortgage obligations (CMOs).2 Government agency-sponsored CMOs at commercial banks grew from $54.2 billion at year-end 1990 to $90.7 billion at year-end 1991. CMOs were created to provide investors, including banks, with securities that have less prepayment uncertainty.
Associated with the increase in CMOs has been the general increase in the securitization of other assets. According to Securities Data Corporation, commercial banks securitized approximately $28.5 billion dollars of assets in 1991 as compared with $26.8 billion in 1990. Securitization is a process in which pools of similar assets (e.g., automobile loans or credit card receivables) are packaged and securities are sold that are backed by the underlying pool of assets. Securitization allows banks to book loans and then package and sell them in the secondary market. This has several significant advantages for financial institutions. It removes these loans from the balance sheet, thus improving capital ratios by reducing the amount of loans against which banks need to hold capital. Securitizing assets also generates additional fee income in the form of servicing fees, which helps boost noninterest income ratios. Finally, securitization also improves the liquidity of the balance sheet by replacing less-liquid loans with marketable securities.
Furthermore, bank examiners have indicated that purchasing asset backed securities has become an increasingly popular way for banks to diversify their risk exposure. For example, a smaller bank that may not have the opportunity to make many automobile loans outside of the limited number available in its immediate area can purchase securities backed by automobile loans. According to the Federal Reserve Bulletin, the amount of securitized consumer loans, including automobile and credit card loans, rose from $41.7 billion in 1989 to $88.1 billion at year-end 1991.
While securitizing assets may reduce an institution’s credit risk, it does not always remove it entirely. The issue of moral recourse continues to exist for many institutions. Moral recourse represents a responsibility whose fulfillment is not based on legal right or action. In addition, institutions that purchase asset backed securities may be replacing direct with indirect exposure. For example, although a bank may not make credit card loans directly, it still may be exposed indirectly to the risks of the credit card industry if it has purchased securities backed by credit card receivables.
Loan trends
In 1986, the primary loan category was commercial loans followed by installment loans, which include automobile loans (see figure 2). In 1991, commercial loans comprised a smaller portion of the on-balance-sheet portfolio while one to four family mortgage loans were the second largest category.
The primary reason for the decrease in commercial loans during this period has been the increase in disintermediation. Corporate customers increasingly access the capital markets directly. This is a result of improvements in technology as well as changes in securities regulations.
As a result, commercial banks have focused their attention on middle market commercial borrowers and consumers. With the thrifts’ assets steadily shrinking, the public must find other sources for mortgage funding, such as banks and mortgage companies.
Although the proportion of consumer installment credit to total bank loans has remained unchanged over the past five years, the composition within this category of loans has shifted. Traditional secured installment lending, such as auto loans and personal loans, continues to be the largest portion of this subcategory. However, the last few years have seen a rapid increase in credit card loans, which now account for 32% of unsecuritized installment lending as compared with 27% in 1986. This growth is attributable both to the need for banks to explore additional sources of income and the general increase in consumer credit card debt during this period. Banks were eager to expand their portfolios because of the high profitability demonstrated by credit card programs in the mid- to late 1980s. The downfall of the once profitable commercial real estate and other commercial loans has left some banks dependent on consumer loans, particularly credit card loans, for profits. Recently though, even the credit card market has experienced a profitability decline as consumer spending has decreased, nonbank competition has increased, and credit quality has deteriorated.
Delinquent and nonperforming loan levels increased exponentially in the last three years and have resulted in heavy provisioning and charge-offs. The increase in nonperforming assets (NPA) over the last few years is related to a pronounced increase in nonperforming real estate assets at commercial banks, particularly commercial real estate, which have doubled since 1987 both in the U.S. and the Seventh District.
The 13% increase over 1990 levels in loan charge-offs at U.S. banks helped to level off the ratio of nonperforming assets to total assets in 1991. The record fourth quarter charge-off of approximately $9.4 billion accounted for most of the year’s rise. This increase was most pronounced in the Northeastern and Mid-Atlantic regions of the U.S. With the level of nonperforming loans rising in the West, substantial charge-offs in that region are imminent. The Seventh District ratio of charge-offs to total loans declined slightly from 1990 to approximately one half the U.S. ratio of 1.56%.
Consequences for bank earnings
Earnings at U.S. banks for the last five years have been predominantly affected by higher levels of troubled loans and increased provisions for future losses, especially at the larger banks (see figure 3). In 1987, the LDC driven provisioning increases diminished reported earnings to their lowest levels since the Depression in both the U.S. and the Seventh District. By contrast, past due Brazilian debt interest payments, coupled with a record number of bank resolutions, boosted 1988’s earnings to a decade high level. In 1989, large banks were again saddled with LDC concerns, both nationally and, to a lesser extent, in the Seventh District. In addition, domestic credit woes began to erode bank profitability. Domestic credit problems were evident in 1990 as nonperforming real estate loans reached record levels. Continued provisioning to cover increased loan losses cut deeply into reported earnings, especially at those banks located in the Northeast.
3. Return on assets
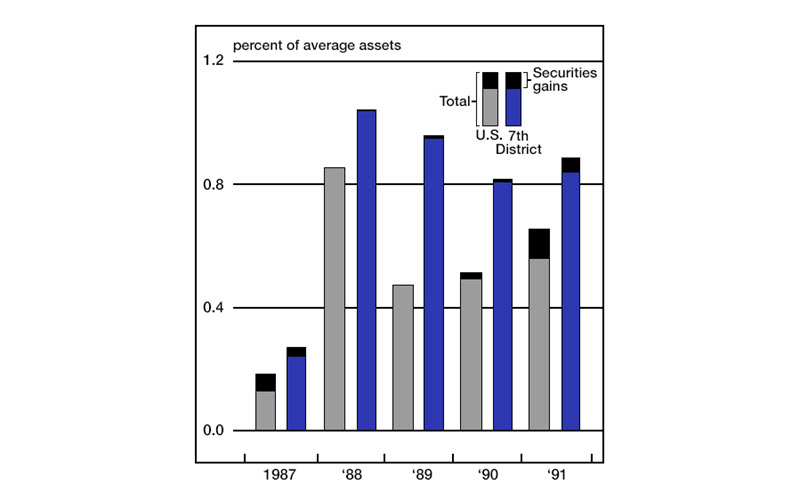
Despite continued commercial real estate problems, U.S. banks earned 0.56% on assets in 1991, 7 basis points higher than in 1990, as a result of lower loan loss provisions and increased gains on the sale of investment securities. In addition, banks’ funding costs continued to decline more rapidly than their asset yields, resulting in the highest net interest margins since the end of 1988. Commercial banks also benefited from higher noninterest income in 1991, particularly from the gains and fees from assets held in trading accounts. The dependence of banks, particularly large banks, on nontraditional sources of income continues to grow. In 1991, securities gains accounted for roughly 20% of earnings. Net of securities gains, 1991 return on assets (ROA) ratios for both U.S. and Seventh District banks were the same as those posted in 1990. Overhead costs, particularly those associated with higher FDIC premiums, other real estate owned (OREO), and restructuring, also increased at banks of all sizes over the year. As the industry continues to consolidate, overhead cost reductions may be realized as banks close branches and consolidate backroom operations such as check processing.
Conclusion
Over the last five years, banks have substituted securities for loans. In addition, they have continued to securitize many of their loans in order to move them off the balance sheet, thus improving capital ratios and generating additional noninterest income. Credit quality continued to have adverse impacts on bank earnings as provision increases to cover problem credits remained high over the last few years. Despite the contraction in the total loan portfolio, consumer credit became an increasingly larger component of total loans. Credit card loans in particular have demonstrated significant growth in the past few years.
A5 a result of lower nonperforming loan levels, improved capitalization, and stable reserves, loan loss provisions will probably be lower in the year to come. Interest margins will more than likely narrow and gains from the sale of investment securities will probably not contribute so heartily to earnings in 1992. The continued erosion of credit quality in the West will hamper ROAs in that region but will be offset by continued improvement in the Northeast. In addition, as industry consolidation continues, overhead expense control may improve for the reasons mentioned earlier. The net result should be improved earnings for both U.S. and Seventh District banks in 1992.
Although the industry appears to have weathered the recent storms, continued challenges remain. These include market share pressure from nonbank organizations, particularly in the consumer sector. As more and more nonbank financial organizations take market share from the banks, either additional sources of income will have to be found or industry shrinkage will continue. In addition, Congress will have a significant impact on the future of the industry as it decides what further legislation is to be enacted.
Tracking Midwest manufacturing activity
Manufacturing output index (1987=100)
| July | Month ago | Year ago | |
|---|---|---|---|
| MMI | 110.3 | 110.5 | 109.8 |
| IP | 109.5 | 109.6 | 108.3 |
Motor vehicle production (millions, saar)
| August | Month ago | Year ago | |
|---|---|---|---|
| Autos | 5.5 | 5.7 | 5.3 |
| Light trucks | 3.7 | 3.8 | 3.3 |
Purchasing manager’s association: production index
| August | Month ago | Year ago | |
|---|---|---|---|
| MW | 60.0 | 62.7 | 60.0 |
| U.S. | 56.4 | 57.6 | 59.8 |
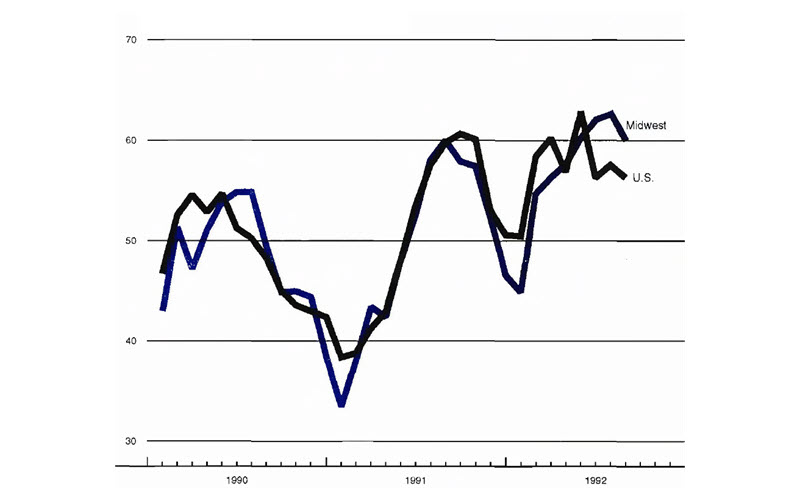
Purchasing Managers’ Surveys—production index
Sources: The Midwest Manufacturing Index (MMI) is a composite index of 17 industries based on month hours worked and kilowatt hours. IP represents the FRBB industrial production index for the U.S. manufacturing sector. Autos and light trucks are measured in annualized physical units, using seasonal adjustments developed by the Federal Reserve Board. The PMA survey for the U.S. is the production components of the NPMA survey and for the Midwest is a weighted average of the production components of the Chicago, Detroit, and Milwaukee PMA survey, with assistance from Bishop Associates and Comerica.
Manufacturing activity in August, as measured by the composite Purchasing Managers’ Surveys for the Midwest, slowed after a five-month period of steadily expanding activity. In contrast, the manufacturing expansion nationally began to slow as early as June and has been trending down since early in the year.
Within the Midwest, both Detroit and Milwaukee registered a marked slowing in the pace of their manufacturing advance. In Chicago, however, the percentage of respondents reporting expanding production reached the highest level in more than three years.
Notes
1 The Seventh Federal Reserve District consists of portions of Illinois, Indiana, Michigan, and Wisconsin and all of Iowa.
2 CMOs are multi-classed mortgage backed securities collateralized by other mortgage backed securities. Collateral typically consists of securities issued by one of the federally sponsored agencies (GNMA, FNMA, FHLMC). Cash flow from the underlying collateral is distributed based on a “set of rules” to form the different classes, also known as tranches. These rules essentially create classes with differing levels of prepayment variability.


