

Throughout the Midwest, heavy rains this spring and summer caused the worst flooding on record in many parts of the region. This natural disaster killed 48 people and forced 74,000 from their homes.1 It also disrupted commercial activity all along the Mississippi and Missouri rivers and adjacent areas and destroyed thousands of acres of crops. While the waters have now receded, the ground is so saturated that heavy winter snow and spring rains could produce additional flooding well into next year.
This Chicago Fed Letter provides an economic overview of the size and scope of damage from this summer’s flooding. It also examines the potential impact of a natural disaster such as this on both the regional and the national economy.
The scope of the disaster and the economy of the affected area
As a result of the flood, the Federal Emergency Management Agency (FEMA) has declared 505 counties in nine states eligible for either individual or community assistance. The table shows the distribution of these counties by state. Of the nine states, the most severe damage occurred in Iowa, Illinois, and Missouri; within these states, certain counties were particularly hard-hit, such as Iowa’s Polk County (including the city of Des Moines) and Scott County (including the city of Davenport).
1. Eligibility for federal disaster relief
| Number of eligible counties | Percentages of state's counties | |
|---|---|---|
| Iowa | 99 | 100 |
| Missouri | 85 | 75 |
| Minnesota | 53 | 61 |
| Wisconsin | 48 | 67 |
| Kansas | 51 | 49 |
| South Dakota | 39 | 59 |
| North Dakota | 39 | 74 |
| Nebraska | 52 | 56 |
| Illinois | 39 | 38 |
| Total | 505 | 61 |
These 505 counties contain roughly 10% of the U.S. population and have a per capita income equivalent to the national average. Because of a heavy concentration of farms and agricultural jobs, population density over most of the area is low. While the affected region contains about 11% of total U.S. employment, it has nearly 20% of all farm employment. More than 450 of the 505 counties have over 120% of the U.S. average share of persons employed in farming. Finally, the concentration of manufacturing employment in most of the impacted area is below the national average.
The most widely circulated initial estimates put total losses at $12 billion, with $7 billion attributable to crop losses and $5 billion to property and nonagricultural income losses. As often happens with disaster loss estimates, these numbers were recently adjusted downward, to a total of $10 billion.2 At the same time, however, the crop production losses are proving to be steeper than initial estimates. Losses may rise again if soil conditions and high river levels cause new flooding with next year’s spring rains. In any case, a more accurate measure of losses will have to await a final accounting of the damages.
The blow to agriculture
Of all sectors of the Midwest economy, agriculture clearly suffered the most. The quantity and quality of the harvest of major crops, particularly corn and soybeans, were reduced by the floods and record rainfall. Crop losses occurred on land that produced subnormal yields and on land that produced no crops. An estimated 9 million acres were either unplanted or their crops were planted and destroyed, abandoned, or otherwise deemed unworthy of harvesting. This “lost” acreage was expected to produce 6% of the 1993 harvest of the region’s major crops. The states that lost the largest proportion of their acreage were Missouri (12%), Minnesota (11%), South Dakota (8%), and Iowa (7%).
In addition to the lost acreage, the heavy rains and slow-to-mature crops in many areas reduced yields on land that was harvested. Final tallies will not be available until January, but preliminary projections show that per-acre yields of corn and soybeans were substantially below normal in five of the nine states. In two of those states, Minnesota and North Dakota, about one-third of the expected yield was lost.
The lower yields plus the lost acreage significantly reduced the 1993 crop harvest now winding down in the affected area. Latest estimates suggest that the region’s corn harvest will be 29% below the banner level of 1992 and 12% below a “normal” year.3
Similarly, the soybean harvest is down an estimated 19% from last year and 9% below normal. Estimates of the economic value of the crop losses vary widely. Most of the variation depends on whether this year’s crops are measured against the record-setting harvest of 1992 or against a more typical one. Using average prices over the past five years, those two measures would place the combined corn and soybean losses between $2.2 billion and $6.2 billion.
Midwest agriculture is still at risk, and post-flood concerns are still apparent. In addition to crop losses, many farms also lost vital structures, facilities, and equipment, some of which have still not been repaired or replaced. Also, many farmers remain concerned about flood protection given the number of levees that failed or were weakened and may not be fully repaired before next spring’s rains. Of the 1,347 nonfederal levees, 1,043 (77%) were either breached or damaged. Federal levees fared better, with only 40 out of 229 failing. Renewed rains in September—the third wettest on record in St. Louis—hampered levee repair. Weather has also prevented the Army Corps of Engineers from completing the surveys of damaged levees that must precede repair or replacement. Since many levees are still not functioning properly, repeated flooding in some areas has prevented farmers from removing sand deposits or completing other post-flood tillage practices on their fields before winter. As a result, many fields are in poor condition and may have reduced yields next year.
Damage to property and infrastructure
An estimated 45,000 to 55,000 private homes either washed away or suffered major damage, and of these, only 20% carried flood insurance. Much of the coverage was with the federal National Flood Insurance program. Premiums for this program tend to be high (in one Illinois town, for example, $32,000 of coverage costs $350 annually), so homeowners tend to underinsure their property.
Between 35,000 and 45,000 commercial structures were damaged. While many businesses experienced interruptions or temporary closures, most of these avoided major damage because they had been sited on high ground. The largest problem for most businesses was the disrupted transportation into and out of the region. With the important exception of agriculture and some continuing transportation problems, particularly on the Mississippi River, most other manufacturing and retail businesses in the area have returned to fairly normal activity.
Virtually all forms of transportation on and across the Mississippi were interrupted by the flood. Barge traffic on the river between Cairo, Illinois, and Dubuque, Iowa, halted in early July and resumed on a restricted basis in late August. About 3,000 of the 25,000 barges that normally use the Mississippi were idled for up to two months, during which time the industry lost $4 million per day. Companies that use the barges for shipping also suffered. Some were delayed in getting their products to market, while others switched temporarily to more expensive means of transport.
As bridges, roads, and railroad tracks washed out or were damaged, rail, auto, and truck transportation had to be rerouted. Along the length of the Mississippi that forms the western boundary of Illinois, over 1,000 miles of road were closed and nine of the 25 nonrailroad bridges were shut down. Truck traffic had to detour, and commuting to work became difficult at best. Railroads had the same basic problem. Approximately 500 miles of track were under water or washed away. Nearly 25% of total U.S. rail traffic passes through the flood area, and rail shipping times were lengthened by up to four days because of rerouting. In all, Midwest railroads sustained an estimated $100 million to $200 million in damages.
Public infrastructure, including public roadways and bridges, public buildings, sewers, and water treatment facilities, were also severely damaged. Repairing the damage will be extremely costly—it will take about $2 billion—but repair is an essential step in returning the region’s economy to normal functioning. Federal assistance will compensate state and local governments for up to 90% of these costs.
Losses to the U.S. economy
The net loss to the U.S. economy from a natural disaster is often overstated by recitations of flood-related damages. In fact, a disaster may only disturb one segment of the economy while simultaneously transferring wealth to another with only a partial net loss overall. For example, revenues lost by waterway freight carriers may be partly offset by revenues gained by overland trucking. Similarly, the supply-induced rise in crop prices that typically follows an agricultural disaster can translate into higher earnings for farmers not hurt by the disaster, and it can significantly cushion the income losses of those whose crop harvest is only partially reduced by it. If one excludes any “loss” reimbursements such as crop insurance indemnities, the economic loss of the foregone crop production is shared between consumers of crops and the farmers whose crops were hit hardest.
Perhaps the most meaningful definition of economic loss due to a disaster is the value of the output of goods foregone—that is, the total net output that would have been produced had it not been for the disaster. Foregone output results for two reasons. First, natural disasters destroy productive capital stock such as roads, bridges, and factories, thereby reducing output until such time as the capital stock is restored. It also destroys householders’ durable goods such as cars and housing. Second, natural disasters can interrupt day-to-day business activity. For example, the flooding closed down otherwise navigable waters and kept workers from their jobs.
Foregone output resulting from the flood was reflected in national growth figures for the period. Advance estimates for the third quarter of 1993 incorporated downward adjustments for both gross domestic product (GDP) and personal income that were due to the flood. Personal income was reduced by $9 billion. Uninsured losses to residential and business property alone reduced rental income of persons by some $2 billion and proprietors’ income by about $1 billion. Such reductions will probably not be apparent from aggregate growth figures in coming quarters as vigorous rebuilding begins and normal production activity resumes.
Typically after a disaster, aggregate growth figures appear to change initial losses into economic gain as firms and households rebuild their capital stock, and activity in the construction industry sharply boosts spending and income. Rebuilding following Hurricane Andrew, along with the resumption of ordinary business, has been credited as partially responsible for the strong annualized national growth rate of 5.7% in the fourth quarter of 1992.
However, such rebuilding does not necessarily represent an actual economic gain to the nation. Rather, it may be simply a partial or complete replacement of the capital stock that was lost in the disaster. If this is the case, then in the long term the nation’s product will probably not exceed what it would have been without the disaster. Actual losses from foregone output may go largely undetected because the diminished growth takes place in small amounts spread over many years.
Losses to the region’s economy
The losses to a region’s economy depend partly on who pays for the rebuilding of capital stock. The region itself may pay, or the entire nation may through national tax/spending programs and/or through insurance companies whose owners and customers may be scattered throughout the nation. If a disaster’s losses are fully covered by the national government and insurance companies, and if damages are reimbursed promptly, a region’s losses can be fully offset, and higher levels of economic growth can occur than would have otherwise. In the case of the 1993 flood, national coverage of lost capital stock will not be as extensive as Midwesterners might have hoped. Government disaster aid and private insurance will only partially compensate for agricultural losses and the rebuilding of private homes and other damaged structures.
For this reason, even though daily activities have resumed, short-term rebuilding will not be as speedy or extensive as it has been elsewhere after some natural disasters. Moreover, because residents have suffered uncompensated personal losses in long-term personal wealth such as damaged housing, they may reduce their spending in coming years. And because businesses have lost productive capacity, the flooding will cause small, hard-to-detect reductions in their productive output for years to come.
Conclusion
The Midwest’s losses from this year’s flooding are not as high as initial assessments suggested. However, when one considers the real meaning of a region’s economic losses as opposed to popular reports of the flood’s damage, it is clear that the region experienced some very real but hard-to-measure losses. Compared to other short-lived disasters such as hurricanes or earthquakes, the flood interrupted daily economic activity for a long time. Moreover, losses to Midwest business and household capital stock will not be fully reimbursed by private insurance and government aid; as a result, the pace of economic growth will be slightly impaired in coming years.
Looking to the future, many Midwesterners are wondering whether to reinvest in private housing and farms located on flood plains. At the same time, the nation’s scientists and engineers are reassessing the system of levees and water diversion projects throughout the Mississippi Basin. Some believe this year’s rainfall may not have been purely episodic, and that the flood’s damage resulted from a combination of intensive land development along the river and an actual inability to prevent flooding despite the extensive system of levees.
Tracking Midwest manufacturing activity
Manufacturing output index (1987=100)
| Sept. | Month ago | Year ago | |
|---|---|---|---|
| MMI | 120.0 | 119.5 | 110.5 |
| IP | 112.0 | 111.6 | 106.7 |
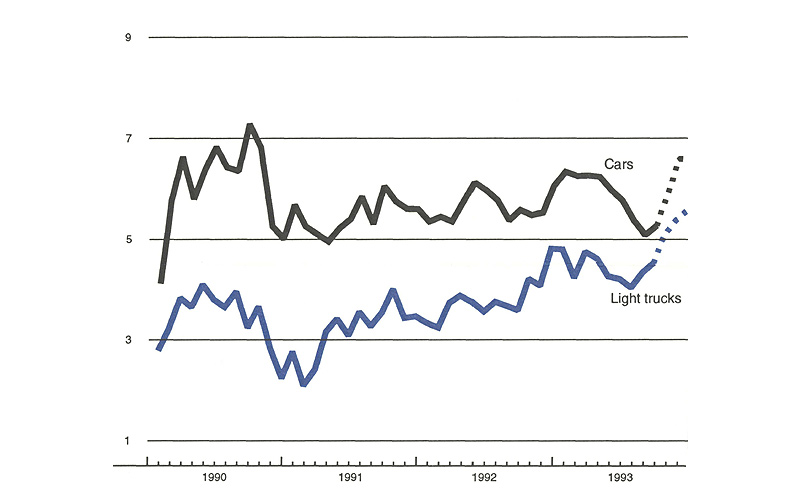
Motor vehicle production (millions, saar)
| Sept. | Month ago | Year ago | |
|---|---|---|---|
| Cars | 5.3 | 5.1 | 5.6 |
| Light trucks | 4.6 | 4.3 | 3.6 |
Purchasing Managers' Surveys: production index
| Oct. | Month ago | Year ago | |
|---|---|---|---|
| MW | 64.7 | 67.5 | 53.4 |
| U.S. | 56.0 | 53.5 | 54.3 |
Motor vehicle production, millions (saar)
Sources: The Midwest Manufacturing Index (MMI) is a composite index of 15 industries based on monthly hours worked and kilowatt hours. IP represents the FRBB industrial production index for the U.S. manufacturing sector. Autos and light trucks are measured in annualized physical units, using seasonal adjustments developed by the Federal Reserve Board. The PMA survey for the U.S. is the production components of the NPMA survey and for the Midwest is a weighted average of the production components of the Chicago, Detroit, and Milwaukee PMA survey, with assistance from Bishop Associates and Comerica.
Light vehicle production rose modestly in September, after declining relatively sharply during the summer. The summer slowdown has been attributed to unique assembly interruptions arising independently of changes in demand. Sales also softened during the summer and early fall, partly because of inventory shortages prompted by the production slowdown.
Auto sales strengthened in October, and assembly schedules call for a significant increase in the fourth quarter, as they originally did for the third quarter. The results of purchasing managers’ surveys in Detroit and western Michigan strengthened considerably in September and October, largely due to responses from the auto industry. A small underbuild still developed in October, however, and any fourth quarter output gains that do arise will partly represent the recovery of postponed production.
Notes
1 Data in this article were derived from a number of sources. National and regional information concerning economic growth are mainly from the U.S. Department of Commerce, Bureau of Economic Analysis. Nonagricultural flood damage data are largely from the Federal Emergency Management Agency.
2 The initial estimate of property losses from Hurricane Andrew was nearly $40 billion. That number has since been adjusted to $20 billion to $22 billion.
3 A normal harvest year is defined as the average annual yield from 1987-91, excluding the drought year of 1988.


