

The following publication has been lightly reedited for spelling, grammar, and style to provide better searchability and an improved reading experience. No substantive changes impacting the data, analysis, or conclusions have been made. A PDF of the originally published version is available here.
While 1995 witnessed the soft landing that had been widely forecast, the economic outlook for 1996 is for continued modest growth following this slowdown. The Federal Reserve Bank of Chicago held its Ninth Annual Economic Outlook Symposium on December 8, 1995. More than 50 economists and analysts from business, academia, and government attended the symposium. The sessions focused on the question: Can the consumer keep the expansion alive? Prior to the symposium, participants were invited to submit both annual and quarterly 1996 forecasts for many gross domestic product (GDP) components, as well as several other economic series. Thirty-five individuals provided forecasts, and a consensus forecast was presented at the symposium. This Fed Letter will review the accuracy of the forecast for 1995 presented at last year’s symposium and summarize the 1996 Economic Outlook Symposium.
The economy in 1995—forecast and results
The expectation at last year’s Economic Outlook Symposium was for growth in real GDP to average 2.4% for the fourth quarter of 1994 through the first three quarters of 1995, a reduction from the extremely strong 4.4% pace of the previous four quarters. Figure 1 shows that while the forecast was accurate as to the downward direction in the growth rate, the softening was not as significant as expected. Real GDP averaged a fairly strong 3.3% over the four quarters through the third quarter of 1995.
1. 1995 forecast of real GDP
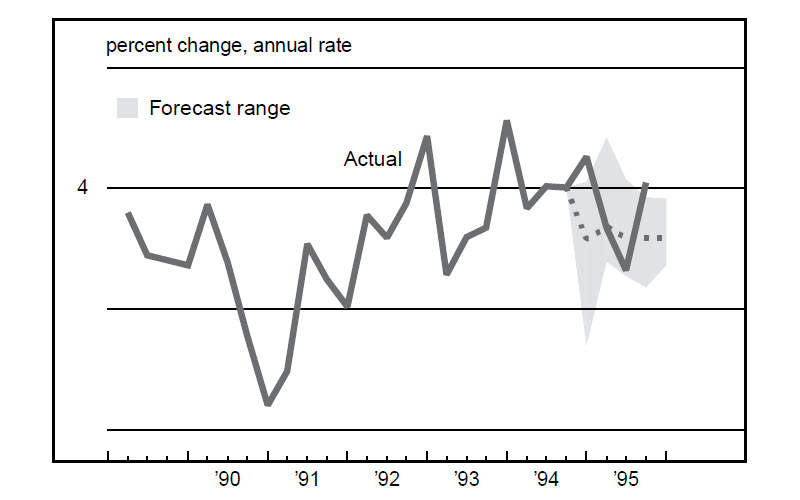
Source: U.S. Bureau of Economic Analysis, National Income Product Accounts, various years.
Among components of real GDP which were stronger than forecast were personal consumption expenditures, business fixed investment, and change in business inventories. However, many of the other economic series (both components and indicators) that are used to measure strength in the economy were weaker than expected, including residential construction, net exports, and government expenditures. Industrial production, which was forecast to increase by 3.6%, averaged a growth rate of 3.1% over the four quarters. Sales of cars and light trucks, which were expected to average 15.3 million units, fell short by nearly half a million units. The 1995 forecasts were too pessimistic on the unemployment rate, which was 0.3% lower than forecast. Many of the forecasters expected the inflation rate to increase to 3.5% from an average 2.8% for the previous four quarters; in fact, it averaged 2.7%. Overall, the forecasters were surprised by the strength in the economy in 1995, especially in business fixed investment, and the relative weakness in the rate of inflation.
Looking ahead to 1996
1996 is generally expected to be an uneventful year in economic terms. This is not necessarily a bad thing—consider that not a single forecaster is expecting a recession over the next five quarters. Figure 2 summarizes what forecasters are expecting both in 1995 (fourth-quarter numbers not known) and in 1996. The consensus forecast is for 1995 real GDP to average 3.2%. The forecast for 1996 real GDP is 2.5%. This decline of 0.7% is based on softening in the growth rates of personal consumption expenditures, business fixed investment, and change in business inventories. Residential construction is expected to grow by 2.1% this year. The other area where some slight improvement is forecast to occur in 1996 is net exports, which are expected to average –$121.6 billion. Government is forecast to match its no-growth performance of the past year.
2. Mean forecasts from the 1996 Economic Outlook Symposium
| 1994 | 1995 | 1996 | |
| Real GDP | 4.1% | 3.2% | 2.5% |
| Personal consumption expenditures | 3.5% | 2.9% | 2.4% |
| Business fixed investment | 13.7% | 14.5% | 6.8% |
| Residential construction | 8.6% | –1.9% | 2.1% |
| Change in business inventories (bil. constant $) | $47.8 | $37.1 | $28.9 |
| Net exports of goods and services (bil. constant $) | –$110.0 | –$124.2 | –$121.6 |
| Government purchases of goods and services | –0.8% | 0.0% | 0.1% |
| Industrial production | 5.3% | 3.5% | 2.5% |
| Cars and light-truck sales (millions) | 15.1 | 14.7 | 14.7 |
| Housing starts (millions) | 1.45 | 1.35 | 1.34 |
| Unemployment rate | 6.1% | 5.6% | 5.7% |
| Inflation rate (consumer price index) | 2.6% | 2.9% | 2.8% |
| Prime rate | 7.14% | 8.78% | 8.35% |
| Federal Reserve trade-weighted dollar | –2.0% | –6.4% | 1.5% |
Following the slowdown in real GDP, industrial production is expected to slow from 3.5% to 2.5% in 1996. Cars and light trucks are expected to continue their relatively modest output rate of 14.7 million units. Housing starts are expected to follow the 1.35 million-unit pace that they experienced in 1995. The unemployment rate is forecast to rise by one-tenth of a percent to 5.7%. Inflation is forecast to decline by one-tenth of a percent to 2.8% in 1996. The prime rate is forecast to fall by over 40 basis points next year. Finally, the trade-weighted dollar is expected to rise by 1.5%.
Figure 3 shows that the consensus forecast for quarterly GDP is for a fairly weak fourth quarter 1995 with growth in real GDP of 2%, increasing and holding steady at around 2.5% in 1996. Personal consumption expenditures, business fixed investment, residential construction, and change in business inventories all display patterns of softening in their growth rates as 1996 progresses. Only net exports are expected to strengthen going into 1997.
3. 1996 forecast of real GDP
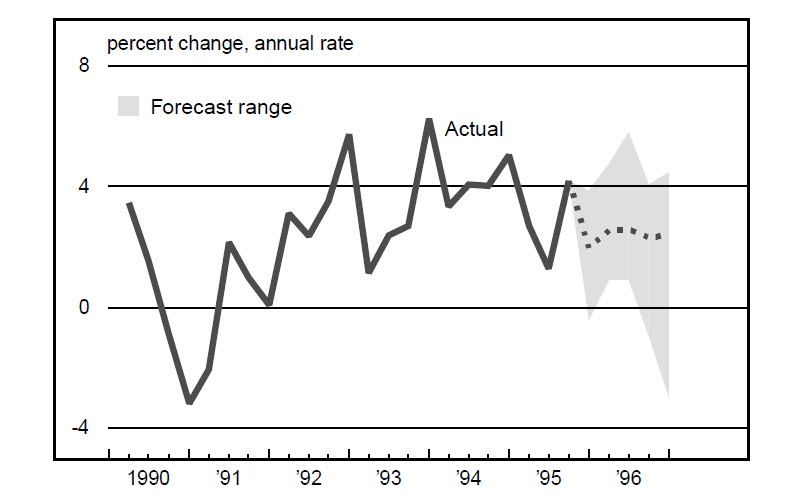
Source: U.S. Bureau of Economic Analysis.
Looking at the quarterly patterns for the other economic series, both industrial production and the trade-weighted dollar are expected to grow at the same pace as they have recently. Cars and light-truck sales and the unemployment rate are expected to hold relatively steady at current levels. The prime rate and housing starts are expected to decline over the forecast horizon. Figure 4 illustrates that a slight pickup in inflation is anticipated during 1996.
4. Inflation rate

Source: U.S. Department of Labor, Bureau of Labor Statistics.
The consumer sector holds its ground
The personal consumption expenditures component comprises over two-thirds of GDP. Knowing how the durables sector, which is the most volatile part of consumer expenditures, will perform in 1996 is key to understanding whether the consumer will keep the economic expansion alive. An economist from a Big 3 auto manufacturer indicated that the consensus forecast of 2.5% growth in real GDP leaves little room for growth in the auto market. This economist projected light-vehicle sales of 14.9 million units in 1996, up only 1% from 1995 levels. Expectations are for the Federal Reserve to ease monetary policy soon, but growth in consumption may still be at an even lower rate than GDP growth. One potential positive effect on auto sales in 1996 is that the strong sales of the late 1980s may generate some new sales as owners consider replacing those seven- to ten-year-old vehicles. However, improvements in durability may dampen replacement demand, and the bulk of the growth in auto sales is likely to be trend-driven. Population growth, household formation, employment growth, consumer debt loads, and prices of autos are factors that will determine this trend. In the event that the federal budget talks drag on with no significant easing from the Federal Reserve, rising interest rates could bring consumption to a lower level than anticipated.
An economist from a major home appliance manufacturer indicated that sales for the core group of appliances (i.e., washers, dryers, refrigerators, ovens, ranges, dishwashers, and freezers), which tend to move with the business cycle, are holding steady at about 31 million units per year. This economist believes appliance producers will try to pass-through some price increases during 1996, but that they will not be successful. Competition from within the industry will hold prices down. Very little growth is expected in home appliance sales in 1996. One issue that bears watching is the level of consumer debt. Should the consumer debt service burden continue to rise, it may also have a dampening effect on economic growth.
The investment sector remains relatively strong
While the investment component of GDP is expected to increase by only half as much in 1996 as in the past year, it still represents a key driver to the economy. Like consumer durables, investment is an extremely volatile component of GDP, and the heavy-duty truck segment is arguably its most erratic performer. An analyst from a heavy-duty truck research company forecasts a soft landing for the U.S. economy. At this time, two-thirds of all manufactured goods are hauled by truck. Trucks continue to gain share of the freight market because the manufactured goods that are transported by truck are experiencing growth. However, for 1996, slow growth in industrial production is expected to lead to an 18% decline in sales and a 22% decline in production of Class 8 heavy-duty trucks. While the backlog-to-build ratio reached nearly 14 months during 1994, it has more recently slipped to just over six months. The current level is relatively good, when historically the ratio has been under four months. Due to the waning of pent-up demand for heavy-duty trucks after two record production years in 1994 and 1995, the industry may be facing a very tough year in 1996. However, forecast production levels for 1996 should still make it the fourth-best year in the industry’s history.
A representative from a machine-tool association announced that during 1995 the U.S. returned to being the top consumer of machine tools in the world. Research and development expenditure in the machine-tool industry is the highest of any manufacturing industry. This analyst is cautiously optimistic regarding domestic sales and production in 1996. The growth potential for this industry during 1996 is limited by the relatively slow growth forecast for the economy; however, export markets should provide growth opportunities. Sales to China have been very encouraging, and South America is expected to provide $9 billion in machine-tool orders over the next five years. While orders are estimated to have risen by 10% during 1995, they are forecast to grow by only 5% in 1996.
Basic materials industries are at the leading edge
A consultant to the steel industry expects steel shipments to be up a modest 2% to 3% in 1996. Roughly 75% of all steel goes into construction and producer durable equipment. The other 25% goes into consumer durable equipment. Imports of steel continue to decline. A shift in the types of steel being produced is anticipated, away from sheet steel, which is used in the auto and appliance industries, toward structural steel, which is used for plant and equipment applications. The proportion of domestic steel used in auto production is expected to increase in 1996 as the share of domestically produced autos continues to increase. Continued strong plant and equipment expenditures during 1996 should also help the steel industry.
An analyst from a paper manufacturer stated that there is almost a one-to-one correspondence between paper production growth and real GDP growth. The analyst forecasts paper and paperboard production to grow by 2.5% in 1996. As paper prices have risen dramatically over the last year, consumers are shifting to lower grades of paper and considering ways of using the product more efficiently. The industry is now beginning to deal with the problem of overcapacity; it had been operating at over 100% levels. As a result, downward pressure on paper prices is anticipated.
Conclusion
The soft landing forecast for 1995 turned out to be bumpier than expected but generally on target. A trend-driven growth rate from this lower level of GDP growth is forecast for 1996, and most likely the quarterly path will be far less smooth than indicated in the consensus forecast. Nevertheless, the symposium found widespread support for slow but positive economic growth in the year ahead. If accurate, this moderate growth rate may mean some very good news on the inflation front, as price pressures from the economy will be very slight.
Tracking Midwest manufacturing activity
Manufacturing output indexes (1987=100)
| November | Month ago | Year ago | |
| MMI | 144.1 | 141.9 | 139.8 |
| IP | 124.9 | 124.7 | 122.7 |
Motor vehicle production (millions, seasonally adj. annual rate)
| November | Month ago | Year ago | |
| Cars | 6.0 | 6.1 | 6.5 |
| Light trucks | 5.4 | 5.3 | 5.4 |
Purchasing managers’ surveys: net % reporting production growth
| November | Month ago | Year ago | |
| MW | 52.1 | 62.0 | 67.0 |
| U.S. | 45.8 | 48.4 | 64.5 |
Manufacturing output indexes, 1987=100

Sources: The Midwest Manufacturing Index (MMI) is a composite index of 15 industries, based on monthly hours worked and kilowatt hours. IP represents the Federal Reserve Board industrial production index for the U.S. manufacturing sector. Autos and light trucks are measured in annualized units, using seasonal adjustments developed by the Board. The purchasing managers’ survey data for the Midwest are weighted averages of the seasonally adjusted production components from the Chicago, Detroit, and Milwaukee Purchasing Managers’ Association surveys, with assistance from Bishop Associates, Comerica, and the University of Wisconsin–Milwaukee.
The Midwest Manufacturing Index for November rebounded from its dip in October, reaching its highest level of the year. While the Federal Reserve’s production index for manufacturing followed a similar pattern, the national index was flat over the last three months. Thus, the Midwest appears to be recovering from the midyear inventory correction more quickly than the rest of the nation.
The recent pattern in the MMI is consistent with reports from Midwest purchasing managers’ surveys. Aside from auto-related industries, most surveys for December were indicating expanding orders and production in the region. With light-vehicle production virtually flat and auto inventories rising, some softening in this sector is to be expected and could continue into the first quarter of 1996.


