

The following publication has been lightly reedited for spelling, grammar, and style to provide better searchability and an improved reading experience. No substantive changes impacting the data, analysis, or conclusions have been made. A PDF of the originally published version is available here.
The Federal Reserve Bank of Chicago recently held its Auto Outlook Symposium on June 3 in Detroit. Besides generating a consensus economic forecast, the meeting provides a forum for in-depth discussions on the economy and the auto industry. This year’s meeting provided a profile of the surging activity in the industry as well as a critical assessment of its ongoing structural adjustments. Although rapid sales gains and the improved position of the domestic industry have significantly bolstered the regional and national economy, the optimism at the meeting was somewhat tempered. This Fed Letter reviews the highlights of the Auto Outlook Symposium and the extended outlook provided by participants.
The consensus outlook is upbeat
Like most other forecasts, the consensus from forecasts submitted for the meeting was relatively upbeat. Whereas in December, participants had produced a consensus GDP forecast for the year just below 3%, the more recent consensus was 3.6 %. The increased optimism extended to all segments of the economy, with the exception of international trade, but seemed to stem especially from the continued growth in certain core segments (see figure 1).
1. Consensus forecast*
| 1993 | 1994 | 1995 | |
|---|---|---|---|
| percent | |||
| GDP (real) | 3.0 | 3.6 | 2.8 |
| Personal consumption expenditures | 3.3 | 3.5 | 2.6 |
| Investment | 11.8 | 11.3 | 7.5 |
| Residential construction | 8.7 | 10.9 | 2.6 |
| Government purchases | –0.7 | –0.4 | 0.5 |
| billion dollars | |||
| Changes in business inventories | 14.3 | 23.4 | 21.2 |
| Net exports | –76.5 | –107.7 | –109.4 |
Personal consumption expenditures are expected to increase modestly during 1994-95, although the rate of growth is expected to slow in 1995. Business investment should increase through mid-1995, although once again tempering in 1995. An added plus is expected from growth in inventories and residential construction.
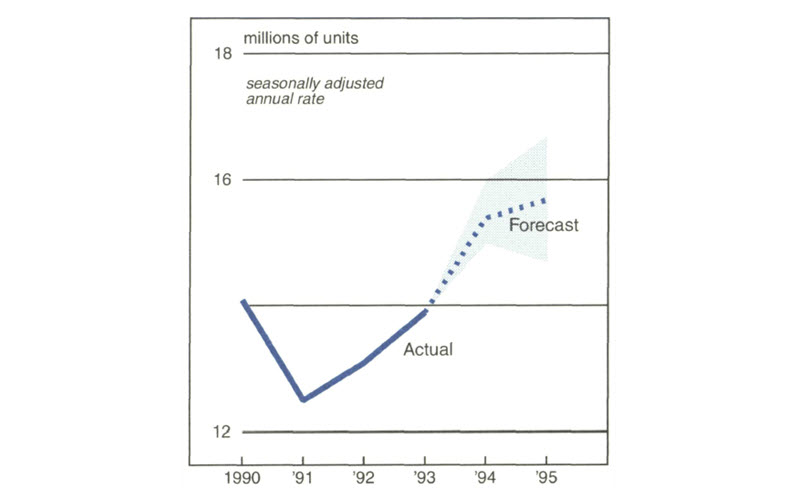
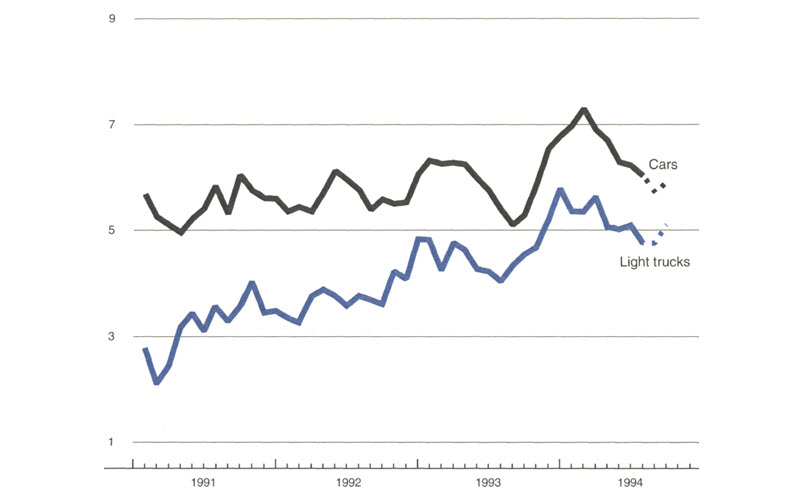
One of the primary causes of the increased optimism has also been the resurgence in durable goods, especially the motor vehicle industry. The sales surge in late 1993 and early 1994 was somewhat unexpected by participants. In their initial assessments last December, they projected 1994 light vehicle sales at 14.7 million units. Although discounting the strong pace of the first four months somewhat, participants continued to be relatively upbeat, projecting strong build activity from late 1994 through 1995. The consensus for light vehicle sales was 15.4 million for 1994 and 15.7 million units in 1995. Although a few forecasts were more cautious, almost all were above 15 million and the median was 15.5 million in 1994 (see figure 2).
2. Car and light truck sales
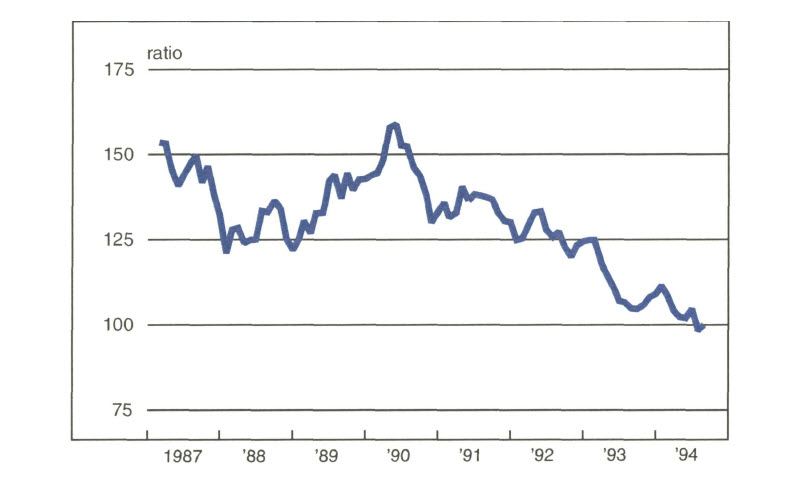
One key to resurgence has been the rebirth of the Big Three. They are expected to gain market share during the remainder of the year, partly because Japanese nameplates have not fully incorporated the appreciation of the yen into pricing (see figure 3). In spite of the growing pricing disadvantage of Japanese nameplates, competition should remain intense. Some participants argued that the surge in the domestic industry should not be exaggerated, as Japanese nameplates have performed well despite a substantial price disadvantage. In the current environment, offsets in the form of rebates and leasing are assisting Japanese manufacturers in attempting to maintain market share. Also, the continued substitution of U.S.-produced vehicles at transplant facilities for imports has boosted the position of major manufacturers.
3. Yen to dollar ratio
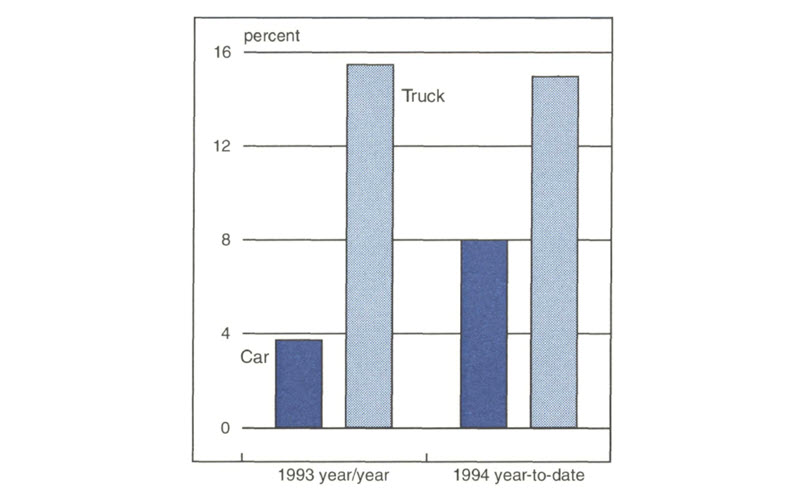
Overall, however, the motor vehicle sales market remains fragmented. Some segments, such as light trucks, have soared, while others, including many passenger car lines, have only crawled forward. One byproduct of this fragmentation has been the increasing imbalance between sales and production capacity. Consequently, although the market continues to improve, a primary concern remains that light truck capacity constraints may limit sales gains (see figure 4).
4. Vehicle sales
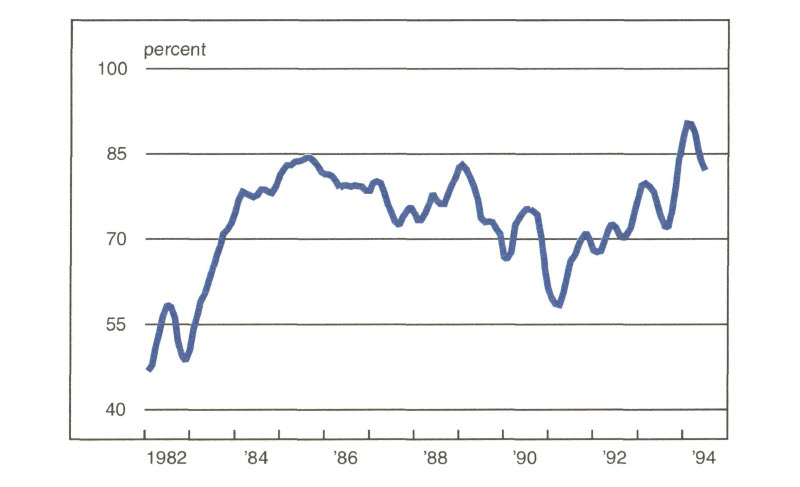
Another important question is what impact capacity constraints will have on sales heading into 1995. Domestic manufacturers have increased efforts to expand light truck capacity, but it will take some time before they can alleviate current supply difficulties. In the meantime, tight supplies may constrain sales; the supply shortage appears to have been one of the key causes of the drop-off in sales in May and June. (Figure 5 tracks the capacity utilization rate for motor vehicles and parts during the last decade.) The outlook for the third quarter was assessed by participants as likely being constrained substantially due to supply difficulties. Although once again the consensus view expects sales to rebound as increased production occurs during the fourth quarter, in the near term the statistics on the industry may appear confusing.
5. Capacity utilization: motor vehicles and parts
With the exception of some concern over interest rates, oil prices, and a weak stock market, most external economic developments look favorable for the auto industry. Among the more bullish factors are modest income growth, reduced consumer debt, positive consumer attitudes (especially toward purchasing a vehicle), and most important, pent-up demand. Although estimates vary somewhat, pent-up demand probably stands between 4 million and 6 million vehicles. During the economic cycle the number of net vehicle additions above scrappage has been well below previous behavioral patterns; it now appears that the industry has turned the corner and pent-up demand is being satisfied. In this regard, the entry of consumers into the market to replace aged vehicles should boost growth through 1996.
In the extended term, the ongoing realignment of the market will continue to pose challenges. Dark clouds on the horizon include a number of unresolved issues, the largest one being the uncertainty about future government regulatory actions. Nevertheless, some participants remain bullish on the long-term outlook as well. Given buying propensities, population growth, and scrappage levels, the U.S. auto market is projected to continue expanding throughout the decade. Domestic manufacturers are expecting a peak in sales after 1995, with a sales level in excess of 17 million vehicles.
Finally, the continuing changes in sourcing of vehicles have also boosted the industry. Throughout the economic cycle, imports as a share of sales have fallen because of the Big Three recapture of market share and the proliferation of transplants. An additional spark to regional and national economic activity is being provided especially by the substitution of transplant-produced vehicles for imports. Additionally, transplants are increasingly using U.S.-produced content and buying from increasing numbers of U.S. suppliers. The increase in domestic content provides an added boost to Midwest economic activity in particular.
Despite improvement, structural adjustments continue
Although all participants stressed that improved sales have benefited the industry and the national economy as a whole, numerous questions still linger. Primary are those relating to the ongoing restructuring of the industry, especially the relationships between finished producers and suppliers. The current improvement in sales may somewhat lessen the pressure to adjust these relationships. However, the increasing competition within the industry that motivated such adjustments is continuing and may even be accelerating. Thus, despite the recovery, auto manufacturers can be expected to continue making adjustments.
The main question facing suppliers remains pricing pressures. Although the immediate pressure to reduce prices substantially has dissipated, constraints on price increases are still very prevalent. In fact, price cuts are not uncommon, although perhaps less frequent than a few years ago. The pricing process now follows a different format, incorporating long-term agreements and new pricing mechanisms. International competition strongly constrains price increases, to the extent of producing reductions in some segments of the industry. The resulting impact on profitability is of course considerable, necessitating gains in productivity to yield acceptable results.
The impact of pricing difficulties is compounded by other operational adjustments occurring downstream. Suppliers must not only accept price constraints but also increase their responsibility in the manufacturing process. The increase in responsibility stems first from the proliferation of outsourcing of products to suppliers. Suppliers now must provide the capacity to produce and accept the risk of having excess or unused capacity. They must also take on more of the tasks of design and engineering. These shifts not only involve risk but also added costs to suppliers when their compensation levels may be falling. Given these pressures, it is not surprising that the supplier base continues to consolidate, a trend that will likely continue. The future will probably bring still further pressures because of the increasing globalization of the industry.
Of course, there is an upside to the intense competitive pressures and continuing operational changes; as a result of this restructuring, the domestic downstream industry has regained its competitiveness internationally. A number of external opportunities are surfacing, especially growth in sales to foreign nameplates, mostly transplants. Part of this renewed competitiveness is due to the depreciation of the dollar, but much is due to the streamlining of the domestic industry.
The recent increase in sales has boosted suppliers as well as finished-goods producers. Shipments for most segments of the industry increased in excess of 10% during the last few quarters, including not only first-tier suppliers but those further downstream, including steel and machine tool producers. One unique current problem, at least in the context of recent history, is capacity constraints. Some segments of the industry are running at full capacity including overtime, and some observers believe this will provide some cover for price increases. If so, it might be more accurate to call them a “recapture of past price reductions.” Additionally, competitive pressures and surplus capacity abroad continue to constrain pricing. Imports of key materials such as steel have increased dramatically over the last quarter and must still be factored into any assessment of the market. The market will continue to be shaped by growing competition, and profit increases will have to be generated through cost reductions and gains in productivity.
Assessing the extended term
Observers expect the market to continue growing until 1997 and likely slow from there. For the longer term, however, a number of questions remain about the underlying strength of sales. Key to long-term sales growth is an increase in vehicles in operation greater than the underlying scrappage rate. Such increases can be generated by increased household penetration and/or increases in the number of households. Although there is some potential for growth in all these areas, it does not appear robust.
In fact, observers expect a number of developments to continue affecting the rate of expansion of vehicle sales. Older vehicles and a reduction in the scrappage rate due to improved quality and vehicle life expectancy is one factor. More fundamentally, there remains some concern over consumers’ ability to afford vehicles. On the basis of number of weeks of family income to purchase an average vehicle, vehicles have become less affordable over the last 20 years. Although this may be offset partially by extensions in maturity and/or, more recently, leasing, whether or not the industry has fundamentally corrected the imbalance remains an issue. Additionally, many segments of the population have experienced a substantial erosion in their ability to purchase a vehicle beyond the aggregate numbers. Nontraditional households in particular have experienced a substantial decline with regards to vehicle affordability. This development in conjunction with extensions in the operating age of vehicles raise substantial concerns for the industry as it moves beyond the immediate surge. Participants cited all these factors as concerns that will undoubtedly be discussed at future symposium meetings.
Tracking Midwest manufacturing activity
Manufacturing output index (1987=100)
| June | Month ago | Year ago | |
|---|---|---|---|
| MMI | 131.9 | 131.3 | 118.6 |
| IP | 118.0 | 117.8 | 111.2 |
Motor vehicle production (millions, seasonally adj. annual rate)
| July | Month ago | Year ago | |
|---|---|---|---|
| Cars | 6.0 | 6.2 | 5.4 |
| Light trucks | 4.8 | 5.1 | 4.0 |
Purchasing Managers’ Surveys: net % reporting production growth
| July | Month ago | Year ago | |
|---|---|---|---|
| MW | 69.4 | 72.4 | 52.3 |
| U.S. | 61.0 | 59.8 | 51.7 |
Motor vehicle production (millions, seasonally adj. annual rate)
Sources: The Midwest Manufacturing Index (MMI) is a composite index of 15 industries based on monthly hours worked and kilowatt hours. IP represents the Federal Reserve Board industrial production index for the U.S. manufacturing sector. Autos and light trucks are measured in annualized physical units, using seasonal adjustments developed by the Board. The purchasing managers’ survey production data for the Midwest are weighted averages of the production components from the Chicago, Detroit, and Milwaukee Purchasing Managers’ Association surveys, with assistance from Bishop Associates and Comerica.
Light vehicle output has been declining rather sharply during recent months. Production difficulties associated with model changeovers and new introductions have proceeded at a higher pace than the seasonal norm. In addition, automakers have been bumping up against capacity constraints for some model lines (particularly light trucks) at a time of the year when seasonal factors anticipate production gains. Current assembly schedules suggest that output will flatten out over the balance of the third quarter.


