

The following publication has been lightly reedited for spelling, grammar, and style to provide better searchability and an improved reading experience. No substantive changes impacting the data, analysis, or conclusions have been made. A PDF of the originally published version is available here.
Since the last recession, average unemployment durations have been surprisingly high given levels of other labor market indicators. Recently, some have pointed to this as evidence that there is more labor market slack than is commonly believed.1 Their argument is that the long-term unemployed are willing to accept almost any job, even jobs with reduced wages. Thus, though there currently are relatively few unemployed workers, enough of them are sufficiently desperate that wage pressures are minimal. (A possible corollary is that inflation concerns have been exaggerated and monetary policy has been overly restrictive.)
However, one could also argue that given any level of the unemployment rate, higher average durations should be associated with greater labor market tightness. This might be the case if many of the long-term unemployed lack the skills employers require and, consequently, exert less restraint on wages than the short-term unemployed. This Fed Letter examines these arguments and offers some preliminary time-series evidence on the significance of unemployment durations for current inflationary pressures.
Unemployment durations
Unemployment statistics are derived from the Current Population Survey (CPS), a monthly mini-census of U.S. households. Respondents aged 16 years and older are classified as either employed, unemployed, or out of the labor force. The unemployment rate is the fraction of the labor force that is unemployed, and the average unemployment duration is the mean number of weeks the unemployed have been looking for work.
Most unemployment spells are relatively short, but an important minority are quite long. This skewness is reflected in the median duration being considerably shorter than the mean. For example, in December 1995 the mean duration was 16.2 weeks, but the median duration was only 8.2 weeks. Thus, the majority of the unemployed were looking for work significantly less than 16.2 weeks. However, those experiencing very long spells brought the mean up to 16.2.
The fact that most unemployment spells are short is evidence that the labor market is more dynamic in the U.S. than Europe, where long spells are the norm. Even in the U.S., however, long spells account for a significant portion of unemployment. For instance, in December 1995, 16.4% of the unemployed had been out of work for more than 26 weeks. (This is still low compared to Europe, where typically more than 60% have been unemployed six months or more.)
The longer workers are unemployed, the less likely they are to find work in the next month. There are two possible reasons for this. First, most of those who can find work easily do so quickly, leaving the remaining pool of unemployed workers weighted toward those facing special obstacles. Second, long-term unemployment may erode skills and demoralize workers, causing them to take even longer to find work.
Finally, it is worth noting that average duration is a mean calculated over spells that are “in progress” at a given date. For two reasons, this differs from the expected duration of a completed spell. First, most of the unemployed will continue to be unemployed after they have been surveyed (which will not be accounted for in the calculation). Second, the calculation weights long spells more heavily than short. For instance, a two-week spell will at most be counted in the calculation one month, while a 26-week spell could be counted six months in a row. This second effect is stronger, so that a random worker becoming unemployed in December 1995 will on average find work in something closer to 14 weeks.
Evolution over time
Figure 1 plots the unemployment rate and average duration over the last 30 years. These series historically have moved up and down together over the business cycle, with average durations lagging the unemployment rate by a few months. Since the unemployment rate is itself a lagging indicator, it is not surprising that average unemployment duration is one of the last economic indicators to show improvement after a recession.
1. Unemployment rate and average unemployment duration
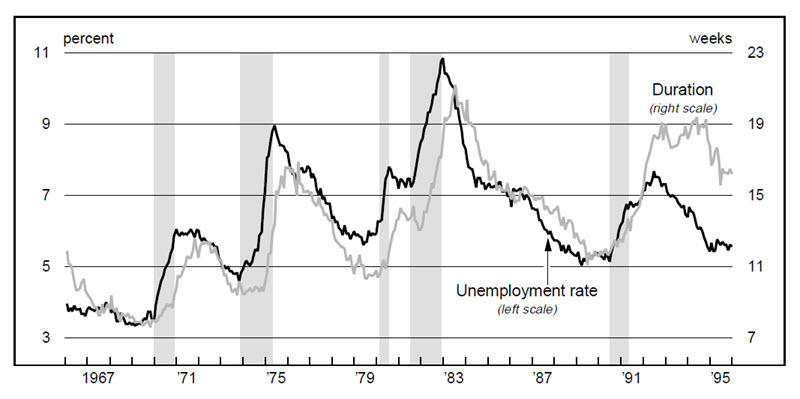
Source: U.S. Department of Labor, Bureau of Labor Statistics, various releases.
Durations have been abnormally high relative to the unemployment rate since at least the 1990–91 recession (figure 1). Durations were higher during that recession than during the 1975 recession, even though the latter was much worse in terms of unemployment. Nearly five years after the end of the last recession, average durations remain near the highest levels experienced during the 1975 recession and are comparable to those prevailing in December 1984, when the economy was barely two years out of its worst postwar recession and the unemployment rate was 1.7 percentage points higher.
Figure 1 shows that average unemployment durations recently have been falling quite rapidly. It is too soon to tell, however, whether durations are returning to a more normal level relative to unemployment.
Figure 2 shows the flip side to high unemployment durations. That is, it plots the total unemployment rate along with the fraction of the labor force unemployed one month or less. The latter series also moves up and down with the unemployment rate. (In contrast to average duration, though, it slightly leads unemployment over the business cycle.) For the last two years, the fraction of the labor force newly unemployed has been as low as anytime since the 1960s.
2. Unemployment rate and rate of new unemployment
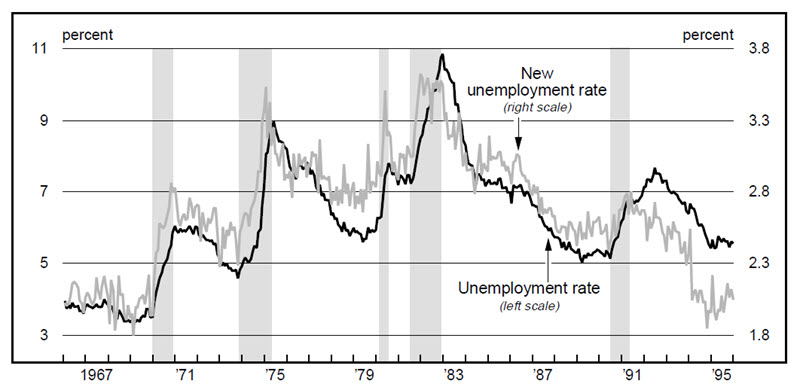
Source: U.S. Department of Labor, Bureau of Labor Statistics, various releases.
Underlying forces
During the last recession an unusually high fraction of layoffs were permanent rather than temporary. Since the transitions associated with permanent layoffs are obviously more difficult, this trend may have played a part in the rise of average durations.
The last recession was also unusual in that it was relatively severe for white-collar workers, but relatively mild for blue-collar workers. This is not to say that white-collar workers had it worse than blue-collar workers, just that blue-collar unemployment rates exceeded white-collar rates by less than usual. At any point in time, white-collar workers are less likely to be unemployed. However, perhaps because they have more specialized skills, once unemployed they typically take longer to find appropriate reemployment. Thus, increased white-collar unemployment also may have contributed to higher durations.
Longer-term trends also may have played a role in increasing durations. Indeed, if one looks closely at figure 1, the trend toward longer durations is visible well before 1990. For instance, while durations were substantially higher relative to unemployment following the last recession than following the 1981–82 recession, they were also somewhat higher relative to unemployment after the 1981–82 recession than after the 1975 recession.
Juhn, Murphy, and Topel (1991) examined the trend toward higher male unemployment from 1967 to 1989 using individual workers’ CPS records.2 They found that increasing unemployment durations, which began to appear about 1970, accounted for much of the increased unemployment over the period. They also found that the increase in unemployment was most pronounced at the low end of the skill distribution. For instance, unemployment in the lowest decile of the wage distribution more than doubled, while it was essentially unchanged for those above the 60th percentile of the wage distribution.
Juhn et al. interpreted the increase in unemployment (as well as a parallel increase in nonparticipation) for workers with lower skills as a labor supply response to an adverse shift in the demand for their skills. Consistent with this interpretation, the real wages of these workers declined precipitously over the 1970s and 1980s, while those above the 60th percentile of the wage distribution had approximately constant real wages.
Labor market tightness
The long unemployment durations experienced by many workers may represent an important economic problem, especially if the root cause is the failure of those workers to obtain skills necessary for long-term labor market success. It is less clear, however, what this phenomenon implies about inflationary pressures.
The view that high durations imply the labor market is less tight than the unemployment rate would ordinarily suggest appears consistent with the first two possible explanations mentioned in the last section. Workers who have been permanently laid off are presumably more receptive to jobs entailing wage cuts than those who expect to be recalled to their old jobs. Similarly, white-collar and other workers who have lost jobs where specialized skills were important likely realize their need to show flexibility with regard to wages.
Those who argue that high durations imply less inflationary pressure apparently believe inflation is largely determined by labor market conditions. This view is controversial because, in its extreme form, it ignores the role of money in determining inflation. However, even within such a framework, high durations could mean more inflationary pressure. First, the low rates of new unemployment, which are the corollary of high durations, may imply less fear of job loss and, hence, more aggressive wage demands. Second, the long-term unemployed are less likely to take jobs in a given month and thus may be less relevant to wage determination.
Moreover, if the current rise in unemployment durations reflects a continuation of the long-term trends identified by Juhn et al., then many of those experiencing long unemployment spells may lack the skills demanded by prospective employers. Thus, they may be less relevant for the determination of wages than other unemployed workers and high durations may be taken as a sign of labor market weakness.
Even if the reason for higher durations is the increased prevalence of permanent layoffs or job loss by white-collar workers, it may still be that, given the level of the unemployment rate, high durations signal tightness. Both of these phenomena could be signs that important structural change is occurring. Such change should tend to raise the “natural rate” of unemployment as workers are forced to make difficult transitions from one job to another. Because inflationary pressures should depend on the gap between the natural rate and actual unemployment, high durations would then signal greater labor market tightness.
Time-series evidence
Figure 3 displays forecasts of the rate of CPI inflation for 1996 based on two simple statistical models. Both are vector autoregessions that contain changes in the monthly rate of CPI inflation. In addition, the model whose forecast is shown in the first row contains changes in the unemployment rate, while the model generating the second row contains changes in the unemployment rate as well as changes in the level of average unemployment duration.
3. Forecasts of 1996 CPI Inflation
| Information | Forecast |
|---|---|
| 12/95-12/96 | |
| Changes in inflation and unemployment | 2.0% |
| Changes in inflation, unemployment, and unemployment durations | 2.5% |
The detailed specification of these models follows that in King, Stock, and Watson (1995).3 They contain 12 lags of the monthly data and are estimated over the period from January 1974 to December 1995. The use of changes the unemployment rate and average duration is motivated by evidence that secular movements in these series are unrelated to inflation.
Using only the recent history of inflation and unemployment yields an inflation forecast of 2% for 1996. However, when recent data on average unemployment durations are added to the model, the forecast rises to 2.5%. Thus, at least at the present time, accounting for unemployment durations increases estimates of inflationary pressures. This is consistent with the view that the long-term unemployed are less relevant to wage determination than other unemployed workers.
Finally, it should be noted that these forecasts are intended only to illustrate the effect of adding information on unemployment durations to the analysis of inflationary pressures. They ignore other indicators such as capacity utilization, the gap between actual and potential GDP, commodities prices, and numerous monetary and financial variables that contain useful information about inflation. When these are factored into the analysis, Chicago Fed staff economists arrive at a 1996 inflation forecast of approximately 2.75%.
Tracking Midwest manufacturing activity
Manufacturing output indexes (1987=100)
| December | Month ago | Year ago | |
| MMI | 142.1 | 142.7 | 141.4 |
| IP | 124.8 | 124.7 | 123.8 |
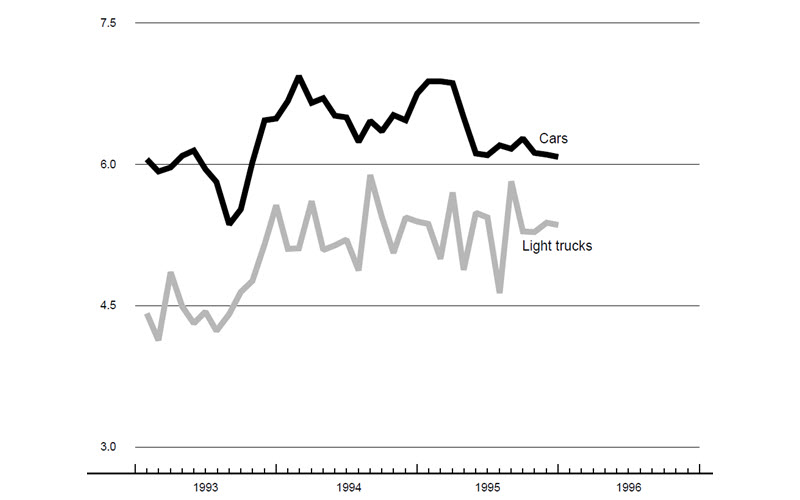
Motor vehicle production (millions, seasonally adj. annual rate)
| December | Month ago | Year ago | |
| Cars | 6.1 | 6.1 | 6.8 |
| Light trucks | 5.4 | 5.4 | 5.4 |
Purchasing managers’ surveys: net % reporting production growth
| December | Month ago | Year ago | |
| MW | 55.7 | 52.5 | 68.9 |
| U.S. | 47.0 | 46.1 | 59.4 |
Motor vehicle production (millions, seasonally adj. annual rate)
Sources: The Midwest Manufacturing Index (MMI) is a composite index of 15 industries, based on monthly hours worked and kilowatt hours. IP represents the Federal Reserve Board industrial production index for the U.S. manufacturing sector. Autos and light trucks are measured in annualized units, using seasonal adjustments developed by the Board. The purchasing managers’ survey data for the Midwest are weighted averages of the seasonally adjusted production components from the Chicago, Detroit, and Milwaukee Purchasing Managers’ Association surveys, with assistance from Bishop Associates, Comerica, and the University of Wisconsin–Milwaukee.
In December 1995, Midwest manufacturing activity experienced its biggest decline since last March. After reaching its highest level of the year in September, the MMI began a slight trend downward. In contrast, the national measure of manufacturing activity was virtually flat in December and only slightly below its September peak.
Other measures of manufacturing activity suggest more underlying strength to regional production. For example, purchasing managers’ surveys for Chicago, Milwaukee, and both the auto and nonauto portions of Detroit indicated improvements in production for December, while western Michigan showed contraction. Auto production, both nationally and regionally, actually increased slightly in December after being flat for two months.
Notes
1 See, for example, Gene Epstein, “How low can it go?—Jobless rate hasn’t slid to optimum level yet,” Barron’s, September 25, 1995, p. 46.
2 Chinhui Juhn, Kevin Murphy, and Robert Topel, “Why has the natural rate of unemployment risen?” Brookings Papers on Economic Activity, Vol. 2, 1991, pp. 75–126.
3 Robert G. King, James H. Stock, and Mark W. Watson, “Temporal instability of the unemployment-inflation relationship,” Economic Perspectives, Federal Reserve Bank of Chicago, Vol. 19, No. 3, May/June 1995, pp. 2–12.


