

The following publication has been lightly reedited for spelling, grammar, and style to provide better searchability and an improved reading experience. No substantive changes impacting the data, analysis, or conclusions have been made. A PDF of the originally published version is available here.
For more than 30 years, economists have advocated the use of market-based environmental regulations to improve the efficiency of regulatory programs designed to clean up the environment. Emission taxes and tradable emission permit markets have been proposed to supplant traditional regulatory methods by which regulators prescribe specific technology-based standards. One market-based program that received considerable attention began in 1994, when the South Coast Air Quality Management District (SCAQMD) introduced the Regional Clean Air Incentives Market (RECLAIM) in the Los Angeles basin. RECLAIM is a regional market designed to improve air quality through the reduction of two pollutants, oxides of nitrogen (NOx) and oxides of sulfur (SOx).
RECLAIM introduced a regulatory strategy for meeting a particularly severe regional environmental problem, and it aims to meet stringent federal and state requirements with greater flexibility and less economic disruption to the regional economy than a command-and-control approach. The potential benefits of environmental markets are increasingly being recognized in the Midwest. The Illinois Environmental Protection Agency (Illinois EPA) will soon launch the Emissions Reduction Market System (ERMS) to help address the ground-level ozone problems facing the Chicago area.
This Fed Letter reviews the California RECLAIM experience in the first two years of market activity, focusing on the NOx market, the larger of the two emissions trading programs.1 It then describes the basic features of the Illinois ERMS program and attempts to relate the lessons from the RECLAIM market to the proposed Illinois program.
Basics of the RECLAIM market
In 1994, the L.A. basin had the dubious distinction of being the only area in the nation classified as a “severe non-attainment area” for not meeting the current ozone standard. The combination of geography and high levels of ozone precursors made the region fall short of meeting the ambient air standards established under the 1990 Clean Air Act Amendments. Since the precursors to ozone had been subject to regulation for some time, SCAQMD decided to use environmental markets to reduce the economic dislocation and regulatory burden that would result from the imposition of increasingly stringent emission standards.
At the outset it was determined that stationary facilities emitting four tons of NOx or more per year would be included in the RECLAIM program. This criterion encompassed 390 facilities, representing roughly 65% of the permitted stationary NOx emissions in the L.A. basin.2 The program is designed to be facility-specific, with each facility being given an allocation of credits to cover all its emission sources, such as furnaces and boilers. Each facility then can choose how to achieve the required overall reduction in emissions, rather than having to force changes on specific pieces of equipment. This flexibility can result in significant cost savings at the facility level by allowing firms to shift emissions reductions among sources within a facility.
RECLAIM establishes what is commonly referred to as a “cap and trade” market. It sets an areawide emissions budget that declines over time and specifies an emissions reduction schedule for each facility in the program to the year 2003. The average NOx reduction required by the original 390 facilities was on the order of 75% of starting emissions levels.
One of the most contentious issues in the RECLAIM program was the establishment of the initial emissions allocation level for each facility. Regulators wanted to make sure that it reflected average production levels for each facility and was not being distorted by special conditions, such as a recession leading to reduced production levels. However, to gain individual firm acceptance of the RECLAIM program, SCAQMD let firms pick their baseline level on the basis of actual emissions during one of four years between 1989 and 1992. As a result, the total allocation at the beginning of the program was somewhat above actual 1993 emissions levels.
Other issues included reducing potential volatility in the trading market (this was accomplished by creating two partially overlapping trading cycles); easing the transition to an emissions trading environment by allowing firms a reconciliation period to purchase additional emission credits prior to imposing noncompliance penalties; and establishing two different geographic zones for trading to reflect the pollution patterns of the L.A. basin. Finally, the market-based approach was coupled with a performance-based standard that encouraged accurate monitoring and reporting of actual emissions.
RECLAIM performance
There are many metrics that can be used to assess the performance of the RECLAIM market to date. One question that can be asked is to what extent firms are trading credits in the market and whether the regulators’ expectations are being met. Based on trades of RECLAIM trading credits (RTCs) that expired in 1995, the market participation rate was around 50%. Given the new market and regulatory structure, this can be considered a good start. Yet, this seems low considering that RECLAIM does not allow banking of credits. Alternatively, one can attempt to assess the cost savings attributable to RECLAIM.
Figure 1 shows the price trends that emerged from the first four auctions held by Cantor Fitzgerald, one of the larger brokers active in the market. The price of RTCs is found to be rising with their vintage. Because of the shrinking emissions cap and rising marginal costs of control, this pattern had been expected. However, the prices reported in figure 1 also fall well below SCAQMD’s projections prior to trading.3 This suggests that the additional flexibility in compliance provided by RECLAIM has reduced the cost of controlling for NOx.
1. Price data for NOx RTCs
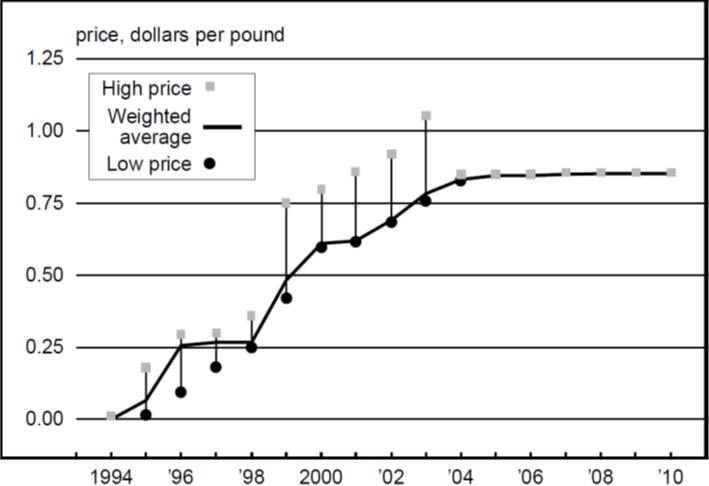
An additional factor to be taken into consideration in assessing the early activity of the RECLAIM market is the economy of southern California, which until recently, had been affected by the 1990–91 recession. With firms in the region operating below normal capacity, it is likely that the allocation of RECLAIM credits was generous enough for firms to easily meet the required emissions reductions during the first two years of the market.
Lessons in market design
In general, RECLAIM is a well-designed environmental market. Transactions costs have been kept to a minimum.4 Trades are easy to execute, information is accessible via an electronic bulletin board, and the regulator provides useful data on market activity. In addition, brokers have entered the market and appear to be serving an important intermediary role in helping to sell and buy credits.
However, the market approach represents a new regulatory structure and, as such, firms need to become familiar with it. Various uncertainties associated with the start-up of the program, such as the clearing of titles to RTCs and the imposition of fees associated with using RTCs, as well as uncertainties regarding future emission levels, have influenced facilities’ decisions during the first two years of the market. We found that many facilities traded only a small amount of RTCs and did not engage in long-term strategic trades. However, once firms adjust to the new regulatory structure, trading volume and participation are likely to increase.
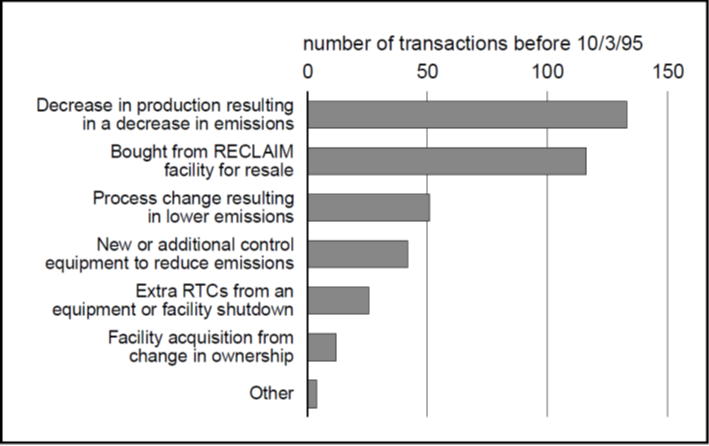
Finally, information collected by SCAQMD allows some inferences about facilities’ motivation to participate in the market. Figure 2 lists the main ways the traded RTCs were generated by RECLAIM facilities, brokers, and other parties. The most frequent response reported by sellers of RTCs was a decrease in production, which suggests an influence of the business cycle on trading behavior.
2. Generation of NOx RTCs sold
Implications for Chicago
In order to comply with Clean Air Act requirements, the Chicago area needs to reduce emissions of ozone precursors. More than five years ago, the Illinois EPA began to develop a regional emissions trading program for the Chicago area. At first it considered a NOx trading program, similar to RECLAIM. Later, regional air quality modeling found that the first priority for controlling ozone in Northwest Illinois was not local reductions in NOx, but reductions in volatile organic material (VOM) emissions. The modeling showed that, unlike Los Angeles, the Chicago area would experience an increase in ozone concentrations if local sources reduced emissions of NOx. In response, the Illinois EPA developed what will be the nation’s first VOM emissions trading program, which it expects to be finalized by the fall of 1997.
While ERMS and RECLAIM were both designed to reduce regional ozone concentrations, the meteorological, economic, and regulatory differences between the two regions have resulted in two unique programs. The sources and types of companies that emit VOM are different from those that emit NOx. NOx emissions generally come from the combustion of fuels at electric utilities and other industrial facilities. In contrast, over 250 different chemicals are categorized as VOM, and they are emitted by steel mills and large chemical plants as well as other types of facilities. Figure 3 shows the different composition of high-emission industries for both programs. Another difference relates to the meteorology and air quality chemistry in the two regions: ERMS is a seasonal program while RECLAIM is a year-round program. This is because the weather conditions conducive to ozone formation only occur in the warm weather months in Chicago. Also, ERMS has only one geographic trading area, unlike the two trading zones in the California system.
3. Top 4 high emission industries
| ERMS-VOM | RECLAIM—NOx | ||
|---|---|---|---|
Paper, allied products Chemicals, allied products Petroleum, coal products Fabricated metals |
Electricity, gas, and sanitary Petroleum, coal products Stone, clay, and glass Oil and gas extraction |
||
| Percent of total emissions | 52.8 | Percent of total emissions | 84.3 |
| Percent of total facilities | 37.7 | Percent of total facilities | 38.0 |
Sources: Compiled by Illinois EPA from preliminary baseline estimates, 1997; and Thomas Klier and Richard Mattoon, “To trade or not to trade: Who participates in RECLAIM,” Federal Reserve Bank of Chicago, working paper, No. WP-1994/11, 1994.
Another important difference is that ERMS allows limited banking of credits, while RECLAIM does not. State requirements in California did not allow SCAQMD to include banking in its design of RECLAIM. Under ERMS, most trading units have a two-year lifetime.5 Furthermore, a special account to be managed by the Illinois EPA will serve as an alternative source of trading units in case facilities are unable to obtain them in the private market.
The emissions baseline determination under ERMS is similar to that under RECLAIM. Facilities are allowed to average two of the three seasons from 1994 to 1996. If a facility can demonstrate that these three years are not representative, it may substitute years from 1990 to 1997. Once the ERMS baseline is set, initial reduction requirements will be issued in 1999 in one step, with each facility receiving seasonal allotments that represent a 12% across the board reduction from its historical baseline. Under RECLAIM, the amounts of required emission reduction vary from facility to facility, based on the command-and-control requirements for each source, and increase annually through 2003.
Conclusion
Both theory and practice have demonstrated that market-based environmental programs can be significantly more cost effective than traditional command-and-control regulations. Our analysis of the regional emissions trading market in California suggests that its performance so far has been promising. Industry and residents in the Midwest now stand ready to enjoy the regulatory flexibility and compliance that will be provided by Illinois’s new emissions trading program. While both RECLAIM and ERMS are designed to reduce local air pollution problems, they vary according to regional conditions, such as local weather patterns, industrial structure, and political environments. Common to both programs’ success, however, will be efforts to keep transaction costs low and to minimize uncertainty associated with the start of a new regulatory approach.
Tracking Midwest manufacturing activity
Manufacturing output indexes (1992=100)
| May | Month ago | Year ago | |
|---|---|---|---|
| CFMMI | 121.6 | 121.6 | 116.0 |
| IP | 121.4 | 120.8 | 115.7 |
Motor vehicle production (millions, seasonally adj. annual rate)
| June | Month ago | Year ago | |
|---|---|---|---|
| Cars | 5.8 | 5.8 | 6.7 |
| Light trucks | 5.8 | 5.4 | 5.4 |
Purchasing managers' surveys: net % reporting production growth
| June | Month ago | Year ago | |
|---|---|---|---|
| MW | 54.5 | 56.6 | 60.6 |
| U.S. | 56.0 | 57.0 | 54.6 |
Manufacturing output indexes, 1992=100
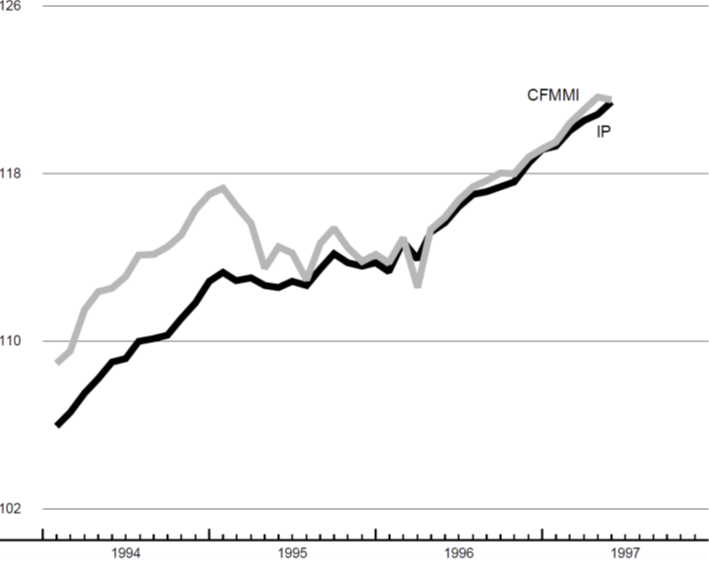
The Chicago Fed Midwest Manufacturing Index (CFMMI) decreased 0.1% from April to May, the first decline in seven months. By comparison, the Federal Reserve Board’s Industrial Production Index (IP) for manufacturing increased 0.5% in May. This is the first time in a year and a half that every sector in the region had slower growth from the prior month than its national counterpart.
Motor vehicle production (seasonally adjusted annual rate) for June increased from 5.4 to 5.8 million units for light trucks and remained constant at 5.8 million units for cars. The U.S. purchasing managers’ survey for production declined in June from 57% to 56%. The Midwest purchasing managers’ survey also declined in June from 56.6% to 54.5%.
Notes
1 For a more detailed analysis, see Thomas H. Klier, Richard H. Mattoon, and Michael A. Prager, “A mixed bag: Assessment of market performance and firm behavior in the NOx RECLAIM program,” Journal of Environmental Planning and Management, forthcoming.
2 The 390 facilities included at the outset of RECLAIM represented just over 11% of total NOx emissions in the L.A. basin. By the end of 1995, the number of facilities had decreased to 353, mainly as a result of a reevaluation of emissions estimates by SCAQMD staff.
3 Before RECLAIM began, one estimate from SCAQMD economists suggested that the prices for NOx credits would fall around $0.29 a pound in 1994 and rise to possibly $5.50 a pound by 1999. See Scott Lee Johnson and David M. Pekelney, “Economic assessment of regional clean air incentive market: A new emissions trading program for Los Angeles,” Land Economics, Vol. 27, No. 3, 1996, pp. 277–297.
4 The literature suggests that high transactions costs, including overly burdensome regulatory structures, have been responsible for the poor performance of some environmental markets.
5 Banking, which is allowed under the Acid Rain trading program, has encouraged early emission reductions and may have reduced the uncertainty of participants in the program; see Dallas Burtraw, “The SO2 emission trading program: Cost savings without allowance trades,” Contemporary Economic Policy, Vol. 14, April 1996, pp. 79–94.


