

The following publication has been lightly reedited for spelling, grammar, and style to provide better searchability and an improved reading experience. No substantive changes impacting the data, analysis, or conclusions have been made. A PDF of the originally published version is available here.
Much of the recent research on mortgage lending relies on data from the 1990 Census and the reports compiled under the Home Mortgage Disclosure Act (HMDA). The advantage of these data is that their content and geographic coverage are relatively comprehensive, making them useful for identifying overall trends and patterns. For example, figure 1, which is based on HMDA data, shows that refinance loan volumes for the U.S. rose to a peak in 1993 and then fell to a level in 1995 that was slightly above the level in 1991 (1996 data are not yet available). This refinance boom was partially the result of lower interest rates for mortgage loans. The return to 1991 loan volume is observed across most demographic categories, with the notable exception of Black borrowers; the number of refinance loans to Black borrowers in 1995 was almost three times the number of loans made in 1991. Although not reported in figure 1, the increase in the number of refinance loans is even more apparent for lower-income Black borrowers. This increase in refinancing might be evidence of an increase in efforts by lenders to market their products to Black borrowers. Alternatively, it may reflect changes in the personal finances and circumstances of this group. The HMDA data, however, do not provide sufficient detail about the borrower, the loan product, and the mortgage process to fully explain the observed patterns.
1. Refinance loan volumes

To increase our understanding of the mortgage process, the Federal Reserve Bank of Chicago sponsored several questions concerning mortgages in the 1996 wave of the Panel Study of Income Dynamics (PSID).1 This Fed Letter examines the preliminary release of the 1996 PSID data, focusing on two primary areas: a statistical overview of homeownership and mortgage terms, and differences in the home purchase process among various demographic groups.
The Panel Study of Income Dynamics
The PSID is an annual survey of U.S. households that started in 1968 and now includes approximately 8,500 households, of which about 3,300 are headed by a minority. Unlike many surveys, the PSID follows the same households over time. The principal focus of the survey each year is the demographic and economic circumstances of the household, including detailed information on employment, sources of income, and family composition. From time to time, special topics are added to the core survey, including a wealth and asset supplement at five-year intervals beginning in 1984. The 1996 survey includes supplemental questions on mortgage financing, consumer bankruptcy, and risk taking.
Homeownership
Figure 2 summarizes homeownership and mortgage characteristics from the PSID, disaggregated by the ethnicity of the head of the household and household income. Households with 1991 incomes in the lowest 30% of the national income distribution are categorized as low income. Most of the minority households are Black households. The figure uses the 1992 sampling weights, which are designed to make estimates from the survey apply to the nation as a whole. The national homeownership rate estimate based on the PSID sample for 1996 is approximately 67%, but there is considerable variation in the ownership rate among demographic groups. Minority and low-income households have ownership rates of 45% and 47%, respectively, compared to the 71% rate for White households.
2. Overview of 1996 PSID mortgage data
| Total | Non-white household heads | White household heads | Low-income householdsa | Medium- and high-income households | |
|---|---|---|---|---|---|
| Full sample | |||||
| Sample size | 8,517 | 3,302 | 5,178 | 2,121 | 5,163 |
| Homeowners | 67% | 45% | 71% | 47% | 73% |
| Checking/saving account | 78 | 47 | 84 | 54 | 87 |
| Renters | |||||
| Took steps to buy | 9 | 8 | 10 | 4 | 12 |
| Applied for loan | 4 | 4 | 4 | 2 | 6 |
| Owners | |||||
| Loan on home | 63 | 62 | 63 | 37 | 68 |
| Multiple loans | 7 | 5 | 7 | 2 | 8 |
| Mortgage in 1996 | 55 | 52 | 56 | 28 | 61 |
| Households with a mortgage | |||||
| Variable rate | 19 | 16 | 19 | 15 | 19 |
| Government insured | 25 | 47 | 23 | 26 | 25 |
| Refinanced | 35 | 22 | 37 | 14 | 37 |
| Mortgage duration ≥ 16 years |
74 | 82 | 73 | 70 | 74 |
| Mean interest rate | 7.8 | 8.4 | 7.7 | 8.4 | 7.7 |
| Median interest rate | 7.0 | 8.0 | 7.0 | 8.0 | 7.0 |
| Original mortgage | |||||
| Mean interest rate | 7.9 | 8.1 | 7.9 | 8.4 | 7.9 |
| Median interest rate |
8.0 | 8.0 | 8.0 | 8.0 | 8.0 |
| Refinanced mortgage |
|||||
| Mean interest rate | 7.5 | 9.2 | 7.4 | 8.4 | 7.5 |
| Median interest rate |
7.0 | 9.0 | 7.0 | 8.0 | 7.0 |
| Reasons for selecting a lenderb | |||||
| Previous experience with lender | 38 | 18 | 40 | 37 | 38 |
| Mortgage/home loan |
23 | 4 | 24 | 17 | 23 |
| Checking/savings | 21 | 7 | 23 | 22 | 21 |
| Other loan | 9 | 6 | 10 | 6 | 10 |
| Other experience | 4 | 5 | 4 | 5 | 4 |
| Other reasonsc | |||||
| Office nearby | 8 | 7 | 8 | 2 | 9 |
| Family and friends | 15 | 14 | 15 | 7 | 15 |
| Advertisement | 11 | 15 | 11 | 6 | 11 |
| Agent | 18 | 28 | 17 | 23 | 18 |
| Other reason | 20 | 28 | 20 | 22 | 20 |
a Low-income households are defined as those with 1991 total income at or below the 30th percentile of the income distribution.
b Households with mortgage dated 1991 or later. Respondents were allowed to indicate multiple reasons for selecting a lender.
c Those not reporting a previous experience with lender.
Source: Authors’ tabulations from 1996 PSID based on 1992 combined sampling weights.
Based on the PSID data, 63% of homeowners have a loan on their homes; 55% have a traditional mortgage, with the rest consisting of land contracts, home equity loans, home improvement loans, and lines of credit. Of all households, approximately 7% have multiple loans on their residences, including second mortgages. Surprisingly, low-income owners are the most likely to own their homes outright. Only 37% of low-income homeowners have a loan of any kind on their home and only 28% have a traditional mortgage. Without further inquiry, it is not possible to determine if this difference means that low-income individuals have less access to credit or that they have less need for credit.
Part of the gap in the rate of owning outright is due to life-cycle differences across demographic categories. Households headed by older individuals may have acquired sufficient wealth to pay off loans on their homes, and these households may have relatively low incomes after retirement. The low-income category contains a disproportionate number of households headed by individuals 55 years of age and older. Restricting the sample to household heads aged 25–54 diminishes, but does not eliminate, the greater likelihood of low-income households owning their homes. For this age group, 84% of all households have some sort of loan on their house, whereas 66% of low-income households have loans.
Several unique questions in the 1996 PSID survey may shed some light on the extent to which insufficient access to credit is a stumbling block to acquiring a home. Renters were asked “Since January 1991, did you take steps to buy your own home?” Overall, 9% reported taking steps, but we do not know exactly what actions were taken. The estimates for minority and low-income households are lower yet. Slightly less than half of those reporting that they took steps went as far as applying for financing, with the lowest response rate again for the low-income group. The responses to this question suggest that relatively few nonowners make it as far as the application process.
Differences in home mortgage characteristics
The PSID data show differences in mortgage terms across demographic groups. We see a tendency for minority households to use longer-term, fixed rate, and government-backed mortgages. Furthermore, minority and low-income households are less likely to refinance their loans. Approximately 19% of all households with mortgages have variable rate contracts and 74% have contracts with durations longer than 15 years. Among minority households with mortgages, only 16% are variable rate and 82% have durations in excess of 15 years. Although 35% of all homeowners with mortgages have refinanced loans as opposed to original mortgages (27% have loans refinanced since 1990), only 22% of minority households (13% since 1990) and 14% of low-income households (9% since 1990) have refinanced loans.
A potentially important finding is that minority and low-income households pay higher mortgage rates than other segments of the population, a dimension that is ignored in accept/deny studies of mortgage lending. Comparable differences are seen in median rates as well. An institution could adjust for risk by charging a higher lending rate, or discrimination in the mortgage credit process could result in higher rates for minority and low-income households. The PSID data reveal that, on average, minority and low-income households pay a mortgage rate of 8.4% compared to an overall rate of 7.8%.
This rate gap largely reflects rate differences for refinanced loans rather than original mortgages. Figure 2 illustrates that minority and low-income households that have refinanced loans pay higher interest rates than other households pay on refinanced loans. The average rate for all households holding refinanced mortgages is 7.5%, compared to 9.2% for minority households and 8.4% for low-income households. This rate gap is not explained by the vintage of the refinance loan, although we must exercise caution in our interpretation due to small sample sizes. The average rate for all households holding mortgages refinanced after 1990 is 7.3%, compared to 8.8% for minority households and 8.4% for low-income households. However, minority households with original mortgages fare better. The average rate for all households holding original mortgages is 7.9%, compared to 8% for minority households and 8.4% for low-income households. Again, the picture is not altered by considering the vintage of the original loan. The average rate for all households holding original mortgages contracted after 1990 is 7.5%, compared to 7.3% for minority households and 7.9% for low-income households.
More research using the PSID data is needed to fully explore the issue of minority and low-income groups paying higher mortgage rates. One possible explanation is that low-income and minority borrowers are more likely to refinance to extract equity rather than refinancing solely to take advantage of lower interest rates. Households that draw upon their equity may be considered riskier by lenders and, thus, are charged higher interest rates. Consistent with this interpretation, Hurst and Stafford (1996) find that refinancing to remove equity is sometimes associated with subsequent financial distress such as bankruptcy.2
The mortgage application process
The 1996 survey also reveals differences in the application process. Figure 2 summarizes information on the factors that influenced the respondents’ choice of a lender for mortgages contracted after 1990. For all borrowers, 38% reported an existing relationship with the lender at the time they applied for their mortgage, typically a savings/checking account or a prior home loan. Only 18% of minority borrowers reported such a relationship.
In the full sample, only 47% of minority households and 54% of low-income households reported having a bank account, compared to 78% overall. There is a sizable difference even for households with mortgages, with 72% of minority and 67% of low-income households reporting an account compared to 90% overall. However, the lack of accounts cannot fully explain the lower rate of prior experience with the lender for minorities. Although not reported in the figure, we see a similar pattern if we look at households holding a refinanced loan that, therefore, already have a relationship with a lender. Of all households that refinanced since 1990, 53% reported a previous experience with their lender compared to only 27% of minority refinances. Rather than continuing a prior relationship with a lender, minority borrowers tend to rely more on referrals from real estate agents, advertisements, and unspecified other reasons when choosing a lender.
Summary
At the outset, we observed that the HMDA figures for 1991–95 show that refinance lending to Black borrowers has remained relatively strong following the peak of the refinance boom in 1993, in contrast to other groups. Although the HMDA data show sustained refinance activity by Black borrowers, the PSID data reveal that minority homeowners are less likely to refinance. In other words, the fraction of minority homeowners holding an original loan is higher than that of White homeowners. This may change over time if refinance activity by Black borrowers remains strong. The PSID data also show differences in mortgage terms, with minority and low-income households paying higher rates, especially for refinanced loans. The data suggest that minority borrowers are less likely than other households to use prior experience with a lender when deciding where to apply for a loan. Fully explaining these patterns requires further study, and the PSID data will be an important tool in the process.
Tracking Midwest manufacturing activity
Manufacturing output indexes (1992=100)
| April | Month ago | Year ago | |
|---|---|---|---|
| CFMMI | 121.4 | 121.1 | 115.4 |
| IP | 120.5 | 120.8 | 115.2 |
Motor vehicle production (millions, seasonally adj. annual rate)
| May | Month ago | Year ago | |
|---|---|---|---|
| Cars | 5.8 | 5.7 | 6.4 |
| Light trucks | 5.4 | 5.3 | 5.4 |
Purchasing managers' surveys: net % reporting production growth
| May | Month ago | Year ago | |
|---|---|---|---|
| MW | 56.6 | 61.4 | 62.1 |
| U.S. | 57.0 | 56.6 | 52.9 |
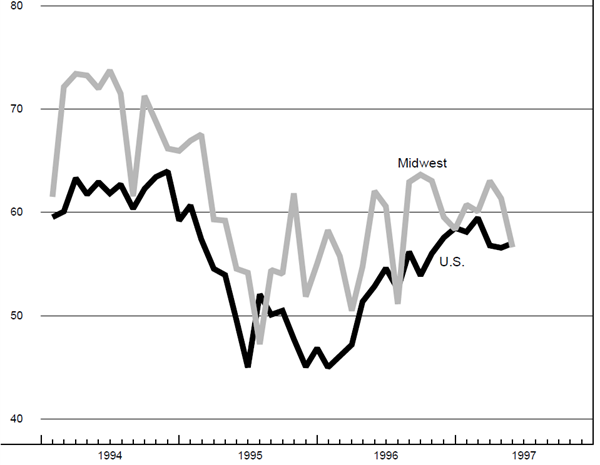
Purchasing managers' surveys (production index)
The Chicago Fed Midwest Manufacturing Index (CFMMI) rose 0.3% in April, slowing slightly from a 0.4% increase in March. The Federal Reserve Board’s Industrial Production Index for manufacturing declined 0.2% in April.
The Chicago purchasing managers’ survey for production declined to 56.6% in May from 61.4% in April. The U.S. purchasing managers’ survey increased slightly from 56.6% to 57%. Motor vehicle production edged up slightly, with car production increasing from 5.7 million in April to 5.8 million units in May on a seasonally adjusted annual rate. Light truck production also increased from 5.3 million to 5.4 million units.
Notes
1 A full description of the PSID is contained in Martha Hill, The Panel Study of Income Dynamics A User’s Guide, New York: Sage Publications, 1992.
2 See Erik Hurst and Frank Stafford, “Liquidity restrictions and bankruptcy as limits to private borrowing: 1990’s mortgage refinancing,” University of Michigan, Survey Research Center, Institute for Social Research, working paper, 1996.


