

The following publication has been lightly reedited for spelling, grammar, and style to provide better searchability and an improved reading experience. No substantive changes impacting the data, analysis, or conclusions have been made. A PDF of the originally published version is available here.
Gains in the volume of international trade during recent decades have raised questions about the impact of this trade on the U.S. economy as a whole, as well as on regions and specific sectors of the economy. Moreover, changes in the economic composition of regions have led economists to examine the relative impact of international markets and foreign exchange rates on the various regions of the country. For example, Clark, Sawyer, and Sprinkle (1999), Cronovich and Gazel (1998), Hervey and Strauss (1998), and others have examined the impact of international trade (especially exports), exchange rates, and foreign income growth on regional economies.1
An underlying premise in this type of research is that differences in industrial mix across regions and differences in the composition of regions’ international markets contribute importantly to the makeup of their international trade and, in turn, to the importance of international trade to their respective economies. However, this area of inquiry, for the most part, has examined the impact of regions’ exports on their economies. In large part, this is because U.S. regional import data per se are simply not available. That being the case, does it follow that there are no meaningful economic relationships between subnational economies and imports? On the contrary, this Chicago Fed Letter suggests that, despite the paucity of regional import data, meaningful economic relationships exist, and proposes one narrowly defined but economically meaningful measure of imported goods relative to subnational economies in the U.S.
Interest in import data by state is not a recent development. Recognition by state governments that international trade was becoming increasingly important to their economies led the National Governors Association to propose in late 1987 that Congress pass legislation that would require the U.S. Department of Commerce to collect and report imports-by-state data (however, the legislation was not enacted). In fact, the U.S. Department of Commerce, Bureau of the Census, began publishing state-level data on exports and imports in January 1987. However, the basis underlying the construction of the import series was unsatisfactory and the validity of the series was widely criticized. Consequently, the imports-by-state series was discontinued at the end of 1988. Exports-by-state data continue to be published on a monthly basis.
Why the abandonment of the imports-by-state series? Simply stated, a measure of imports into a subnational economy is less easily identified than is one for exports; and, more significantly, the meaning of imports at the state level is even less clear. What does an import into Indiana mean? Does it mean that the imported product entered final consumption there? In fact, a product “imported into Indiana” may be in transit—it may be an intermediate product to be incorporated into another product that is no longer identifiable as an import, and shipped elsewhere in the U.S., exported, or eventually returned and consumed in Indiana. Thus, it is hard to conceptualize precisely what an import into Indiana (or any other state) means.
Toward a more meaningful measure
In considering how to construct an economic measure of “regional imports,” it is helpful to consider how imports may influence regional economies. One the one hand, to the degree that imports complement domestic output or fill a void where no domestic production exists, they might be thought of as providing an unambiguous positive contribution to the regional economy.
On the other hand, to the degree that goods imports compete with domestic production, the impact is ambiguous. In the short term, imports that compete with domestic industry may exert a detrimental impact on domestic production by displacing output and employment. At the same time, competition engendered by imports may, over time, result in positive technology transfers or otherwise promote greater competitive efficiencies in domestic industries, even an expansion in domestic output and employment. Furthermore, consumers, both intermediate and final, may benefit from imports to the extent that they contribute to lower prices, greater selection, improved quality, and the like.
It is important to understand, therefore, that a larger or smaller allocation of imports to one region, relative to other regions, does not necessarily imply a greater or lesser degree of import competition for that region. This article deals with a small part of the issue of imports and their potential regional impact, namely, how might the value of the nation’s imports be allocated across regions in an economically meaningful manner.
Hayward and Erickson (1995) address this question in an analysis of the economic impact of the North American Free Trade Agreement on states.2 If there is concern about import competitiveness or intermediate good consumption, i.e., the incorporation of imported components into domestic production, then a significant question concerning imports is the location and relative importance of the U.S. industries associated with a specific category of imports. From this perspective, we are interested not so much in where the goods enter the U.S. or are consumed as in the location of the industries for which the imports are used as inputs or with which they compete. Hayward and Erickson address this issue by allocating U.S. imports, by industry, from Canada and Mexico across states in proportion to the states’ share of industrial shipments by two-digit SIC code as available in the Census of Manufacturing/Annual Survey of Manufacturing.
The issue of regional imports
In this article, the allocation of imports by region differs modestly but significantly from that of Hayward and Erickson. Rather than using industrial shipments as an import weighting scheme, it draws on employment in manufacturing, by industry, for 1994 and 1995 and on manufactured goods imports, by industry, from 44 foreign markets.
The primary rationale for using an employment allocation scheme is that the employment data allow one to more readily access current, as well as historical, data, although at this stage of the current research, these advantages are not fully utilized. The formulation of the subnational goods import measures discussed here is constricted for two primary reasons: first, so as to be compatible with measures of subnational manufactured goods exports in Hervey and Strauss (1996 and 1998); and second, to hold the data collection within manageable bounds. (The regional allocation by itself requires only total U.S. imports by industry and not the additional data refinement of imports-by-industry-by-country.
However, as noted below, the source country designation does provide a more complete understanding of the import market.)
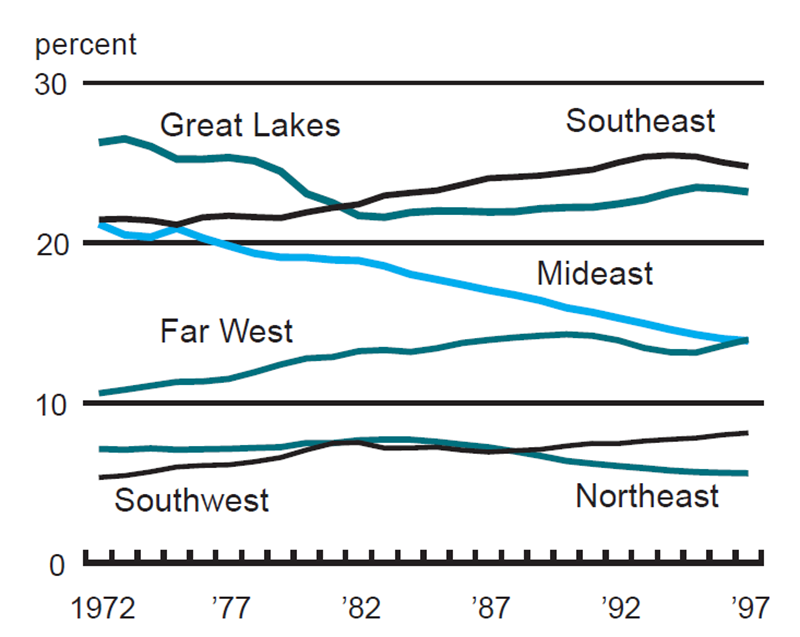
Restricting the employment weights to 1994 and 1995 ignores several important issues, such as the impact on import allocation across regions that is due to changes in industrial concentration over time. The data shown in figure 1 indicate that since the early 1970s there has been a marked shift in regional employment shares in the goods manufacturing industries—e.g., away from the Great Lakes (Midwest), Mideast, and New England toward the Far West, Southeast, and Southwest. In addition, based on the methodology used to allocate imports to the various regions, changes in the structure of manufacturing employment imply a shift in the allocation of imports away from the Great Lakes, Mideast, and New England regions toward the Far West, Southeast, and Southwest—the constant 1994–95 employment weights also ignore this issue. Finally, the constant period employment weights do not reflect the fact that one can also expect the allocation of imports across regions to be influenced by shifts in the relative composition of manufacturing industries (e.g., between durable and nondurable goods) across regions and by changes in the relative industry composition of imported manufactured goods.
1. Share of U.S. manufacturing employment
The manufacturing industry classifications—durable and nondurable goods—data in figure 2 reflect a shift in manufacturing employment from durable goods industries toward nondurable goods industries in the Great Lakes and from nondurables toward durables in the Southeast. In addition, over the three decades since the early 1970s, the composition of U.S. manufactured goods imports has changed—with an increasingly large proportion in the durable goods category, especially capital equipment. Recognizing these shortcomings, the fixed period employment weights nonetheless demonstrate a conceptually meaningful measure of the relative importance of goods imports across regions.
2. Share of durable goods employment

In summary, the allocation of manufactured goods imports across regions depends on a region’s share, relative to the U.S. total, of employment in three categories—total manufacturing, durable goods manufacturing, or nondurable goods manufacturing (two-digit industry classifications are possible, but the more manageable three classes are used here). In this particular construction, it also depends on the value of U.S. imports for each of these three categories from each of 44 major foreign market sources. The result gives a regional allocation of imports (ALLMs) from an aggregate of 44 foreign countries (based on a 1994 and 1995 average) for each of the three manufacturing categories listed above for eight U.S. regions.
Implicit in this construction is the idea that the larger the relative employment in a specific industry in a given region, relative to other regions, the greater the potential economic impact of manufactured goods imports on that particular region.
The relative size of the ALLMs can be measured by industry across regions (share of the U.S. total) or by industry within regions (durable or nondurable share of a region’s manufacturing total). In addition, this construction facilitates identification of the foreign country sources that most strongly influence the ALLMs for each region.
The largest regional share for manufactured goods imports goes to the five Great Lakes states (Illinois, Indiana, Michigan, Ohio, and Wisconsin). ALLMs to these states account for 26% of total U.S. manufactured imports. The Southeast region follows with a 20% share, and the Far West with a 15% share.
As one might expect, given the Great Lakes region’s importance in durable goods manufacturing, that region also dominates the regional ALLMs for the nation’s durable goods imports. It accounts for nearly 29% of U.S. regions’ ALLMs (see figure 3). A possible implication is that the economic impact of imported durable manufactured goods and equipment may have a greater relative influence on Great Lakes states than elsewhere.
3. ALLMS, durable goods

Nondurable manufactured goods imports present a different regional story (see figure 4). Here, the Southeast region dominates the nation’s ALLMs, accounting for just over 28% of U.S. imports in that category. Great Lakes states rank second with 17% of the U.S. total, and the Southwest ranks third with nearly 16% of the total.
4. ALLMS, nondurable goods

The allocation of imports to U.S. regions based on the country of source presents some interesting patterns.
Two-thirds of the ALLMs of durable manufactured goods to the Great Lakes states are attributable to Japan, Canada, and the European Monetary Union (EMU) (see figure 5). The newly industrialized countries (NICs) of Asia (Hong Kong, South Korea, Singapore, and Taiwan) account for an additional nearly 13%.
5. Import allocation to Great Lakes by source

Source: Author’s calculations.
The pattern is rather different with respect to nondurable manufactured goods; Canada and the EMU retain an important role as a source for these types of goods, accounting for nearly half of the nondurable manufactured goods allocated to the Great Lakes region. However, Japan’s share drops dramatically, compared with its durable goods share, accounting for less than 9% of total nondurable manufactured imports allocated to the region. The NICs account for 11% of the region’s nondurable ALLMs.
Conclusion
While it is not possible to obtain goods import data by region from the international trade data collected by the Bureau of the Census, we may be able to examine the impact of imports on regions by allocating imports based on a measure of economic activity in individual U.S. regions. One such measure is employment in manufacturing by industry. Based on this type of data, the Midwest (Great Lakes states) receives the primary allocation of manufactured goods imports, especially durable goods. This methodology also indicates that Japan, Canada, and the EMU are the primary sources of durable goods. For nondurable manufactured goods, however, Japan falls out of the picture as a major provider of imports to the Great Lakes region. Canada and the EMU retain important roles as providers of nondurables to the region.
Tracking Midwest manufacturing activity
Manufacturing output indexes (1992=100)
| August | Month ago | Year ago | |
|---|---|---|---|
| CFMMI | 132.4 | 131.8 | 128.4 |
| IP | 139.9 | 139.3 | 135.7 |
Motor vehicle production (millions, seasonally adj. annual rate)
| September | Month ago | Year ago | |
|---|---|---|---|
| Cars | 5.7 | 5.7 | 6.5 |
| Light trucks | 6.9 | 7.6 | 5.9 |
Purchasing managers' surveys: net % reporting production growth
| September | Month ago | Year ago | |
|---|---|---|---|
| MW | 57.5 | 54.2 | 67.4 |
| U.S. | 61.7 | 56.7 | 53.4 |
Manufacturing output indexes, 1992=100
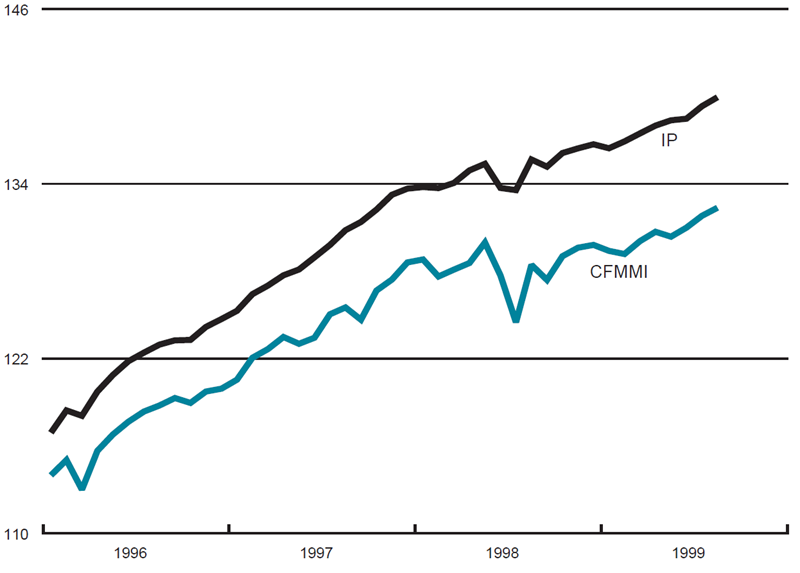
The Chicago Fed Midwest Manufacturing Index (CFMMI) rose 0.4% from July to August; revised data show the index rose 0.6% in July. The national Industrial Production Index (IP) for manufacturing increased at the same rate as the CFMMI during both July and August. Light truck production decreased from 7.6 million units in August to 6.9 million units in September, and car production remained constant at 5.7 million units for both August and September.
The Midwest purchasing managers’ composite index (a weighted average of the Chicago, Detroit, and Milwaukee surveys) for production increased to 57.5% in September from 54.2% in August. The purchasing manager’s indexes increased for all three surveys. The national purchasing managers’ survey for production increased from 56.7% in August to 61.7% in September.
Notes
1 D. P. Clark, W. C. Sawyer, and R. L. Sprinkle, 1999, “Regional exchange rate indexes for the United States,” Journal of Regional Science, Vol. 39, No. 1, pp. 149–166; R. Cronovich and R. Gazel, 1998, “Do exchange rates and foreign incomes matter for exports at the state level?” Journal of Regional Science, Vol. 38, No. 4, pp. 639–657; and J. L. Hervey and W. A. Strauss, 1998, “Foreign growth, the dollar, and regional economies, 1970–97,” Economic Perspectives, Federal Reserve Bank of Chicago, Fourth Quarter, pp. 35–55, and 1996, “A regional export-weighted dollar: A different way of looking at exchange rate changes,” Federal Reserve Bank of Chicago, working paper, No. GL-2.
2 D. J. Hayward and R. A. Erickson, 1995, “The North American trade of U.S. states: A comparative analysis of industrial shipments, 1983–91,” International Regional Science Review, Vol. 18, No. 1, pp. 1–31.


