

In this article, we quantify the costs and benefits of tariffs based on a modern trade model. This model predicts that in the case of unilateral tariffs set by the U.S., a modest across-the-board increase in tariff rates can generate a net positive effect on consumption. This occurs when the tariff revenue collected exceeds the output losses caused by resulting distortions and higher domestic prices. The model predicts a peak net gain in consumption equivalent to 0.3% of real gross domestic product (GDP) with a 19.7% unilateral tariff increase, under the assumption that trade partners to the U.S. will not retaliate. However, if foreign countries respond with retaliatory tariffs, the resulting decline in demand for U.S. exports causes an output loss that outweighs the revenue gains. In the long run, as firms and workers reallocate resources across sectors, the model predicts that both the positive and negative effects of tariffs are lower.
There have been many recent announcements of increased tariffs imposed on goods imported into the U.S. from many different countries. Though there is broad agreement among economists that such tariffs raise tariff revenue but reduce domestic output, the overall direction and magnitude of their effects remain unclear. In this article, we use a modern Eaton–Kortum model of international trade,1 featuring multiple countries and sectors and calibrated to match world trade flows in 2019, to quantify the impact of tariffs. This framework, which includes the U.S. and its major trading partners, allows us to examine how U.S. tariff policy affects trade and output.
Much of the current tariff discourse seeks to understand its short-term impact on inflation and trade deficits. While we acknowledge that those are important effects to understand, we instead utilize our model to evaluate the costs and benefits of tariffs on real output and consumption in both the short and long run. The primary benefit of tariffs is the tax revenue they generate.2 As with other forms of taxation, tax revenue follows a Laffer curve:3 Tariff revenue first increases with the tariff rate, but it eventually declines as higher tariffs reduce import demand. The costs of tariffs, by contrast, stem from the efficiency losses caused by distorted production decisions and higher domestic prices. From the perspective of the U.S., tariffs shift domestic production toward goods previously imported, often in sectors where the U.S. lacks a comparative advantage. Moreover, many domestic producers rely on global supply chains to acquire intermediate goods. Tariffs increase the costs of these intermediate inputs, inducing firms to adopt less efficient input mixes and ultimately lowering overall output. However, being a large economy, the U.S. can induce lower pre-tariff prices from foreign exporters to relieve part of the tariff costs.
To quantify the relative importance of costs and benefits from raising tariffs, it is essential to understand how easily businesses and consumers can substitute away from the goods subject to tariffs. In this article, we use a state-of-the-art quantitative trade model to estimate the degree of substitution. The model implies that the Laffer curve for tariff revenue peaks at 1.6% of real GDP with a 63.2% across-the-board unilateral tariff increase. To put this in perspective, the largest source of U.S. tax revenue—the federal income tax—is around 9% of GDP. Costs of tariffs rise monotonically with the tariff rate (i.e., the costs strictly increase as the rate increases): They reach 1% of real GDP at a 25% tariff rate increase and 2.5% of real GDP at a 125% tariff increase. For context, the U.S. saw a 4.3% decline in its real GDP during the Great Recession.
There are circumstances under which the benefits of tariffs outweigh their costs, making them net beneficial to the U.S. economy. In the specific model considered, net benefits peak at 0.3% of real GDP for a 19.7% unilateral tariff increase when there is no retaliation. However, these net benefits become negative if U.S. trading partners respond with retaliatory tariffs.
All these results reflect the baseline case in which productive resources, e.g., labor and capital, do not reallocate across sectors within a country in response to tariffs. This scenario can be interpreted as capturing the short-run impact. When we allow for such reallocation, which is likely to occur over an extended period of time, both the costs and benefits become smaller.
Costs and benefits
The model we use in this article is well suited to analyze the effects of U.S. trade policy on real output at a detailed country and sectoral level.4 It features both intersector and intrasector trade driven by cross-country differences in sector productivity, bilateral trade costs and tariffs, and relative endowments. The model incorporates full input–output linkages and captures trade in both final goods and intermediate inputs. It also allows trade elasticities (i.e., how trade volumes respond to price or tariff changes) to vary across sectors. Importantly, the model enables analysis of tariff effects in both the short run—when the factors of production, i.e., the inputs (such as labor and capital) required to produce goods and services, are immobile across sectors—and the long run—when reallocation of such factors across sectors is possible. Model parameters are chosen to match the 2019 output composition by country as well as trade flows.5 Our general equilibrium framework is designed to capture how global trade networks respond to changes in one country’s tariff policy. Our analysis focuses on how tariffs impact U.S. real output, tariff revenue, and final demand.
Tariffs can have broader economic effects that fall outside of the scope of this model.6 For example, our model is a real model without nominal prices; while it captures changes in the relative prices of goods to services, it cannot assess how tariffs affect aggregate inflation or how price rigidities influence firm adjustments. Furthermore, our model is static and operates under the assumptions of balanced trade and fixed capital, so it does not account for the impact of tariffs on the dynamics of investment and trade deficits. We leave these important issues for future work.
As with any tax, tariffs raise revenue for the levying government—but it is not obvious by how much. When a tariff rate increases, two things happen. First, the government collects more revenue per unit of imports. Second, imports become relatively more expensive, causing a substitution toward domestic alternatives and reducing the overall volume of imports.7 Thus, whether total tariff revenue increases or decreases depends on the relative strength of these two effects. At low tariff rates, the first effect tends to dominate, so a 1% tariff rate hike raises total revenue collected. At high tariff rates, however, the second effect dominates, so the same 1% tariff rate increase lowers total tariff revenue. This trade-off is captured by the famous Laffer curve, which describes the nonmonotonic8 relationship between tax revenue and tax rates.
While tariffs can increase government revenue, they also impose economic costs. In particular, tariffs may reduce potential output by disrupting global supply chains. Many domestic producers rely on imported intermediate goods for their production processes. When tariffs raise the cost of these inputs, firms may be forced to source them domestically, leading to a less efficient allocation of resources. From an economic standpoint, this constitutes a negative supply shock: Higher input costs translate into increased prices, reduced consumer demand, and lower output. These inefficiencies tend to grow as the tariff rates rise.
This effect may be best illustrated through an example. Consider a U.S. coffee shop that imports coffee beans from South America. If tariffs are imposed on imported coffee beans, the coffee shop is left with three options: grow their own coffee beans, find a domestic supplier, or continue to import beans at a higher price. All three options drive up operating costs. Though the shop may pass some of these costs to consumers through higher prices, sales will likely fall, as customers buy less coffee at those higher prices, leaving the business worse off.
The overall impact of tariffs on consumption is the sum of tariff revenue gains and income losses from reduced potential output. If the net effect is positive, households are better off. This net effect varies with the size of the tariff increase. To quantify these effects, we use a state-of-the-art quantitative trade model that evaluates outcomes across a spectrum of tariff rate increases on goods imports from all U.S. trading partners. Our analysis also compares the short-run and long-run effects. In the short run, when factors of production cannot move across sectors, tariff revenue gains tend to be larger. Over the long run, as these factors reallocate, the revenue benefits of the tariffs tend to decline.
Quantified effects
Figure 1 shows the benefits, costs, and net effect of imposing a unilateral across-the-board tariff increase relative to 2019 levels in our model—the size of which is given in percentage points on the horizontal axis and varies between 0 and 125 percentage points. The benefits are the tariff revenue, which traces out the Laffer curve (blue solid line) in the figure. The costs are the loss in output—in terms of factor income, or income derived from the factors of production (orange dotted line). The net effect is captured by the impact of the tariffs on aggregate consumption (red dashed line).
1. Tariff Laffer curve: Unilateral hike without retaliation and with immobile factors of production
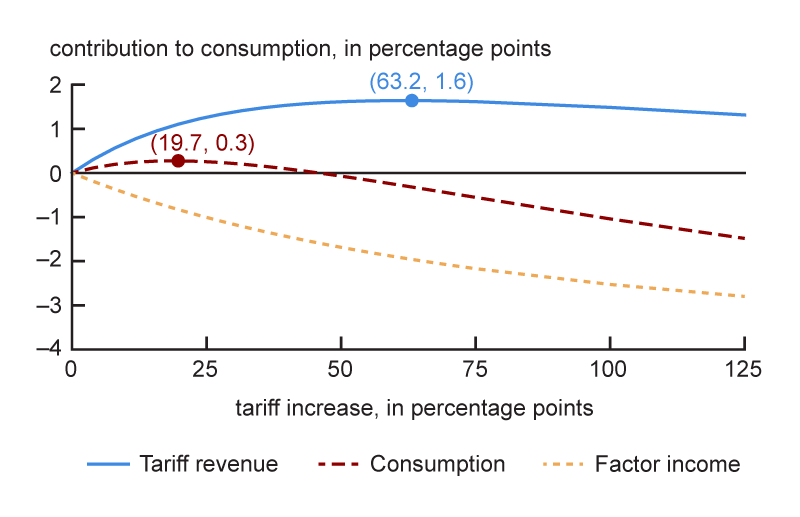
Source: Authors’ model.
In this unilateral scenario there is potential for a net positive consumption effect. This can be seen from the red dashed line being positive at tariff increases from 0 to nearly 50 percentage points. The maximum net benefit of tariffs in our model specification is a net gain in consumption equivalent to 0.3% of real GDP at a 19.7% increase in the tariff rate. This tariff rate is lower than the tariff-revenue-maximizing rate, which coincides with the peak of the Laffer curve (63.2%). For tariff rates between these two, the negative effect on output is larger than the additional tariff revenue generated. For tariff rates higher than 63.2%, the incentive to substitute away from imports is strong enough that any increase in the rate will lead to a decline in total revenue collected. At the tariff-revenue-maximizing rate, the additional tariff revenue collected is 1.6% of real GDP. For comparison, federal income tax revenue is about 9% of GDP, as we mentioned before. In contrast, output (in terms of factor income) is always decreasing as the tariff rate is increasing. At our chosen upper bound of a 125% tariff increase, output falls a bit more than 2.5% of real GDP.
History has shown that it is unlikely the U.S. would be able to place tariffs on foreign countries without facing retaliation. Therefore, we consider a tit-for-tat retaliation where foreign countries match the increase in U.S. tariffs. In this scenario, according to our model, there is no tariff increase at which consumption also increases, as retaliation not only deepens the loss in output but also reduces the tariff revenue collected (see figure 2). With retaliation, U.S. products become more expensive in foreign markets, lowering foreign demand and suppressing domestic production. Reduced foreign demand lowers prices for domestic factors of production, which in turn further reduces imports. At the same time, the fall in U.S. output reduces the demand for intermediate goods—particularly imported inputs. As a result, tariff revenue collected shrinks relative to the unilateral tariff scenario.
2. Tariff Laffer curve: Unilateral hike with retaliation and immobile factors of production
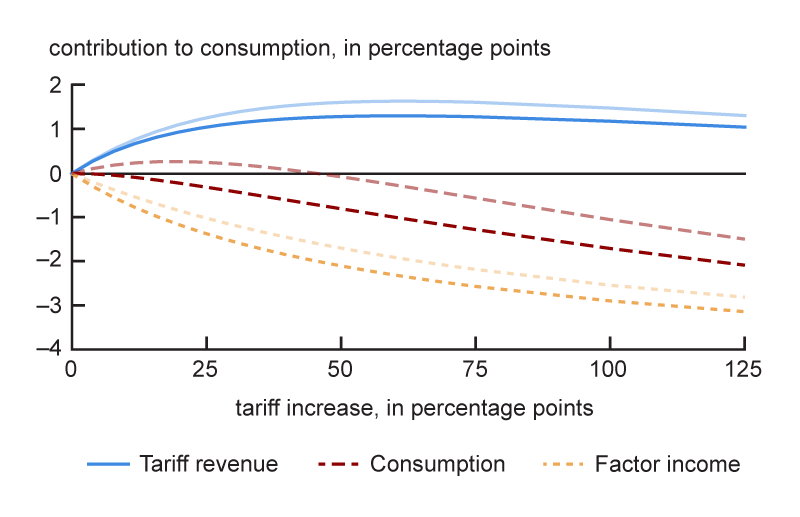
Source: Authors’ model.
Short-run versus long-run effects
We expect the impact of tariff increases to moderate in the long run. Given that tariffs are levied only on imported goods and that capital and labor cannot move across sectors on impact (the latter an assumption built into our model), the returns to capital and labor in U.S. goods sectors rise relative to those in services sectors. These return differentials are sustainable in the short run because it takes significant time and investment to move capital and labor across sectors. However, these differentials incentivize capital and labor to move from services sectors to goods sectors to pursue higher returns, reducing return differentials to zero in the long run. This mobility reduces the loss in output (in terms of factor income) relative to that in the short run. At the same time, the U.S. collects less tariff revenue than in the short run, as its trading partners also can move capital and labor across sectors to buffer the impact of U.S. tariffs.
Figure 3 contrasts this long-run outcome of tariff increases with the short-run outcome when there is retaliation from U.S. trading partners. In the long run, the mobility of capital and labor across sectors dampens the impact of the tariff hikes on both the tariff revenue and the loss in output (in terms of factor income). This dampening increases with the size of tariff rate hikes, as larger hikes further incentivize intersectoral movement. However, for large tariff rate hikes, this dampening effect is more pronounced on tariff revenue than on output loss, leading to a more negative net consumption effect relative to the short run. It is important to note that our model likely understates the severity of this consumption effect. We assume that capital and labor can move freely across sectors without cost. In reality, frictions in reallocating production factors would be a headwind to output recovery and weaken the mitigating effect seen in figure 3.
3. Tariff Laffer curve: Unilateral hike with retaliation and mobile factors of production
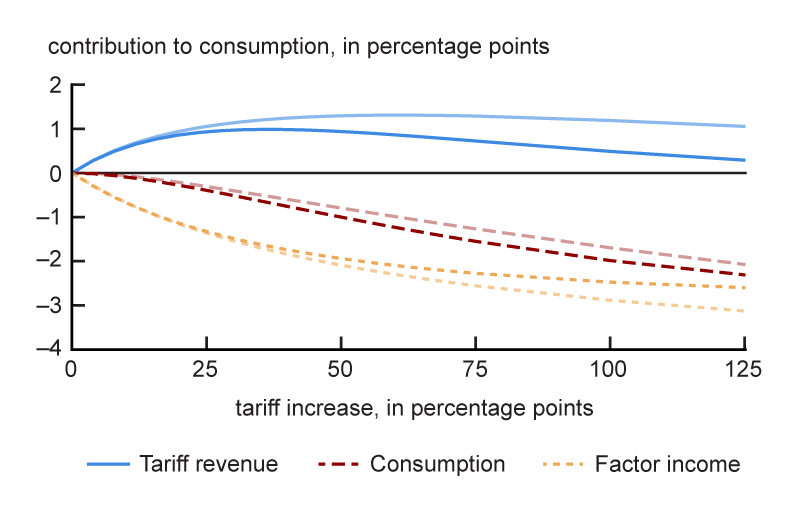
Source: Authors’ model.
Conclusion
Quantifying the competing effects of tariffs requires a structural trade model. Our modern trade model yields the possibility of a net positive consumption effect for the U.S. in the case of unilateral tariff increases without retaliation from its foreign trade partners. That is, our model shows that revenue collected from tariff hikes can exceed the output losses caused by the resulting distortions and higher domestic prices when there is no retaliation. We estimate that the net effect peaks at 0.3% of real GDP at a 19.7% across-the-board unilateral tariff increase when trading partners do not retaliate. However, when foreign trade partners retaliate with tariffs of their own, the net impact is negative. In the long run, when firms and workers are able to reallocate productive resources (such as capital and labor) across sectors, both the positive and negative effects of the tariffs are dampened.
Notes
1 This type of model was introduced in Eaton and Kortum (2002).
2 It should be noted that the incidence of tariffs (i.e., who ultimately bears the economic burden of tariffs) is divided between firms and consumers. When tariffs increase, foreign firms exporting to the U.S. may lower their pre-tariff prices, reducing their revenue, while the after-tariff prices faced by importing firms and consumers in the U.S. increase above their levels prior to the tariff increase. Note that only a large economy has the potential to affect foreign exporters’ prices through its demand.
3 The Laffer curve plots the the relationship between the tax rate and tax revenue, showing that a higher rate does not always lead to greater revenue. More on the Laffer curve is available online.
4 Our model is similar to those in Levchenko and Zhang (2016) and Santacreu et al. (2023) and features 39 sectors (17 for goods and 22 for services) and 76 countries, including the 38 member countries of the Organisation for Economic Co-operation and Development (OECD).
5 We calibrate output composition and bilateral trade share using year 2019 data from the latest vintage of the OECD Inter-Country Input-Output (ICIO) tables and use the year 2019 data from the latest vintage of the Penn World Table (PWT 10.01) to obtain total country-level labor and capital endowments. For nontariff trade costs, we use the CEPII (Centre d’Etudes Prospectives et d’Informations Internationales) Gravity Database. Our main source of tariff data comes from World Integrated Trade Solution (WITS). WITS, however, does not include some relevant temporary tariff adjustments. To capture these adjustments, we supplement the WITS data with a data set compiled in Fajgelbaum et al. (2020).
6 Paulson et al. (2025) use a different theoretical framework to analyze the employment and value added effects of tariffs, as well as the heterogeneity of these effects across U.S. states.
7 The volume of exports declines by the same amount, under our assumption of balanced trade.
8 In this context, nonmonotonic means that tax revenue does not strictly increase with the tax rate.


