

The following publication has been lightly reedited for spelling, grammar, and style to provide better searchability and an improved reading experience. No substantive changes impacting the data, analysis, or conclusions have been made. A PDF of the originally published version is available here.
The current economic expansion has delivered the lowest unemployment rates in 30 years. Yet wage growth has remained relatively contained. This failure of wages to accelerate more rapidly suggests to some a shift, or even a complete breakdown, in the historical relationship between unemployment and wage growth. However, looking across the years, the link between unemployment and wage growth has always been relatively loose. Previous periods have seen wage growth depart just as far from expectations, only to return to the historical pattern. This historical looseness in the relationship between unemployment and wage growth implies that it might take many years of time-series data to conclusively identify a significant change.
In this Chicago Fed Letter, we provide more timely evidence on whether the relationship between unemployment and wage growth might have changed. We do this by looking not only across the years, but also across the 50 states. The wide variation in state unemployment rates makes it possible to identify any significant changes in the response of wages to unemployment with many fewer years of data. We find, however, that the relationship between unemployment and wage growth has changed relatively little. Even in recent data, unemployment and wage growth continue to be negatively correlated. We do find evidence that the elasticity of wage growth with respect to unemployment has fallen in recent years. However, as we explain below, we regard the evidence of a weakened relationship between unemployment and wage growth as itself somewhat weak. In addition, we show that the rates of real wage growth associated with high, medium, and low unemployment rates have been reasonably stable in recent years.1
Background
Some shift in the relationship between unemployment and real wage growth in the 1990s would not be surprising. Among the many changes in the labor market in recent years, the general drop in the level of job security, the aging of the workforce, its higher levels of education, the growth of temporary services employment, the use of fax machines and the internet in job search, and even the increase in the prison population could each be changing the relationship between unemployment and wage growth.
A rough indication of the time-series evidence on this question can be gleaned from figure 1, a scatter plot of annual data on the excess of hourly compensation growth over the previous year’s Consumer Price Index (CPI) inflation versus the natural logarithm of the annual unemployment rate. The relationship depicted in figure 1 is analogous to the wage equations in some macroeconometric models. The figure shows that there is a loose, but reasonably clear, negative correlation between unemployment and wage growth in excess of lagged inflation. The least-squares regression line shown in the figure slopes downward with an elasticity of –0.055 and an estimated standard error of 0.009. This implies that a 10% decrease in the unemployment rate leads to a 0.55% increase in wage growth.
1. Growth in compensation vs. unemployment

A line connecting the values from 1992 to 1999 highlights the data for the current expansion, when the unemployment rate was falling from 7.5% to 4.2%. As can be seen, the growth of hourly compensation was a percentage point or more below expectations each year from 1993 to 1997. Though the data for the last two years have returned to the predicted line, the cumulative loss of wage growth over the expansion has been significant.
However, such departures of wage growth from expectations are far from unprecedented. In earlier years, the data have strayed further from expectations only to return to the basic pattern of low unemployment being associated with higher wage growth. Of course, neither do the time-series data in figure 1 rule out a significant shift in the relationship between unemployment and inflation. Unfortunately, given the looseness of the historical relationship, it would take many years to confidently identify even a relatively large change in the relationship.
Our results
To get additional evidence on the relationship between unemployment and wage growth, we turn to the kind of cross-sectional data shown in figure 2, which displays the deviation of 1999 state unemployment rates from their state-specific averages over the 1980–99 period. We focus on deviations from long-term averages rather than the simple unemployment rate because differences in demographic and industrial mix, generosity of social insurance, and other factors may affect the natural rate of unemployment in a given state. In this case, cross-state variation in the average level of unemployment may be unrelated to average wage growth, and the relative unemployment indicators depicted in figure 2 will give a clearer picture of labor market conditions.
2. Unemployment deviation
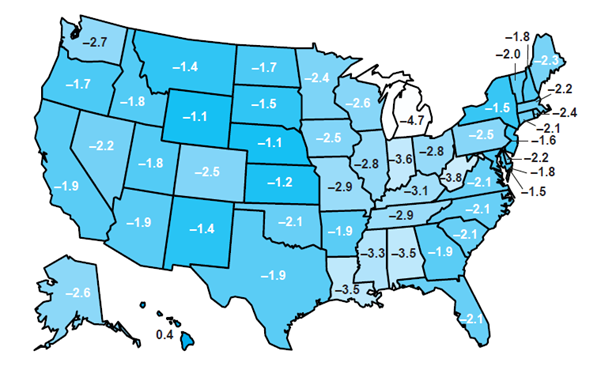
In recent years these unemployment deviations suggest a markedly different picture of where labor market conditions are tightest than the standard level of unemployment. For instance, the states with the lowest (South Dakota, 2.5%) and highest (District of Columbia, 6.5%) unemployment rates in 1999 are both 1.5 percentage points below their long-run average rates. Therefore, we expect both states to have similar real wage growth in 1999. In terms of unemployment deviations, in 1999, the tightest labor market is Michigan’s, where the unemployment rate of 3.7% is 4.7 points lower than its 1980–99 average of 8.4%. In contrast, the least tight labor market is Hawaii, where the 1999 unemployment rate of 5.5% is 0.4 points above its average over the last 20 years.
We estimate the response of wage growth to unemployment with a standard statistical model that relates unemployment deviations to a measure of state-level wage growth. The latter is derived from the outgoing rotation files of the Current Population Survey (CPS), the monthly survey that is also the source for the national unemployment rate. The wage measure adjusts for differences in worker characteristics, such as age, education, and union status, that might cause wage growth to vary across states.
Our statistical approach also controls for factors, such as expected inflation, that are approximately constant across states in a given year. Unlike the time-series approach, which assumes expected inflation is equal to the previous year’s actual inflation, the cross-state approach does not require that inflation expectations match any observable series. Finally, our estimates are based on a robust regression statistical technique that minimizes the effect of large outliers, such as frequently occur in cross-sectional data.
The first row in figure 3 shows our estimates of the response of wage growth to unemployment based on cross-state data from 1980–99. The coefficient of –0.042 implies that a 10% lower unemployment rate is estimated to reduce wage growth by 0.42 percentage points. This is comparable to, though somewhat lower than, the estimate derived from figure 1 and is highly significant, both economically and statistically. The first row of the figure also shows the rate of real wage growth associated with 4%, 6%, and 8% unemployment. These figures are for expected wage growth relative to the standard measure of price inflation for the business sector and control for the value of nonwage benefits.
3. Relationship between real wage growth and unemployment
| Elasticity of wage growth with respect to unemployment |
Real wage growth associate with unemployment rate of |
|||
| 4% | 6% | 8% | ||
| 1980-99 | -0.042 (0.004) |
3.2 (0.2) |
1.6 (0.2) |
0.4 (0.2) |
| 1980-84 | -0.047 (0.005) |
4.1 (0.4) |
2.2 (0.2) |
0.8 (0.1) |
| 1985-89 | -0.046 (0.005) |
3.1 (0.2) |
1.2 (0.1) |
-0.1 (0.2) |
| 1990-94 | -0.038 (0.006) |
2.8 (0.3) |
1.3 (0.1) |
0.2 (0.1) |
| 1995-99 | -0.032 (0.006) |
2.8 (0.5) |
1.5 (0.2) |
0.6 (0.2) |
Note: Numbers in parentheses are standard errors.
Source: Authors’ calculations based upon data from the U.S. Department of Commerce and U.S. Department of Labor, various years, Current Population Survey.
One of the virtues of the cross-state approach is that we can obtain estimates of the response of wages to unemployment from relatively short subperiods of the data, an exercise that would be close to meaningless using only time-series data. In particular, the remainder of figure 3 shows estimates for four five-year periods and suggests that wage growth has become somewhat less sensitive to unemployment in the 1990s. Specifically, our methodology yields estimates of around -0.045 for the early and late 1980s, but only –0.032 in the late 1990s. (We can reject—at the 10% significance level—that this relationship has not changed over time.) Of course, even in the late 1990s, the estimates are highly statistically significant, suggesting that there is still an important negative correlation between unemployment and wage growth.
There are, moreover, some reasons to believe that the finding of a weakening relationship is not terribly robust. First, when we go to the extreme of estimating a separate elasticity for every year of data, we find that the magnitude of the elasticity has decreased in recent years, with 1998 having the single smallest coefficient. But as recently as 1994 and 1995, the coefficient was about as large as it ever has been. And there have been previous years—for instance 1985 and 1993—in which the coefficient has declined, only to increase again subsequently. Therefore, we would need to see more data before concluding that there has been a permanent shift in the sensitivity of wages to labor market conditions.
Second, the drop in coefficients is dependent on somewhat arbitrary modeling decisions. The statistical model described thus far was estimated using the logarithm of the unemployment rate, implying equal percentage changes in the unemployment rate have equal effects on wage growth. For instance, a change in the unemployment rate from 8% to 6% has the same effect on wages as a change in the unemployment rate from 4% to 3%. In general, we find this assumption to fit the data well. However, an alternative that works almost as well is to assume that equal absolute changes in the unemployment rate have the same effect on wage growth. For instance, a change from 8% to 6% would have the same effect as a change from 5% to 3%. When we reestimate based on this alternative model, we find no evidence of a decline in the sensitivity of wage growth to unemployment. Rather, the late 1980s appear to be the period that was different, having a higher estimated coefficient than the other three periods.
Third, because we chose to construct wage data from the outgoing rotation files of the CPS, our data start only in 1980 (as in figure 3). However, data from the March CPS are available back to 1964. Since wage estimates based on these data are constructed from a single month of data, they are highly variable. Nevertheless, when we used the March CPS data to estimate the effect of unemployment on wages back to 1964, the results suggest a stable relationship between unemployment and wage growth, with elasticity estimates generally near –0.035 except for the 1984–88 period when the elasticity was estimated to be –0.045. Thus, perhaps it was the 1980s, not the 1990s, that were unusual.
Figure 3 also shows estimates by time period of the predicted average real wage growth for unemployment rates of 4%, 6%, and 8% based on our model assuming equal proportionate effects of unemployment and the outgoing rotation files. For an unemployment rate of 4%, predicted real wage growth dropped between the early and late 1980s but has been reasonably constant since then. Our estimates currently predict real wage growth of 2.8% when the unemployment rate is 4%, slightly below its current value. The predicted real wage growth rates associated with 6% and 8% unemployment also fell between the early and late 1980s, and since then have been fairly constant. The 0.6% level of wage growth predicted for 8% unemployment in the last period has, however, returned to about its level for the early 1980s.
If there was a decline in the wage–unemployment relationship, what caused it?
As we mentioned earlier, if some shift in the relationship between labor market conditions and real wage growth in the 1990s occurred, it would not be terribly surprising given the many changes in the labor market in recent years. In previous work, we explored two possible culprits: the changing nature of the workforce and the relative decline of job security.
Many researchers have shown that wage growth among college-educated workers is less sensitive to unemployment than that among other workers. Thus, the increasing share of college-educated workers in the U.S. economy during the 1990s could cause a decline in the wage–unemployment relationship. However, we believe that this is not the case. A decline in the sensitivity of wages to unemployment is seen both for noncollege and college workers during the 1990s. This is also true when we split the sample by occupation or industry. Therefore, something other than a compositional shift toward skilled workers explains the diminished late-1990s wage–unemployment relationship.
We also do not believe that changes in job security can explain a shift in the sensitivity of wages to labor market conditions. In previous work, we describe why real wage growth could be related to job insecurity and empirically show that, in fact, such a relationship exists over the last 20 years. However, the sensitivity of wages to involuntary job loss, our measure of job security, is statistically and economically important only for less-educated workers, much like in the unemployment–wage growth literature. There is no robust effect on higher-educated workers. But the rise in involuntary job loss during the 1990s occurred primarily among more-educated workers. Therefore, while we find evidence that job security is related to real wage growth, it cannot explain any trend in real wage growth during the 1990s.
Conclusion
We have shown that the negative cross-state correlation between unemployment and wage growth persists even in recent data. We find some evidence of a decline in the sensitivity of wage growth to unemployment and other labor market measures in the late 1990s. But we regard that evidence as being somewhat weak. Quantitatively, the changes in predicted wage growth based on estimates for recent years are not enormously different than in previous years.
Our results have implications for work on inflation forecasting. Traditional short-run, or expectations-augmented, Phillips curve methodologies have tended to overpredict the change in inflation in recent years. That methodology depends upon both the relationship between unemployment and expected wage growth and the relationship between wage growth and price inflation. Given the many fundamental changes that may be affecting the labor market, it is natural to look for a change in the relationship between unemployment and wage growth. But our finding that the cross-state relationship between unemployment and wage growth has been relatively stable suggests that more attention be given to the link between wage growth and price inflation as the source of instability in the short-run Phillips curve. This seems consistent with findings such as in Brayton et al. (1999) that adding variables to account for variation in the markup of prices over wages may be the most attractive way to stabilize the relationship between unemployment and changes in price inflation.2
Notes
1 More detailed information is available in Daniel Aaronson and Daniel Sullivan, 2000, “Recent evidence on the relationship between unemployment and wage growth,” Federal Reserve Bank of Chicago, working paper, No. 00-27, and Daniel Aaronson and Daniel Sullivan, 1999, “Worker insecurity and aggregate wage growth,” Federal Reserve Bank of Chicago, working paper, No. 99-30.
2 Flint Brayton, John Roberts, and John Williams, 1999, “What’s happened to the Phillips curve?,” Board of Governors of the Federal Reserve System, working paper.


