

The following publication has been lightly reedited for spelling, grammar, and style to provide better searchability and an improved reading experience. No substantive changes impacting the data, analysis, or conclusions have been made. A PDF of the originally published version is available here.
An analysis of regional labor quality growth places the Midwest near the center of the U.S. labor quality distribution. To maintain its relative position going forward, the Midwest will have to increase its share of workers with post-secondary education. This will require policies that not only promote the education of its residents, but also efforts to make the region more attractive to the highly mobile population of college graduates.
The rate of improvement in workforce quality is among the key determinants of an economy’s potential rate of growth. Indeed, in previous work, we have shown that increases in a simple labor quality measure that quantifies the effects of such factors as educational attainment and labor market experience account for roughly 10% of U.S. labor productivity growth since 1964.1 Moreover, this contribution of worker quality improvement to economic growth has varied substantially over time, reflecting variation in the rate of increase in educational attainment and the aging of the workforce. However, over this period, not all regions of the U.S. developed human capital at the same rate. In this Chicago Fed Letter, we provide estimates of the rate of improvement in the quality of regional workforces, with particular emphasis on the Midwest.
Although we show that broad patterns of human capital accumulation are similar across regions, there are some notable contrasts as well. In particular, regions, chiefly in the South, that historically have had relatively low levels of human capital have been slowly converging to the levels of regions, particularly the West, that historically have had relatively high levels of human capital. This convergence has been driven primarily by a reduction in disparities in educational attainment, particularly high school graduation. By our measure, average worker quality in the Midwest is strikingly similar to the overall U.S. average. In fact, this similarity has existed, without interruption, since the 1960s.
Though the Midwest is close to the national average in overall human capital, it arrives at that average in a particularly midwestern manner, with a strong showing at the lower end of the educational distribution and a less impressive performance at the high end. As a result, in the Midwest, educational attainment is concentrated more in the middle ranges, with both fewer high school dropouts and fewer college graduates than in the nation. This, perhaps, poses a challenge for the region. Because a high school education is already nearly universal in the Midwest, further reductions in the fraction of dropouts may be more difficult to achieve. To keep up with the nation in the development in overall human capital, the Midwest may need to improve its relative performance in training, attracting, and retaining college graduates.
What is worker quality?
Our measure of worker quality is derived from economic models of human capital accumulation. Workers are assumed to invest in productivity-increasing skills through formal education and on-the-job training, while firms are assumed to hire additional labor until workers’ marginal productivity coincides with their wage rate. The latter assumption allows us to infer the effects of worker characteristics on productivity, which are not directly observable, from their effects on predicted wages, which can be estimated from cross-sectional data on workers’ wage rates and indicators of their human capital. In particular, we use data on individual workers from the Current Population Survey (CPS) to estimate statistical models of wage determination that value workers’ education, experience, and other characteristics. We then apply these value estimates to the changing distributions of worker characteristics to obtain estimates of the growth in overall worker quality.
To be sure, the available data on worker characteristics only begin to scratch the surface in explaining the determinants of wages and productivity. For instance, the productivity increase associated with obtaining a college degree likely depends on the program of study, the quality of the institution, and a myriad of other factors. But available data sources merely record whether a worker has a college degree. Similarly, the productivity increase associated with a year of work experience will vary with the nature of the work, how much time is devoted to training, and other factors. But data sources do not include such information. Indeed, our measure of worker quality growth is based on proxies for years of work experience derived from the difference between a worker’s age and their years of formal education. Unobserved differences in time out of the labor force due, for example, to raising children, will lead such proxies to differ from actual experience. Though imperfect, our measure of labor quality does, however, summarize the impact of observable labor force characteristics on productivity.
Trends in human capital accumulation
We begin by documenting some of the broad trends in educational attainment that underlie our estimates of worker quality growth and show how these trends differ across regions. We focus on educational levels because, while factors such as the aging of the workforce and the increase in female labor force participation have significant impacts on the growth of labor quality over time, they have less impact in differentiating labor quality across regions.
U.S. levels of formal education have expanded greatly over the last century. During this period, high school graduation went from a rarity to the norm. College attendance and graduation rates also rose rapidly during the twentieth century, especially after WWII with the introduction of the GI Bill and increased federal funding of higher education. Increasing graduation rates have led to a corresponding increase in the percentage of workers with high school and college education. Over the last several decades, the increase in educational attainment has generally been greater in regions that started at lower levels, leading to some convergence in regional educational attainment.
Figure 1 shows the share of workers with a high school diploma in the U.S. and the East North-Central Census region, which we will refer to as the Midwest. In addition, the figure shows the levels of high school attainment in the Census regions with the highest and lowest fraction of high-school-educated workers.2 In 1964, 57.7% of U.S. workers had completed high school, with the rate varying from 44.0% in the East South-Central region to 68% in the West region. By 2001, the last year for which data are available, the overall rate had increased to 89.4%, varying from 85.2% in the West South-Central region to 92.5% in the West North-Central region. In general, the progress was more rapid in the regions that started at low levels of high school attainment, leading to the convergence evident in the figure.
1. Proportion of workers with at least high school
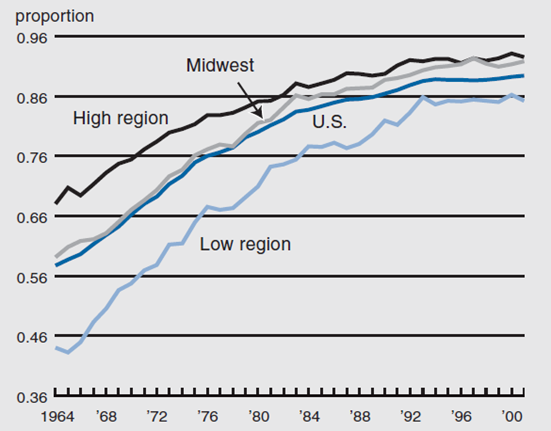
Since the mid-1960s, Midwest rates of high school attainment have nearly always exceeded those in the rest of the nation. From the late 1960s through the early 1980s, the gap was typically quite small. Since the mid-1980s, however, the Midwest has seen noticeably more progress in high school attainment than the nation as a whole. Indeed in 1998 and 1999, the Midwest recorded the highest regional rates of high school attainment, and its 2001 level of 91.8% was less than a percentage point below the leading region. Given the very low relative wages earned by workers without a high school diploma, the Midwest’s relatively strong showing in high school attainment has been a significant factor in boosting average labor quality in the region. However, rates of increase have slowed, as high school attainment has become nearly universal, limiting the boost to labor quality that can come from this avenue in the future.
Figure 2 displays the growth in the fraction of workers with at least some post-secondary education.3 For the nation as a whole, the fraction of such workers increased from 22.6% in 1964 to 58% in 2001. Regional rates of post-secondary educational attainment also converged, though somewhat less dramatically than in the case of high school attainment.
2. Proportion of workers with at least some college
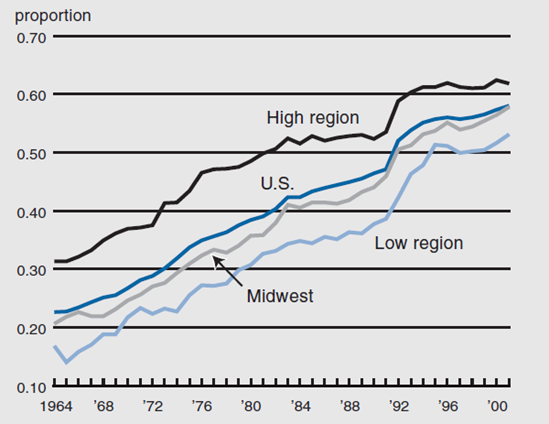
In 1964, rates of post-secondary attainment ranged from 16.9% in the East South-Central region to 31.3% in the West region, a range of 15.4 percentage points. In 2001, the same two regions were at the top and bottom, but their rates had risen to 53.2% and 61.9%, respectively, a gap of only 8.7 percentage points.
In contrast to its relatively high levels of high school attainment, until very recently the Midwest had lagged behind the nation in its rate of post-secondary educational attainment. From the mid-1960s through the late 1980s, workers in the Midwest were often two percentage points or more less likely to have had some college education than the typical U.S. worker. However, that gap has narrowed since the early 1990s, and the Midwest rate was only a tenth of a percentage point below the national average in 2001. Given that increases in rates of post-secondary educational attainment show no sign of slowing, continued progress in raising such rates is likely to become increasingly important to maintaining the Midwest’s relative position in overall labor quality.
Figure 3 shows that, for the country as a whole, the fraction of college graduates increased from 11.8% in 1964 to 28.4% in 2001. Unlike the convergence we have seen in regional rates of high school and post-secondary educational attainment, regional rates of college completion have actually diverged. In 1964, college graduation rates ranged from 9.2% in the East South-Central region to 15.1% in the West region, a spread of 5.9 percentage points, while in 2001 the range was from 23.1% in the East South-Central region to 32.8 % in the New England region, a spread of 8.9 percentage points.
3. Proportion of workers with college degree
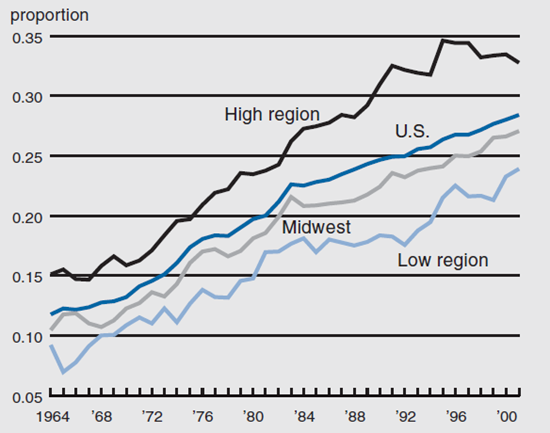
Figure 3 also shows that the Midwest has long lagged behind the rest of the nation in the fraction of workers with a college degree. Indeed, the figure suggests that the gap relative to the rest of the nation may have increased slightly after about 1980. The Midwest rate of 27.1% in 2001 was 1.3 percentage points below the national average. Because workers with college degrees tend to be more mobile than other workers, factors other than the generosity of support for higher education influence the share of a region’s workforce with degrees. The Midwest may be at a disadvantage in attracting and retaining college-educated workers. Still, given its current position, increasing the rate of college graduates in its workforce represents an opportunity for the Midwest to improve its labor quality.
The Worker Quality Index
Our composite estimates of labor quality summarize the impact on productivity of the above trends in educational attainment, along with other changes in the workforce. To derive these estimates, we use the 1980 CPS data for the nation as a whole to estimate a statistical model that relates wage rates to workers’ education, potential experience, sex, and other characteristics. We then use that model to predict what workers in other years would have earned in 1980. The average of these predictions is worker quality. By focusing on the growth of such predicted wages, we isolate the portion of wage growth that is due to the changing composition of the workforce rather than accumulation of physical capital or technical progress. These latter factors raise the value of an hour supplied by a worker with a constant level of human capital.
Figure 4 displays our estimates for 1964 through 2001 for the U.S., the Midwest, and the regions with the lowest and highest labor quality. The typical worker of 1964 would have earned about $4.62 per hour in the labor market of 1980, while the typical worker of 2001 would have earned about $5.16 in 1980. This represents an 11.7% increase in labor quality or about three-tenths of a percentage point increase per year. Though changes in the distribution of potential experience and the fraction of women in the labor force had important effects on the rate of labor quality growth over certain periods of time, most of the overall increase since the mid-1960s is due to the increases in educational attainment documented above.
4. Labor quality
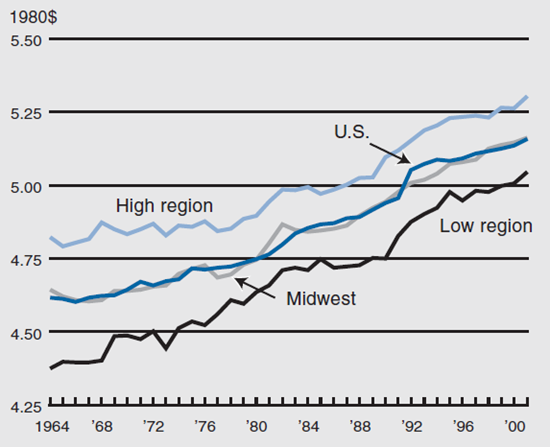
It is also clear from figure 4 that labor quality in the various regions of the country has converged to a significant extent since the mid-1960s. For instance, in 1964, labor quality in the West (the region with highest labor quality) was more than 10% higher than in the southern regions. By 2001, however, the gap had shrunk to about 5%. This was largely due to the faster increase in the fraction of workers with high school or some college education that occurred in the states that started with lower labor quality. Throughout the period of our data, overall Midwest labor quality has been extremely close to the national average. Indeed, though not shown in the figure, each of the five states in the Midwest region is tightly bunched around this norm, with Michigan just slightly above and Indiana and Wisconsin just slightly below the national average. As shown above, this reflects the offsetting effects of having both fewer high school dropouts and fewer college graduates.
Conclusion
Labor quality has risen significantly since the mid-1960s. The 11.7% increase in our index of labor quality accounts for about 10% of the growth in U.S. labor productivity over the period.4 Labor quality has, moreover, converged across the various regions of the country, with the gap between the highest and lowest regions now about half as large in percentage terms as it was in the mid-1960s. The Midwest has been, and continues to be, very near the national average of labor quality.
The fact that the Midwest has gotten to its current position near the center of the labor quality distribution by having a higher-than-average share of workers with a high school education perhaps poses a problem going forward. With the share of workers with high school degrees already quite high, it will be difficult to increase it significantly further. To keep up with the rest of the nation, the Midwest will have to increase its share of workers with post-secondary education. This will require policies that not only promote the education of its residents, but also those that make the region attractive to the highly mobile population of college graduates.
Notes
1 See Daniel Aaronson and Daniel Sullivan, 2001, “Growth in worker quality,” Economic Perspectives, Vol. 25, No. 4, pp. 53–74. This paper also contains a detailed discussion of our methodology.
2 Data come from the annual March supplements to the CPS. The East North-Central region is composed of Ohio, Michigan, Indiana, Illinois, and Wisconsin. There are eight other Census regions.
3 A portion of the relatively large increase in the fraction of workers with some college education that occurred in 1992 is due to a change in the CPS educational attainment question. Aaronson and Sullivan (2001) discuss how we mitigate the effects of this change on our measure of labor quality.
4 In the standard growth accounting framework, the contribution of labor quality to labor productivity is the product of the growth in labor quality and the share of labor in total costs, which is about two-thirds.


