

The following publication has been lightly reedited for spelling, grammar, and style to provide better searchability and an improved reading experience. No substantive changes impacting the data, analysis, or conclusions have been made. A PDF of the originally published version is available here.
The increase in housing prices in the past ten years can largely be explained by falling mortgage interest rates and changes in household income. This article offers some projections of what might happen to housing prices if mortgage rates increase.
The median price for a single-family home has increased at an accelerating pace in the past ten years, after a period of moderate price increases in the ten years prior to that (see figure 1). From 1985 to 1994, prices rose at a real rate of about 1% per year. The rate of increase rose to 3.9% per year during 1995–2004, with a significantly higher annual rate of 4.9% in the second half of that ten-year period. Some believe that the rapid increase in housing prices is a sign of a bubble.1 In this Chicago Fed Letter, I document changes in the median sale price of a house in the United States and for major markets in the Seventh Federal Reserve District.2 I show that the increase in housing prices in most areas, including the Seventh District, can be largely explained by falling mortgage interest rates and changes in household income. I also offer some projections of what might happen to housing prices if mortgage rates increase.
1. Housing prices and CPI-OER index, 1985–2004

The median sale price of an existing U.S. single-family house was $187,467 at the end of 2004. This compares with $112,619 at the end of 1984 and $126,076 at the end of 1994 (all figures are in 2004 dollars). To put the price increases over time into context, I compare them with a proxy for the earnings power of housing stock. I then account for changes in personal income and mortgage interest rates.
An owner-occupied house combines a flow of services with an investment good. The homeowner gets to live in the house in lieu of renting and gets a potential return on the equity in the house. In a stable market, the return on home equity should parallel that of other investments with a similar risk profile. To split the change in housing prices into the rental equivalent portion and the return on equity portion, I use the owners’ equivalent rent component of the Consumer Price Index (CPI-OER) as a proxy for rental income.3 The ratio of the median sale price of an existing single-family home to CPI-OER gives a picture of home buyers’ expectations of price appreciation on their purchases. This is, in essence, a price to earnings ratio.4 House prices rising much faster than the stream of rental income could be a sign that a bubble is forming.
As figure 1 shows, housing prices and the rental index moved together until the late 1990s. At that point, the rate of increase in housing prices exceeded the change in the rent index. Some have taken this as an indication of an overheated market.5
Housing prices, income, and interest rates
Recent years have seen long-term interest rates, including mortgage rates, decline significantly.6 If potential homeowners determine the price they are willing to pay by the size of the mortgage payment it generates, then lower interest rates can lead to higher house prices. I create a mortgage-servicing index by assuming that a home buyer uses a down payment equal to 20% of the purchase price and finances the rest with a 30-year fixed-rate mortgage. Then, the mortgage-servicing index is simply the ratio of mortgage payment on the median sale price of an existing single-family home to the median household income. Viewed through this lens, figure 2 shows that housing is more affordable now (that is, the index is lower) than it was ten years or 20 years ago. It takes less than 16% of the median household’s income to pay the mortgage on a house with the median sale price. This compares with ratios over 20% in the mid-1980s and at least 18% prior to 1990. Since the mortgage-servicing index has been relatively steady over the last decade, the run-up in housing prices, especially in the last five years, may be in large part an artifact of low interest rates.
2. Mortgage-servicing index and mortgage rates, 1985–2004
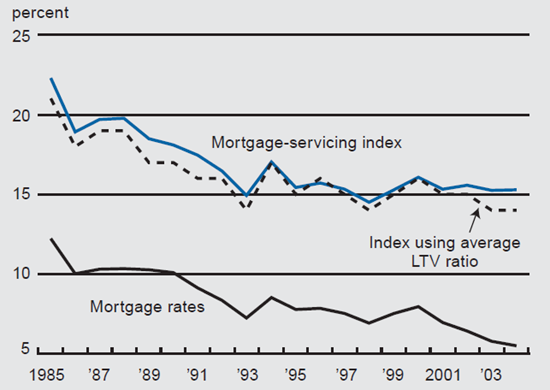
Sources: Author’s calculations based on data from National Association of Realtors; U.S. Department of Commerce, Bureau of Economic Analysis; and Federal Home Loan Mortgage Corporation.
A potential criticism of this measure of housing affordability is that it assumes that down payments have not changed over time. However, the findings are qualitatively similar using the actual average down payment rather than 20% to estimate the mortgage servicing index (dashed line in figure 2).
What happens when interest rates increase?
An open question now that interest rates are trending up again is how housing prices will respond to the rate increases. The best evidence we have from the recent past is the 1994 increases in interest rates. Mortgage rates rose from 7.3% in 1993 to 8.5% in 1994, leading the mortgage-servicing index to increase from 14.9% in 1993 to 17% in 1994. While the higher index values signaled that housing was less affordable in 1994 than in 1993, this quickly reversed, with affordability increasing in 1995 as the index declined to 15.4%. The index remained roughly at this level for the next ten years, even as housing prices rose.
We can use the mortgage-servicing index to test the effects of increasing interest rates on housing prices. Figure 3 shows that for modest increases in interest rates, the decline in housing prices will also be modest. The simulation in the table looks one year ahead, assuming that nominal income rises by 5% (approximately the rate of change in recent years). In 2004, the average mortgage rate was 5.8% and the mortgage-servicing index was 15.8%. If mortgage rates and the mortgage-servicing index continue at the same levels for 2005, house prices will increase by 1%, reflecting the impact of the assumed increase in income. However, most analysts believe that mortgage rates in 2005 will be higher than they were in 2004. As of February 2005, the Blue Chip forecast of mortgage rates for the fourth quarter of 2005 ranged from 5.9% to 7.6% with a mean of 6.5%. If mortgage rates rise from 5.8% to 6.5% and the mortgage-servicing index remains at its year-end 2004 value of 15.8%, then housing prices will fall by 6.5%. The 1994 experience indicates that, in the short run at least, the mortgage-servicing index is likely to stay steady or rise somewhat following a mortgage rate increase. This suggests that any decline in housing prices will be modest if mortgage rates rise to 6.5%. Of course, larger increases in rates translate to larger simulated price decreases. For example, if mortgage rates were to rise to 7.5% in the fourth quarter of 2005 while the mortgage-servicing index remained constant, housing prices could fall by 15.5%. In this case, homeowners would lose roughly three years’ worth of price increases.
3. Simulated change in housing prices, one year ahead
| Mortgage rate (%) | Mortgage-servicing index |
|||
| 15.0% | 15.8% | 16.0% | 17.0% | |
| 5.8 | -4.4% | 1.0% | 1.9% | 8.3% |
| 6.0 | -6.5 | -1.0 | 0.0 | 6.0 |
| 6.5 | -11.0 | -6.5 | -5.4 | 0.0 |
| 7.5 | -19.8 | -15.5 | -14.5 | -9.1 |
Sources: Author’s calculations based on data from National Association of Realtors; U.S. Department of Commerce, Bureau of Economic Analysis; and Federal Home Loan Mortgage Corporation.
Seventh District housing market
Because housing markets are by their nature local, and examining national trends can miss important differences across markets, I review changes in prices and affordability for selected markets in the Seventh District, comparing them to other major markets. Home prices in the Seventh District are generally below national averages, except in the Chicago metropolitan area. While housing prices have increased over the past 20 years, the rate of increase has varied significantly across the Seventh District—it was largest in the Chicago metropolitan area and smallest in the Indianapolis metropolitan area. Prices in the Detroit and Milwaukee metropolitan areas have shown significant strength throughout this period, while in Chicago and, to an extent, Milwaukee, prices have increased more rapidly in the past few years.
Although prices have increased, housing affordability in the Seventh District has generally stayed the same or declined somewhat. Figure 4 shows the mortgage-servicing index for the Chicago, Indianapolis, Detroit, and Milwaukee metropolitan areas. Notably, homes remain more affordable in Indianapolis than elsewhere in the District. Both Chicago and Milwaukee track the overall U.S. mortgage-servicing index quite closely. While prices in both areas have risen in recent years, the increases are only slightly more than in the country as a whole and affordability has not decreased significantly. There is no evidence of the rapid growth seen in other areas such as California.
4. Mortgage-servicing index, 7th District metro areas
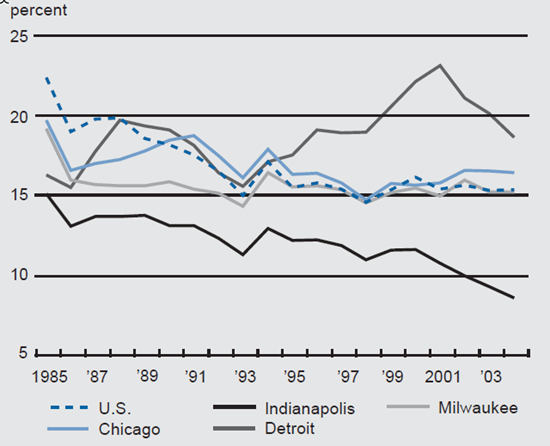
Prices in the Detroit metropolitan area jumped in the late 1990s but have increased at a much slower rate since then. The evidence suggests that Detroit is less affordable than other local markets, but the affordability gap has closed significantly in the past three years. This is driven at least in part by the weak economic conditions in the area rather than by the bursting of a housing price bubble.
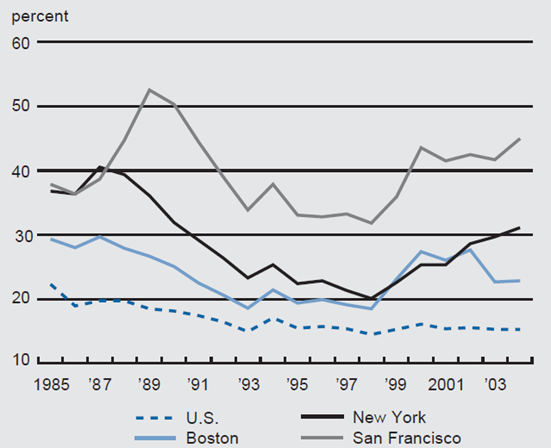
For reference, figure 5 shows the mortgage-servicing index for the Boston, New York, and San Francisco metropolitan areas. Not surprisingly, housing is less affordable, and the mortgage-servicing index is much more variable, in these areas than in the Seventh District. The mortgage-servicing index in San Francisco fell from 52.5% in 1989 to 31.8% in 1998, before rising to 45% in 2004. Boston had a similar swing in affordability, with the index falling from 29.7% in 1987 to 18.6% in 1993, before rising to 27.7% in 2002. Since then, housing prices have declined in the Boston metropolitan area, and the mortgage-servicing index was down to 22.8% at the end of 2004. These factors alone do not indicate bubblelike conditions in any of these markets. However, the recent increase in prices in New York and San Francisco leave those markets with housing that is much less affordable than their 20-year averages.
5. Mortgage-servicing index, selected metro areas
Conclusion
The rapid rise in housing prices has led some observers to fear that we are in the midst of a housing bubble. Housing prices have indeed risen in recent years. However, the increase in housing prices has come at the same time as mortgage rates have declined and incomes have increased. I present a simple mortgage-servicing index that indicates that these two factors have kept housing affordability for the U.S. as a whole roughly constant as housing prices have increased.
Further, housing price increases in the Seventh District have been moderate compared to increases in some other parts of the country, such as some markets on the East and West coasts. Housing affordability has generally been stable and near the national average in the District. The analysis here suggests that if mortgage rates rise, housing prices in the country as a whole, as well as in the Seventh District, may stabilize or fall slightly. If housing affordability remains roughly constant, any decline in prices is likely to be moderate. Even if mortgage rates rise to 7.5%, well above their 5.8% average for 2004, housing prices in most markets are likely to remain at or above their 2000 levels.
One limitation of this exercise is that I use the median sale price of an existing single-family home.7 Thus, there may be trends in housing prices for particular segments of the market that are missed by this analysis. For example, the most expensive homes in a market may be more vulnerable than the median home to changes in mortgage rates. If so, then prices for these homes might moderate more when rates rise.
Another limitation is that the mortgage-servicing index assumes borrowers use a traditional fixed-rate mortgage. As mortgage rates increase, some purchasers may use more aggressive financing options, such as adjustable-rate mortgages or interest-only mortgages.8 If rates continue to rise, these borrowers may feel the pressure to sell more than those with more traditional mortgages. In addition, as Federal Reserve Chairman Alan Greenspan noted in a recent speech, there has been an increase in the share of homes purchased for investment.9 Again, speculators may be quicker to sell if house prices start to weaken. This could put additional downward pressure on prices in some markets.
Notes
1 Often the claim that there is a bubble is based on an increase in prices. However, even if prices are too high, there may not be a bubble. According to Edward Leamer of UCLA, the term “bubble” might be a misnomer since housing price declines are “very slow, painful processes” (San Francisco Chronicle, February 10, 2005).
2 The Seventh Federal Reserve District comprises all of Iowa and most of Illinois, Indiana, Michigan, and Wisconsin.
3 Other rent indexes give similar results.
4 See Edward Leamer, 2002, “Bubble trouble? Your house has a P / E ratio too,” UCLA, Anderson forecast, June.
5 See, for example, Wall Street Journal, 2005, “In the hottest markets, renting is the real bargain,” March 22.
6 After declining through 2002, mortgage rates have moved in a narrow range in the last few years. They have not risen significantly since the Federal Reserve began raising interest rates in June 2004.
7 The Census Bureau puts out an index constructed to hold housing quality constant at 1996 levels (called the price index of new one-family homes sold including the value of the lot). An analysis using this index gives qualitatively similar results to the data used here.
8 According to the Mortgage Bankers Association, the percentage of mortgages that are adjustable rate averaged 18% from 1998 to 2003 but rose to 46% in the second half of 2004. In addition, the rate of interest-only mortgages has gone up in recent years. According to a study conducted for the Wall Street Journal, 61% of mortgages in California during the first two months of 2005 were interest-only compared with less that 2% in 2002 (Wall Street Journal, May 17, 2005). Nationwide, the proportion of interest-only loans was 17%.
9 Speech by Federal Reserve Board Chairman Alan Greenspan on globalization to the Council on Foreign Relations, New York, March 10, 2005.


