As the pandemic engulfed the globe in 2020 and economies struggled under the weight of lockdowns, financial markets faced tremendous stress. Even the market for U.S. Treasury bonds and notes—the deepest, most liquid financial market in the world—sputtered in March of 2020 (see figure 1), as did the related market for Treasury futures. Our focus in this article is on the market for U.S. Treasury futures, derivatives that track prices of specific Treasury securities. A large and important market in its own right, the Treasury futures market has recently seen over $350 billion of notional value traded daily and $1.5 trillion in notional value outstanding.1 Notional value refers to the face value of the underlying Treasury securities at maturity. Each contract typically has a notional value of $100,000.
A crucial aspect of the Treasury futures market is that market participants who trade them are required to post collateral. The requirements help cover losses in the event that participants do not fulfill the obligations of their futures contracts. Sharp increases in the collateral amounts required can add to market stress by potentially draining liquidity from financial markets. Therefore, regulations and international standards aim to prevent unnecessarily dramatic changes of such requirements. In this Chicago Fed Letter, we examine how collateral requirements changed during the March 2020 market volatility. We find that despite the extreme market shocks, collateral requirements did not necessarily increase in proportion with volatility, and a substantial fraction of the collateral increases were due to the rising value of underlying Treasury securities following declines in interest rates. Moreover, we find that given a considerable increase in market value of Treasury securities, it is more meaningful to measure the increase in collateral requirements in terms of market value than measuring in notional value.
There has been commentary that the increase in collateral requirements in the derivatives market created severe liquidity pressures that were generally believed to be destabilizing. The findings in this Chicago Fed Letter imply that the increases in collateral requirements were generally warranted in the U.S. Treasury futures market. Moreover, the increase in collateral requirements in U.S. Treasury futures should not be viewed as a major driver of destabilization in the financial markets.
How are U.S. Treasury futures structured?
Most Treasury futures are physically settled.2 That is, participants who hold short positions at expiration will need to deliver a security matching the type specified in the contract. Conversely, the participants who hold long positions will need to make a payment and accept delivery of the relevant security. Each contract allows sellers to deliver a security from a spectrum that can vary substantially in maturity (term of the bond or note) and coupon (interest payable on the bond) when the contract expires. That way, sellers can easily find a security to deliver, which in turn makes the Treasury futures market more liquid, and in some cases more liquid than the underlying cash securities.
To make all deliverable securities equivalent in the eyes of contract buyers, Treasury future contracts specify conversion factors. Conversion factors adjust the price that buyers pay based on the maturity and the coupon of the Treasury security they would receive. In practice, conversion factors are imperfect. Contract sellers can find Treasury securities that are cheaper to deliver than others even after applying the conversion factor. The securities that are cheapest to deliver are called just that—cheapest-to-deliver (CTD). Typically, the prevailing market price of Treasury futures is most correlated with the market price of the CTD.
Treasury futures contracts can last for months so market participants minimize the risk of counterparty default by having the contracts cleared and guaranteed by a central counterparty (CCP), in this case the Chicago Mercantile Exchange Clearing (CME). CCPs are entities that manage counterparty risk among market participants. When CME clears a Treasury futures contract, it institutes risk-management measures to help ensure that both parties in the contract meet their obligations.
One of the most important measures and the one we’re focusing on here is collateral, or in this case initial margin (IM). CME requires that both parties in a Treasury futures contract post initial margin. If one party defaults on their side of the contract, their initial margin is used to cover any resulting losses, including mark-to-market or costs incurred to replace the counterparty that defaulted. Accordingly, the CCP sets initial margin based on the expected market risk, estimated by the CCP using quantitative modeling methods along with any relevant subject matter expertise or additional qualitative analysis.
How are Treasury futures used?
As with other derivatives, Treasury futures are frequently used as a tool to hedge risk. Typically banks or bank-affiliated broker-dealers use U.S. Treasury futures as short-term hedges against price declines of Treasury securities held in their portfolios. Also, asset managers use Treasury futures to hedge portfolio duration, or to hedge risk at specific bond or note maturities. Futures contracts are also used to manage portfolio liquidity and as a simple means of asset allocation for large-scale purchasing or selling.
Another common investment strategy involving Treasury futures is the cash-futures basis arbitrage.3 Since the futures contract settles into a cash security, the prices of both financial instruments ultimately must converge at expiration, but prior to then there may be a difference between the two—this is the basis. In order to take advantage of the basis, market participants will go long the financial instrument that is relatively cheaper and short the financial instrument that is more expensive. In the run-up to the March 2020 shock, the basis indicated that the underlying cash securities were cheaper than the futures contracts, i.e., a negative basis. As the Covid pandemic spread and led to stress in the financial markets, this basis widened.
While the use cases of Treasury futures vary, the market is important for both hedging and risk-taking. With a size in excess of $1.5 trillion in notional outstanding, market participants and regulators have focused on the events and issues that arose in March of 2020 in relation to the Covid pandemic.
U.S. Treasury futures in March 2020
As pandemic concerns spread globally in early 2020, there was an initial flight to safety where market participants bought U.S. Treasury securities, driving Treasury yields lower and raising prices during the end of February. In the middle of March, the expectations of economic slowdown increased significantly, which led market participants to sell assets, including U.S. Treasury securities, in order to store up their cash holdings—this episode has been deemed the “Dash for Cash” by the Financial Stability Board (FSB). Figure 1 shows both of these swings reflected in the change in the ten-year and 30-year Treasury yields. The increase in price volatility as well as the widening in bid–ask spreads reached levels last observed in the 2008–09 global financial crisis. Subsequently, market conditions became more orderly as the Federal Reserve purchased Treasury securities in large quantities to support the market.
1. U.S. Treasury yields
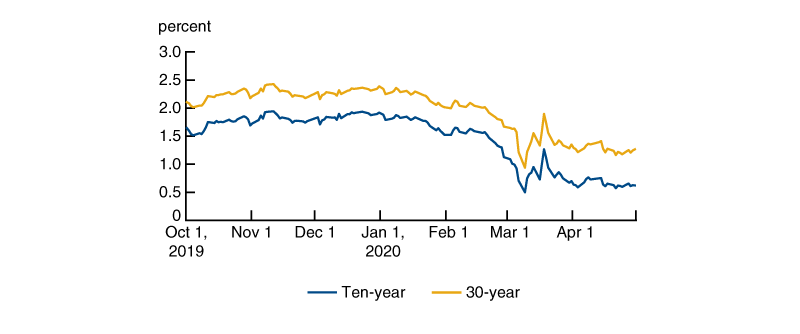
In the Treasury futures market, we saw that volumes increased and open interest4 decreased, particularly for the longer-dated Treasury futures contracts.5 While the decrease in open interest in futures positions could be a shift of risk exposures to cash securities, it stands to reason that in this case most of the decrease was driven by closing out of futures positions.
The measurement of contract value or volumes for derivative contracts is commonly quoted in notional terms. Most Treasury futures have an underlying base notional value of $100,000. The notional value of the futures contract is based on an underlying $100,000 in face value of a Treasury security with a 6% coupon of the matching maturity, or equivalent per the conversion factors of a Treasury security with a different coupon and/or maturity.
In the Treasury securities market, the market value can diverge from face value as interest rates change; similarly, the market value of a Treasury futures contract can diverge from the base notional value referenced in the contract specifications. For example, if interest rates fall below 6%, the market value of a Treasury note with a 6% coupon will be higher than face value and will therefore increase the market value of the corresponding futures contract. As interest rates decreased in 2020, the divergence became larger as market value of the Treasury securities and related futures contracts increased substantially.
How did collateral requirements adjust?
As we mentioned earlier, CCPs that clear derivatives require collateral in the form of initial margin to cover the market risk of replacing a counterparty of a trade. A key determinant of IM is volatility of the contract. Given the heightened market volatility in March 2020, CME increased its IM requirements for Treasury futures. To gauge the IM requirement changes, we have measured the changes in three ways:
- IM required relative to notional value;
- IM required relative to market value; and
- IM required relative to the interest rate sensitivity of the underlying CTD security in basis points.
Looking at the IM required for the ten-year Treasury contract,6 we see the IM increased from $1,150 per contract on February 28, 2020, to $1,850 on March 31, 2020. This means the required IM went from 1.15% to 1.85% of the base notional value of the contract. However, since the market value increased during the period, apart from a short-lived drop in the second week of March, IM as a ratio of market value went from 0.85% to 1.33% per contract. These trends are shown in figure 2.
2. Initial margin ratios for the ten-year Treasury future
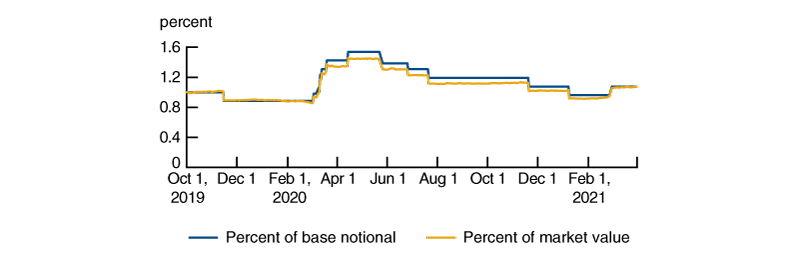
Sources: Authors’ calculations based on data from CME Group Inc. and Bloomberg L.P.
For 30-year Treasury futures (Ultra Bond U.S. Treasury bond contracts), the IM increased from $4,500 per contract to $14,000. That translates to increasing from 4.5% to 14.0% as a ratio of base notional. Similar to the ten-year contract, the 30-year futures contract’s market value was increasing as rates dropped, and therefore the IM as a ratio to market value increased from 2.18% to 6.31%. These trends are shown in figure 3.
3. Initial margin ratios for the 30-year Treasury future
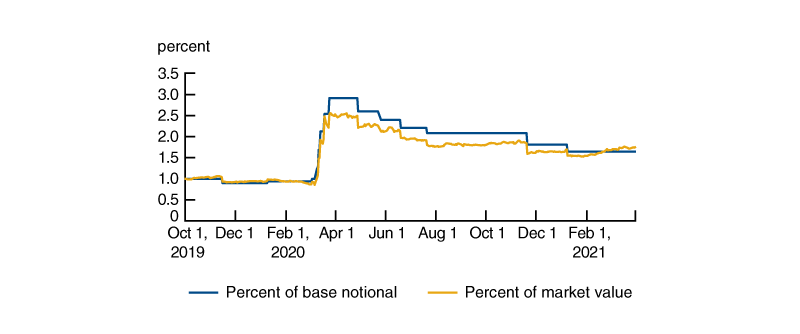
Sources: Authors’ calculations based on data from CME Group Inc. and Bloomberg L.P.
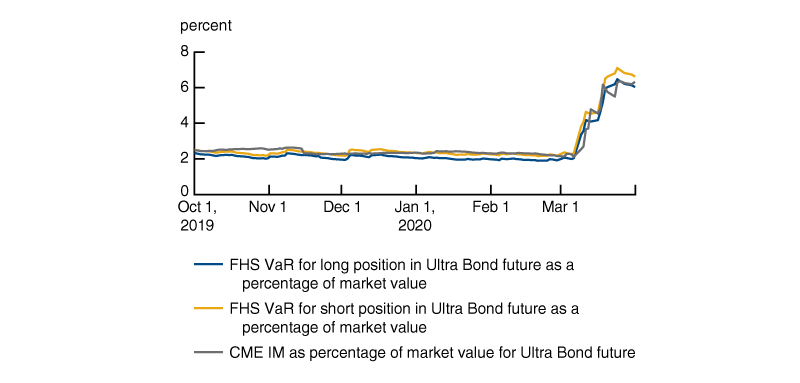
To understand how much of the IM increase was justified by higher market volatility, Patel (2022) modeled market risk using filtered historic simulation value at risk (FHS VaR). FHS VaR models are widely used by financial market participants, including CCPs, to estimate market risk. FHS VaR is a model where the estimated risk of loss accounts for recent changes in market volatility. So as market volatility increases, so does the estimated risk of loss in FHS VaR and vice versa as volatility decreases. Based on the FHS VaR modeling in that paper, the IM for the ten-year Treasury note future increased by less than the increase in market risk, while the 30-year Ultra Bond generally increased commensurate with the change in market risk. Specifically, the IM increased by around 60% and 190% as a percentage of market value, respectively, while the values with a pure FHS VaR model increased by around 120% and 210% for the same respective contracts. Figures 4 and 5 show the comparison of the IM requirements from CME against the FHS VaR results for the two Treasury contracts.
4. IM requirement by CME versus FHS VaR results for the ten-year Treasury note future
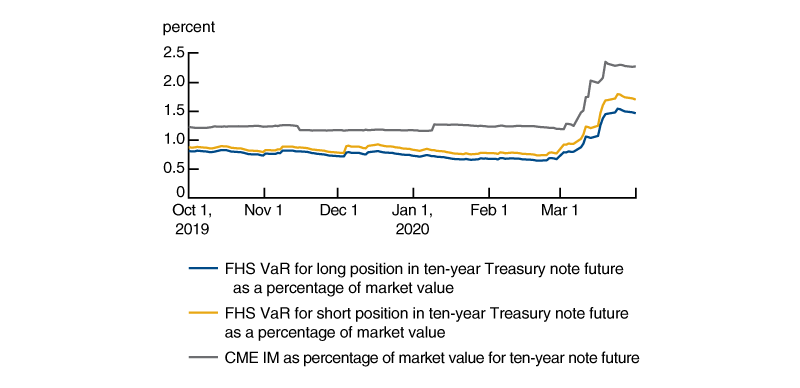
5. IM requirement by CME versus FHS VaR results for the 30-year Ultra Bond future
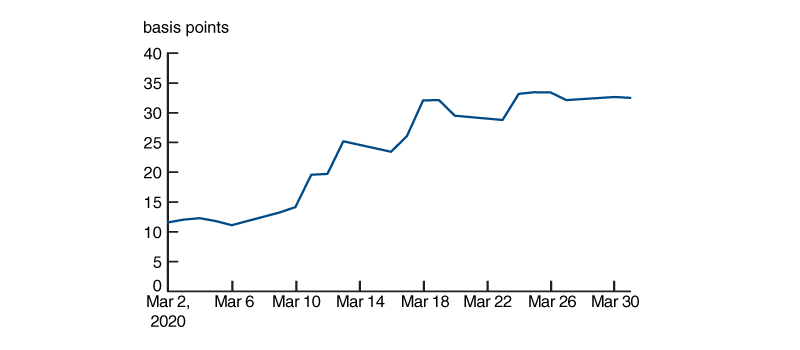
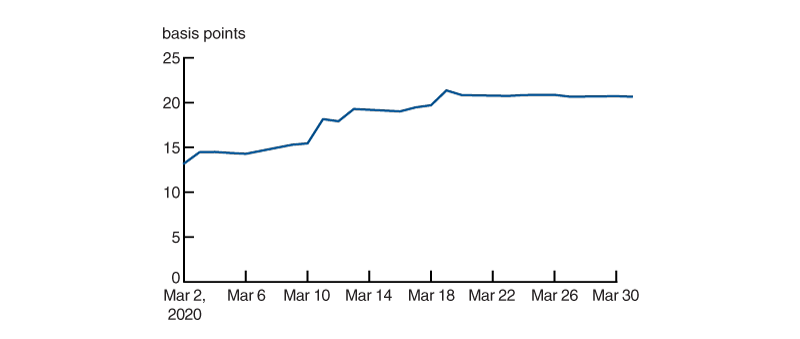
Risk managers and regulators often measure the sensitivity of interest rate risk in basis points, so we have also gauged the level of IM and changes thereof in basis points. Since, as we mentioned earlier, the Treasury future is deliverable into a basket of Treasury securities, we used the dollar value of 1 basis point (DV01), which is a common measurement of price sensitivity. The value is derived by moving the underlying interest rate curve up and down 1 basis point, then averaging the absolute values. The DV01 of the cheapest-to-deliver securities was adjusted by the conversion factor to derive the basis point equivalent (i.e., 1/100 of 1% or .01%) of the IM. These measurements approximate by how much the underlying CTD would have to move (in basis points) for the futures IM to be exceeded, holding the basis between futures and CTD securities constant. In figures 6 and 7, we can see that IM increased by a little over 20 basis points for the 30-year Ultra Bond future, while the ten-year Treasury note future increased by only 5 basis points.
6. Initial margin in basis points for the 30-year Ultra Bond future
7. Initial margin in basis points for the ten-year Treasury future
Conclusion
The Treasury futures market continues to be an important means of hedging and risk-taking. In reviewing the events from 2020, we observed notable increases in initial margin as market volatility increased.
When measuring these changes as a percentage of base notional value, we find that IM increased by over 200% for longer-duration Treasury futures contracts. While notional value is a useful means of comparing across different products, the measurement ignores the increase in the market value of the financial instrument whereas the increase is only around 150% for the same longer-duration Treasury future. Moreover, when gauging IM increases in basis points of the underlying CTD security, the increase is not as large. Still, we find that despite the extreme market shocks, collateral requirements rose, and a substantial fraction of the collateral increases were due to the rising market value of Treasury securities as the interest rates decreased. These findings imply the increases in collateral requirements were generally warranted in the U.S. Treasury futures market and should not be viewed as a major driver of destabilization in the financial markets.
Note: The authors would like to thank Nahiomy Alvarez, Michael Gordon, Michael O’Connell, Robert Steigerwald, and Sam Schulhofer-Wohl of the Federal Reserve Bank of Chicago; Seth Searls of the Federal Reserve Bank of New York; and Travis Nesmith of the Federal Reserve Board for their helpful comments.
Notes
1 Here, notional value outstanding was calculated by multiplying the number of contracts outstanding times the notional value of each contract for the two-year, three-year, five-year, ten-year, Ultra ten-year, 30-year, and Ultra 30-year futures, and then summing the products. The number of contracts outstanding came from CME’s June open interest report.
2 Treasury futures were originally launched in the 1970s by the Chicago Board of Trade, an exchange that merged with the Chicago Mercantile Exchange to form CME Group in 2007. CME Group recently launched cash-settled micro futures referencing U.S. Treasury yields. See https://www.cmegroup.com/trading/interest-rates/micro-treasury-yield-futures.html for additional details. Also, the Small Exchange has cash-settled derivatives referencing U.S. Treasury yields. See https://smallexchange.com/products for additional details.
3 See Timothy J. Lord, 1990, “Treasury bond and note futures,” in The Handbook of U.S. Treasury and Government Agency Securities: Instruments, Strategies and Analysis, Frank J. Fabozzi (ed.), Chicago: Probus Publishing Company, pp. 349–399, and Galen Burghardt and Terry Belton, 2005, The Treasury Bond Basis: An In-Depth Analysis for Hedgers, Speculators, and Arbitrageurs, 3rd ed., New York: McGraw Hill, chapter 1.
4 Open interest is the total amount of futures contract outstanding in the market at the end of the trading day. Open interest can be measured on a per underlying or more granular basis at each maturity for a given underlying basis.
5 These claims are based on volume and open interest data from the Chicago Board of Trade and accessed through Bloomberg L.P.
6 We focused on the ten-year and Ultra Bond since the contracts show the smallest and largest changes among the four maturities.


