

A steep increase in British sovereign yields and swap rates and an equally steep drop in the value of the British pound (GBP) in September 2022 put substantial liquidity pressures on United Kingdom pension funds. This repricing in risk assets was triggered by the UK chancellor’s mini-budget announcement on September 23, 2022, which led to reactions from market participants. The structure and investment strategies of pension funds made them particularly ill-prepared to deal with market turmoil.
Specifically, many of the funds, which are primarily defined benefit plans, employed a liability-driven investment (LDI) strategy. Their LDI strategies use leverage and pooling of assets along with other pension funds to match the duration of their long-term pension liabilities and investment holdings. Since outright holdings of long-term bonds are economically costly, this matching is typically accomplished by a combination of borrowing in short-term markets to buy longer-dated assets or by building up long-term positions through the use of derivative contracts. Both of these approaches require the pension funds to cover mark-to-market losses with their lenders or derivative market counterparties. Dramatically higher yields in September 2022 generated large mark-to-market losses for pension funds that, combined with higher volatility, triggered large margin calls.
Initially, pension funds met the liquidity demands of margin calls by selling assets—primarily gilts, of which they hold 28% of the market.1 These sales by the pension funds contributed to additional price declines and became a catalyst for even further selling of their gilts, according to the deputy governor of financial stability for the Bank of England. Only a direct intervention by the Bank of England that set up a temporary gilt purchase program on September 28 eventually stabilized prices.
In this Chicago Fed Letter, we discuss the structural factors that created a vulnerability for UK pension funds to large changes in gilt prices. We explain how leverage can play a role in amplifying changes in prices. We also discuss how pooling of assets by managers can lead to issues of operational coordination for the portfolio. We then discuss how these factors created a traditional “fire sale risk” dynamic for UK pension funds. Finally, we review U.S. pension plans and conclude they are generally less vulnerable to a similar run dynamic.
Defined benefit plans
In the UK, pensions have two defining characteristics: who sponsors them and what scheme they employ. There are three main types by sponsorship: the state pension, personal pensions, and workplace plans (or occupational pensions). The state pension comes from the government and is based on National Insurance records. Personal pensions are set up by individuals, typically when they are not eligible for a workplace pension. In this analysis, we are focusing on workplace pension plans because they were the ones most affected by the large changes in gilt prices.2
As of April 2021, workplace pension plans covered 79% of UK workers. The majority are defined benefit plans. This means the pension provides income at retirement based on the salary and tenure of the employee. From the perspective of the employee, this may be more desirable than a defined contribution plan because they have perceived certainty about the size and frequency of their income payments upon retirement. To achieve this certainty the employer, often through a fund manager, must make contributions that are invested to cover their liabilities at specific points in time in the future, i.e., future retirement benefits to retirees.
Some UK pension plans are defined contribution plans. In these plans, the income received by an individual at retirement is a result of their contributions and returns garnered by their investment choices. Unlike in the U.S., where defined contribution schemes (such as employer-sponsored 401(k) plans) are relatively popular, in the UK they are not as common.3
Pension funds invest their member contributions in a variety of assets skewed toward assets perceived as low risk, such as government bonds. As seen in figure 1, about 60% of the assets invested by pension funds are in fixed-income securities (bonds), with most of it being invested directly by the funds and another 10% in cash or cash-like instruments. Although such investments are generally considered less risky than stocks, they are much more sensitive to movements in interest rates.
1. Asset allocation of UK pension funds
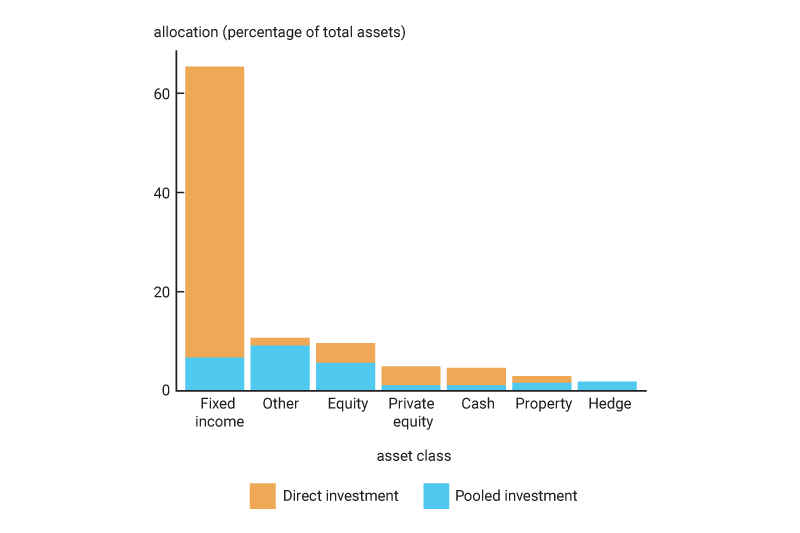
Source: Financial Survey of Pension Schemes.
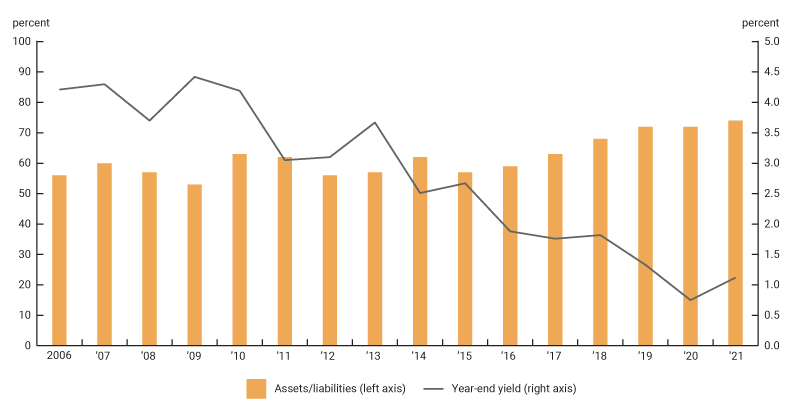
Furthermore, since the payments are not directly linked to contributions as in a defined contribution plan, defined benefit plans incur the risk of being underfunded.4 This means that a pension fund’s assets are smaller than its liabilities represented by the present value of future payments. Based on annual data from the UK Pension Protection Fund covering around 5,000 pension funds, we see a trend of liabilities exceeding assets. Without additional contributions, the return on pension fund assets needs to cover the gap of underfunding. This underfunding is depicted in figure 2 as the ratio of assets to liabilities versus gilt yields.
2. Asset to liability ratios of UK pension funds and 30-year gilt yield
What are liability-driven investments?
About 60% of defined benefit schemes in the UK use an LDI strategy. The strategy involves making allocation decisions and investments that match the duration of liabilities (i.e., the net present value of future pension obligations) of the pension plan. Typically, and especially because of the smaller size of the UK gilt market ($1.5 trillion) relative to that of the U.S. Treasury market ($9.9 trillion),5 the investments in portfolio include synthetic positions (i.e., derivatives), which can have specific funding as we discuss later.
In the low interest rate environment that we have experienced for most of the past decade, fund managers have been faced with liabilities that have a higher net present value (i.e., they are discounted using a historically low interest rate) and fixed-income assets that garner lower yields. Given the gap, which is illustrated in figure 2, pension funds have had to boost returns in order to grow assets since they could not reduce their benefit commitments.
How was leverage used by the pension funds?
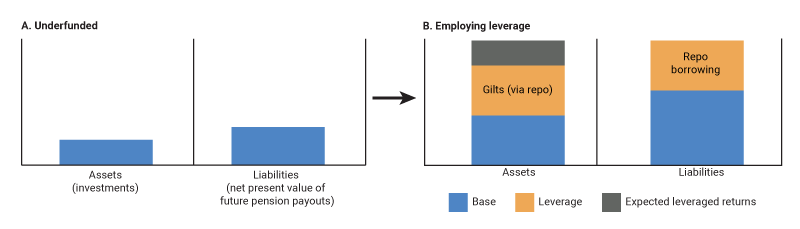
One option that fund managers have when they encounter an underfunded pension and a lower rate environment (i.e., where asset returns are low) is to seek higher returns by using leverage. Some pension funds relied on the repo market for leverage by pledging securities to borrow cash.6 The cash then can be further deployed to purchase more securities or to collateralize the trading of derivatives.
By using the repo market, the pension fund managers effectively expand their respective balance sheets via the leverage of buying additional securities financed by the repo market. In theory, the expansion could be infinite, but counterparties, particularly banks, want to minimize credit and market risks so they may use limits and haircuts. Most repos that have short maturities (i.e., one week or less) are subject to refinance (“rollover”) risk at maturity. For longer-dated repos, banks routinely take mark-to-market positions; in doing so, they require their counterparties, such as pension funds, to post cash margin to cover losses. In September 2022, these demands were large, albeit not as large as the demands for cleared derivatives.
3. Underfunded pension fund and fund employing leverage
As mentioned previously, derivatives are a common investment strategy to match the duration of the liabilities synthetically in a similar manner to gilt securities. In the UK, pension funds likely used derivatives because UK sovereign debt markets were relatively small; they also had the potential to garner higher returns with the embedded leverage. As of 2019, approximately 25% of pension liabilities were matched through derivatives;7 of that quarter, 82% were clearable derivatives, including interest rate swaps, inflation swaps, and forwards through a central counterparty (CCP).8 For interest rate swaps denominated in GBP, over 99% of the swap trades are cleared through the London Clearing House Ltd.9
CCPs are financial institutions that guarantee performance of a financial contract—typically the buying and selling of contracts related to securities or derivatives. CCPs have two types of funding requirements—variation margin (VM) in cash and initial margin in cash or highly liquid assets. The liquidity demand on firms at CCPs is heightened in periods of market volatility.
VM is the settlement of losses and gains based on the current change in the valuation of the cleared contracts, i.e., VM is a net flow that is passed through the CCP based on losses and gains on cleared contracts. To manage future risk exposures, CCPs require collateral to be posted to cover the potential loss should one or more clearing members default. The requirement is referred to as initial margin (IM) and is derived by forecasting future valuation changes of the contracts cleared to a high degree of certainty—99% or higher. The UK pension funds predominantly posted cash as collateral to their clearing members.
To illustrate the combined leverage exposure of repo and gross fair values of derivatives, figure 4 shows the values as shares of assets. In this comparison, we see that leverage consumed around one-third of the assets for the aggregate UK pension market.
4. Comparing repo and gross derivative exposures to assets
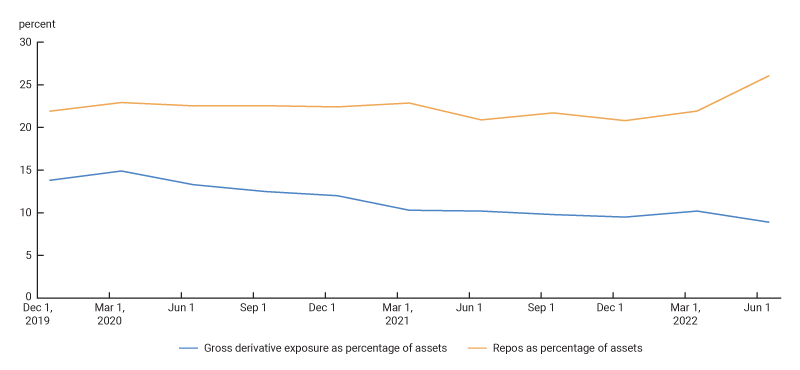
Source: Authors’ calculations based on data from the Financial Survey of Pension Schemes.
How was the pooling of assets a factor?
A final factor in the vulnerability relates to how the LDI strategies are implemented in the UK. According to The Pensions Regulator’s (TPR) 2022 annual report on defined benefit and hybrid schemes, defined benefit schemes in the UK with fewer than 1,000 members made up approximately 80% of the total number of schemes but just around 10% of total assets. These smaller firms face the same underfunding and low interest rate environment, but they are unable to implement the strategies by themselves due to limited resources or risk-management expertise. This leads to firms pooling their assets to fulfill the strategy. As of 2022, roughly 10% to 15% of LDI assets were commingled in these levered pools.10
When the asset manager is faced with the decision to unwind a position—especially a levered one—agreement is needed by all the fund participants. In moments of stress, when asset managers are faced with margin calls, there are logistical and operational complexities to securing participants’ agreement to a change. In that time, further mark-to-market losses can occur that will need to be covered. Because some of these pools are limited liability, which means the participants are not responsible for further losses, managers are forced to sell quickly given the large changes instead of providing participants with one or two weeks to contribute to their positions.
A framework for run dynamics
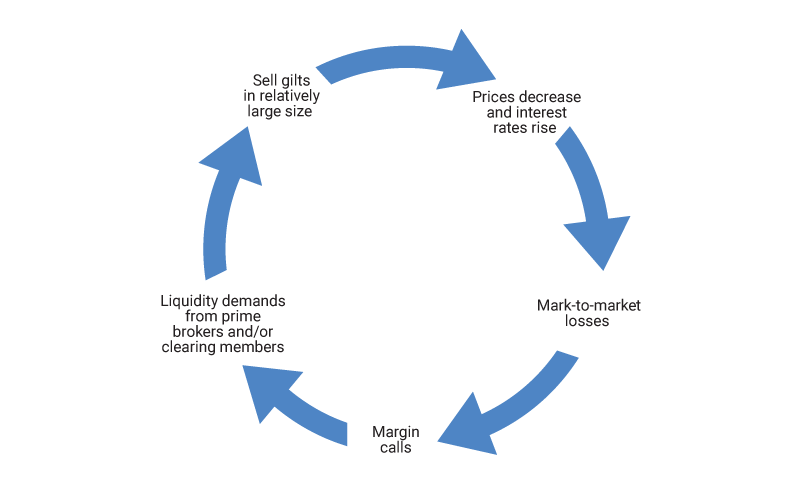
As a result of the aforementioned factors, UK pension funds were vulnerable to a self-reinforcing run dynamic spiral. That is, because of a price decrease and interest rate increase following the mini-budget announcement, the pension funds’ portfolios experienced mark-to-market losses. These losses, amplified by leverage, resulted in large, unanticipated margin calls. The funds’ prime brokers (for repos) and clearing members (for cleared derivatives) then made liquidity demands on the pension funds to cover these calls. To meet the liquidity demands, the pension funds sold large amounts of gilts as depicted in figure 5. This led to further price decreases (and rate increases) and back to the beginning of the cycle.
5. The run dynamic in UK pension funds
Mini-budget episode
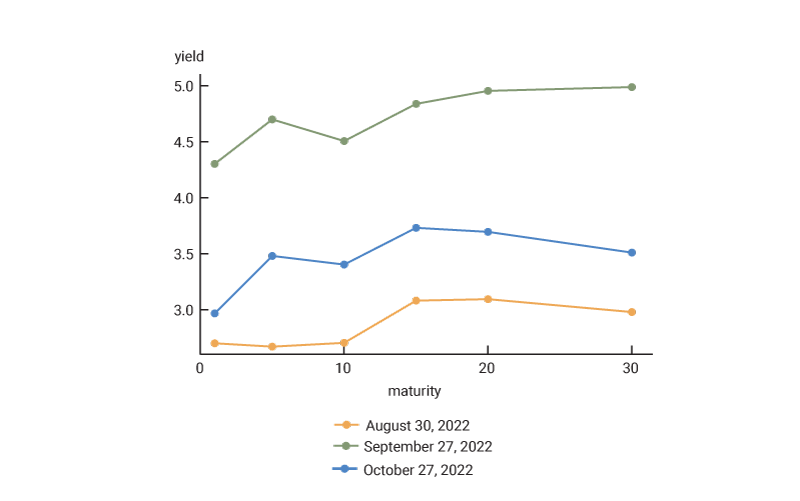
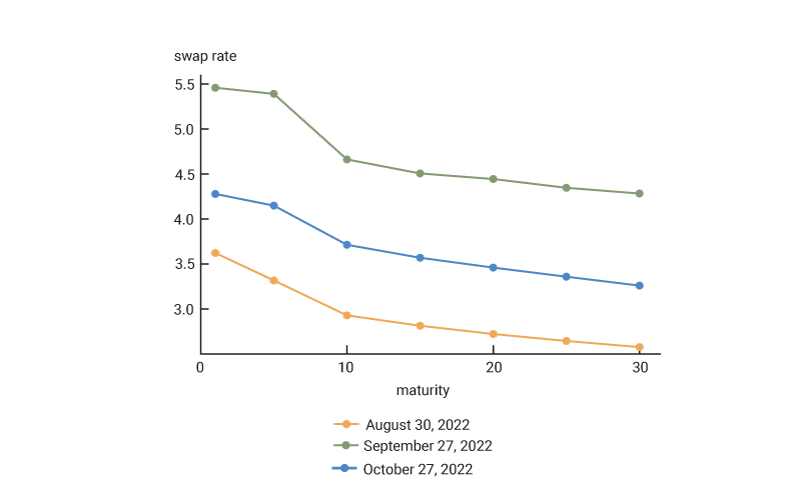
On September 23, 2022, the UK chancellor announced the government’s new growth plan. As a result of the proposal, gilt yields increased sharply along with the price of GBP swaps—which are valued based on the rate firms must pay to receive a fixed interest rate and pay the floating rate over a period and where the period is typically measured over multiple years. The floating rate will reset periodically based on the prevailing rates—typically the reset is every three, six, or 12 months. Both the gilt securities and GBP swaps are revalued at least daily by prime brokers for repos and CCPs for derivatives. The rates rose to their highest on September 27, which for the 30-year nominal gilts was a 200 basis points increase from the end of August as seen in figure 6.
6. Change in gilt yields and GBP swap rates
In response to these sharp moves, pension funds in the UK experienced mark-to-market losses. For their GBP swap positions, an increase in the market swap rate meant an increase in the floating leg of the swap, for which the pension funds were paying the floating rate and receiving the fixed rate. In other words, the funds had to pay a larger floating rate than the fixed rate at which they had entered the swaps. For cleared positions, these losses meant that pensions were required to post VM in cash at the CCP via their clearing members. As previously mentioned, pension funds also borrowed cash in the repo market to purchase gilts. Because gilt prices decreased, funds faced margin calls from their repo lenders. Given that the shock to the swap rates was relatively high, the margin calls for mark-to-market payments would have been higher for derivatives as mentioned previously.
On September 28, 2022, the Bank of England announced a temporary gilt purchase program. In total, the Bank of England made 19.3 billion GBP in gilt purchases. With the announcement of the program, which was intended to stabilize the market, gilt yields decreased sharply. On October 14, the central bank ended its purchase program. By the end of the month, yields had retreated from their peak but remained above their levels from the end of August. Notably, the spread between yields and swap rates remained elevated, which is likely a proxy for the credit risk of private borrowing.
In total, the change in gilt yields during this period was immense. We reviewed the daily change in the 30-year gilt yield, along with the 99.9% and 0.01% tails of the distribution.11 Compared to previous periods of stress, including the dot-com bubble, the global financial crisis (GFC) of 2007–08, and the start of the Covid-19 pandemic, the daily changes in September and October were two- to-five times larger
While the large change in yields would provide an accounting benefit to the funds by decreasing the net present value of their liabilities, the benefit would not be realized until the end of the applicable accounting year (i.e., fiscal year-end in many cases). On the other hand, the associated losses on the assets (and associated cash outflows) were incurred immediately. Because yields retreated, funds would not eventually realize the benefit on liabilities; however, because the asset sale occurred for a loss, there was an impact on pension fund balance sheets, leaving the funds worse off, with lower funding ratios.
Are U.S. pension funds as vulnerable as the UK funds were?
According to analysis by NISA, U.S. pension funds are less vulnerable than UK pension funds based on four key differences. U.S. pension funds have:
- Lower use of pooled and levered investments, so they have more time to meet funding calls and mitigate the concern of forced sales;
- Lower use of cleared derivatives, which reduces the run risk from the embedded leverage in derivatives as well as the potential liquidity demands from margin calls;
- Lower duration of liabilities, at approximately 12 years versus 15–20 years for UK pension funds, which implies the mark-to-market loss impact is lower for rises in interest rates; and,
- Larger relative capital markets size relative to pension fund size, so U.S. pension funds that use LDI strategies should be able to exit positions more easily, as well as have more investment options.
It is also worth noting that defined benefit programs are less prevalent in the U.S., particularly for the private sector; moreover, LDI strategies are less prevalent among them in the U.S.
To illustrate these features of U.S. pension funds, we reviewed the top ten defined benefit pension plans by asset size in the U.S., as determined for 2022 by Pensions & Investments (P&I). According to our calculations, these funds represent around 27% of the total defined benefit assets based on U.S. funds tracked by Pensions & Investments. Their key funding metrics are summarized in figure 7.
7. Select statistics of the top ten U.S. defined benefit plans by asset size
| Rank | Fund | 2022 assets (millions of dollars) | Funded percentage (actuarial) | Gross derivatives fair value percentage of assets |
Repo and securities borrowing percentage of assets |
| 1 | California Public Employees | 453,261 | 72 | 0.2 | 3.2 |
| 2 | California State Teachers | 331,673 | Not available | 0.5 | 7.6 |
| 3 | New York State Common | 294,623 | 103 | 0.0 | 7.6 |
| 4 | New York City Employees | 125,009 | 78 | 0.0 | 0.0 |
| 5 | Florida State Board of Administration | 185,443 | 83 | 0.0 | 0.5 |
| 6 | Teacher Retirement System of Texas | 207,622 | 79 | 0.1 | 0.0 |
| 7 | New York State Teachers | 133,145 | 99 | 0.0 | 0.5 |
| 8 | State of Wisconsin Investment Board | 176,091 | Fully | 1.7 | 9.7 |
| 9 | Washington State Investment Board | 149,187 | Not available | 0.1 | 0.2 |
| 10 | North Carolina Retirement Systems | 139,696 | Not available | Not available | 0.6 |
In particular, these funds exhibit low leverage, as their repo and securities borrowing are lower in comparison to the UK funds summarized in figure 4. Their use of derivatives is lower as well. Another key difference for the top ten U.S. funds is that they are better funded than their UK counterparts depicted in figure 2, although it should be noted that some of the smaller state and local defined benefit plans in the U.S. have dramatically lower funding ratios than their larger counterparts. Moreover, when reviewing the aggregate U.S. pension fund holdings of U.S. Treasury securities (not shown), we find that they represent a relatively smaller market share at 2.2% as of 2022.12 Together with the broader analysis from NISA, our analysis implies that U.S. pension funds are less vulnerable to amplifying the shock from large changes in interest rates than their UK counterparts.
Conclusion
The steep decline in gilt prices (and the accompanying rise in yields and swap rates) that followed the UK chancellor’s mini-budget announcement on September 23, 2022, was amplified by structural vulnerabilities of UK defined benefit pension funds to large changes in interest rates. The increase in market volatility led to large margin calls on pension funds’ mark-to-market losses on their synthetic positions. These liquidity demands were met by the pension funds selling their assets, concentrated in gilts. The large-scale selling in a relatively small market led to a run dynamic as prices spiraled downward. The price dynamics were mollified by the Bank of England’s emergency intervention. In our review of the structure of the ten largest U.S. defined benefit pension plans, we find that there is less reliance on leverage and derivatives exposures relative to the UK defined pension fund landscape. Moreover, the depth of the U.S. Treasury market translates into defined benefit plans holding only 2.2% of domestic sovereign securities as of 2022.13 While this implies that U.S. pension funds may be less vulnerable to a similar shock, underfunded pension funds may tend to invest in relatively risky assets in their reach for yield.14 Moreover, there may be other pockets of vulnerabilities in the broader U.S. economy, particularly related to leverage and/or liquidity, which are highlighted in the Financial Stability Report, including the recent liquidity stress at some midsize U.S. banks.15
The authors would like to thank Gene Amromin, Kelsey Burr, Alessandro Cocco, Michael O’Connell, and Rich Rosen of the Federal Reserve Bank of Chicago, as well as Irina Stefanescu of the Board of Governors of the Federal Reserve System, for their helpful comments. The authors also thank industry experts at the Illinois Municipal Retirement Fund (IMRF), State of Wisconsin Investment Board, California Public Employees’ Retirement System (CalPERS), London Clearing House (LCH) Ltd., and Teacher Retirement System of Texas for their helpful discussions and comments.
Notes
1 Gilts are the sovereign debt securities of the United Kingdom, akin to U.S. Treasury bonds. Pension funds held 28% of the gilt market as 2022:Q1, but their holdings were concentrated at the long end of the curve, where most of the price action occurred, according to analysis from Bloomberg.
2 Employers from the private sector in the UK can sponsor either defined benefit or defined contribution plans, while public sector employers generally sponsor defined benefit plans. For more on the specifics of these plans in the UK, see the results from the Financial Survey of Pension Schemes (FSPS) from 2022:Q2.
3 For a discussion of the differences between the types of pension plans, see the Guardian’s 2011 analysis of public sector pensions.
4 Section 222 of the Pensions Act of 2004 requires that defined benefit schemes have “sufficient and appropriate assets to cover its technical provisions,” which is “the amount required, on an actuarial calculation, to make provision for the scheme’s liabilities.” A scheme that falls below this statutory funding objective (SFO) will need to work with the employer to create a recovery plan and submit it to The Pensions Regulator (TPR) in the UK; for more details, see the TPR’s recovery plans webpage.
5 See figure 4 from the October 2022 NISA analysis of structural differences between UK and U.S. LDI markets.
6 A repurchase agreement (repo) is a short-term secured loan: One party sells securities to another and agrees to repurchase those securities later at a higher price. The securities serve as collateral, and the repurchase price is the interest paid on the loan, known as the repo rate. For more on repos, see this 2017 report from the Bank for International Settlements, Committee on the Global Financial System, Study Group.
7 See section 3 from the October 2022 NISA analysis of structural differences between UK and U.S. LDI markets.
8 Authors’ calculations based on data from table 4.2.3.1 in the OMB Research report summarizing a survey carried out for the TPR in 2019:Q4. According to that survey report, 18% of defined benefit pension schemes cleared their derivatives.
9 Authors’ calculations based on the swaps volume data from Clarus Financial Technology’s CCPView.
10 Further details on the pooled investment vehicle holdings of UK private sector defined benefit schemes are available in section 3 of this Office for National Statistics’ statistical bulletin analyzing the results from the 2022:Q2 Financial Survey of Pension Schemes.
11 These were computed from January 2000 to August 2022 to avoid the volatile periods in September and October 2022 impacting the results.
12 Board of Governors of the Federal Reserve System, Financial Accounts of the United States (Z.1) statistical release, available online.
13 Board of Governors of the Federal Reserve System, Financial Accounts of the United States (Z.1) statistical release, available online.
14 See Maximilian Konradt’s February 2023 working paper, which was presented at the Workshop on Non-Bank Financial Institutions hosted by the Federal Reserve Bank of Chicago on April 21, 2023; this workshop’s agenda is available online.
15 The Financial Stability Report is produced twice per year by the Board of Governors of the Federal Reserve System, with research support from the regional Reserve Banks.


