

Over 1 million households live in public housing developments in the United States. Research on the effects of public housing—on both its residents and residents in the surrounding neighborhood—is decidedly mixed when it comes to various outcomes, such as educational attainment, labor market success, rates of crime, and economic opportunity.1 Using multiple data sources, we describe two important, but understudied, aspects of those living in neighborhoods with public housing: these residents’ financial health and the demographic and income characteristics of the neighborhoods they visit as reflected by their day-to-day movements outside their home areas.
First, we characterize the financial health of residents in areas with public housing developments by using credit bureau data containing various measures of access to credit and difficulties in repaying debt. Access to credit can be a lever of economic opportunity, allowing people to invest in developing human capital, starting new businesses, or simply serving as a cushion against severe financial shocks. Credit access and delinquency measures also provide useful indicators of individuals’ economic well-being.
Second, we study the nature of the day-to-day interactions of residents from areas with public housing developments by examining the characteristics of the neighborhoods they visit. Specifically, we examine the racial composition, educational attainment, and income level of neighborhoods that residents of areas with public housing visit throughout their day. Providing new descriptive facts about the neighborhoods visited by people from communities with public housing may help further deepen our understanding of the issues concerning public housing in the United States.
We find that measures of access to credit and difficulties in repaying debt are clearly worse in neighborhoods with public housing than in other comparable neighborhoods with low incomes. When we examine the characteristics of neighborhoods that are visited by residents of areas with public housing, we find that they visit neighborhoods that have a higher share of White individuals and a lower share of Black individuals living there than the neighborhoods visited by residents of comparable low-income areas without public housing.
Data and methods
We use data from four sources: 1) location data for public housing buildings from the U.S. Department of Housing and Urban Development (HUD), 2) credit bureau data from the Federal Reserve Bank of New York Consumer Credit Panel/Equifax (CCP) database, 3) cellphone location tracking data from Advan Research Corporation, LLC (previously collected by SafeGraph), and 4) demographic and economic characteristics from the 2010 U.S. Census accessed via the National Historical Geographic Information System (NHGIS).
From HUD, we access geospatial data on the locations of all public housing buildings in the 50 U.S. states as of October 2021. We use the latitude and longitude of these building locations to determine their 2010 Census block and block group, resulting in a final sample of 193,174 public housing buildings. The census block is the smallest area of geography and has up to a few hundred residents, while a typical census block group has anywhere from 600 to 3,000 residents. These locations are matched to 2010 Census tabulations of demographic and economic characteristics of blocks and block groups. We then separately merge these data at the block level to CCP data and at the block-group level to Advan data.
To study financial outcomes, we use 2018–19 data from the CCP, a 5% random sample of the U.S. population with credit histories. These data contain the 2010 Census block of the individual, which we use to create for each block our estimates of the fraction of people who have a subprime Equifax credit score (less than 620), any loan delinquency, any debt in third-party collections, an auto loan, and a mortgage.
For our analysis of visiting patterns, we utilize Advan data from the entire year of 2018. Based on the locations of cellphones, Advan data identify the census block groups where individuals reside in as well as where they visit. To protect individuals’ privacy, Advan aggregates the data on visits. An observation in the aggregated data records the total number of visits to a census block group from a specified census block group of residence for a given month. Our outcome measures are as follows: the share of the destination block group’s population that is White, the share that is Black, and the share with a bachelor’s degree or more, as well as the average income level of the destination block group. We limit the data to visits made outside of one’s home census block group to better target visits outside of one’s neighborhood.
In order to compare neighborhoods that have public housing buildings with similar neighborhoods, we focus on a set of comparison blocks (for our credit outcome analysis) or block groups (for our visiting patterns analysis) in which more than 30% of the population live under 200% of the federal poverty line in 2010. This provides us with a set of neighborhoods that are very similar on observable characteristics to our samples of neighborhoods with public housing. The final sample for our CCP analysis comprises 1,704,090 census blocks, and the final sample for our Advan analysis comprises 112,442 census block groups.
Our methodology is to run ordinary least square regressions where our measure of interest is the percentage point difference between areas with and without public housing developments for each of our outcomes.2 We also include several variables that we think are important controls to use in our analysis to further adjust for any differences between neighborhoods with public housing units and comparable neighborhoods without them. These include the racial composition, educational attainment, income, and poverty level of the block or block group. We rescale our measure relative to the mean level of the outcome in the overall sample, which yields the percent difference between areas with and without public housing. This allows us to compare the size of the associations across outcomes in a standardized way. These estimates show the extent to which areas with public housing are different from comparable areas without public housing.
Results
In figure 1, we plot the estimates for our financial outcomes. Our first measure is the fraction of people who have a subprime credit score, specifically, an Equifax credit score less than 620. In our entire sample, which combines blocks with public housing and comparable low-income blocks without public housing, about 31% of individuals have a subprime score. We find that blocks with public housing have a 5.7 percentage point higher share of residents with a subprime score than comparable blocks without public housing—which is an 18% difference relative to the overall mean. This is the value shown in the first bar in figure 1. This suggests that credit access is significantly lower in neighborhoods with public housing. We find that this lower credit access is also reflected in the fewer assets owned by individuals in areas with public housing, as these residents are 12% less likely to have an auto loan and 18% less likely to have a home mortgage than residents in comparable areas without public housing. Lower credit usage in blocks with public housing may be due to lower access to credit, but this also could be due to lower demand for credit.
1. Credit outcomes for areas with public housing versus other comparable areas
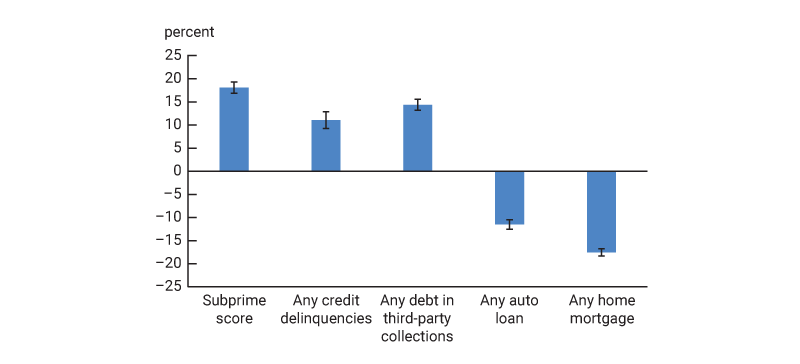
Sources: Authors’ calculations based on data from the U.S. Department of Housing and Urban Development; Federal Reserve Bank of New York Consumer Credit Panel/Equifax (CCP); and the U.S. Census Bureau, 2010 U.S. Census, from the National Historical Geographic Information System.
Turning to our measures of credit delinquency, we find that the probability of having any delinquencies is 11% higher in blocks with public housing than in the comparison blocks without public housing. We also find that the likelihood of having any debt that has been referred to a third-party collection agency is 14% higher. Thus, we find clear evidence of worse financial health of residents in neighborhoods with public housing.
In figure 2, we show the results that pertain to the characteristics of the neighborhoods (block groups) that residents of areas with public housing visit during their daily lives. First, we find meaningful differences in the racial composition of the neighborhoods visited by individuals who live in areas with public housing compared with the neighborhoods visited by individuals in our comparison group. People living in areas with public housing visit neighborhoods that have a 3% higher share of residents who are White and have a 9% lower share of residents who are Black compared with the neighborhoods that are visited by people living in comparable areas without public housing. One possible explanation for this finding is that areas with public housing may be located closer to gentrified neighborhoods or central business districts—both of which may have a higher share of White residents. Another possible explanation is that those living in areas with public housing may have greater access to public transportation.
2. Characteristics of neighborhoods visited by residents of areas with public housing versus neighborhoods visited by residents of other comparable areas
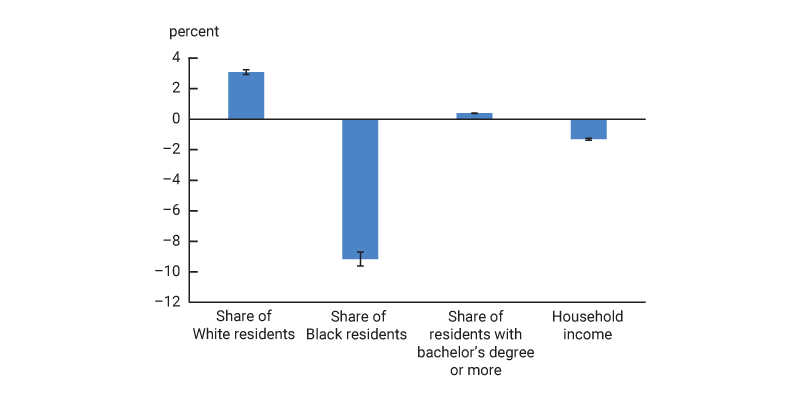
Sources: Authors’ calculations based on data from the U.S. Department of Housing and Urban Development; Advan Research Corporation, LLC; and the U.S. Census Bureau, 2010 U.S. Census, from the National Historical Geographic Information System.
We also find that people living in census block groups with public housing visit neighborhoods with an almost identical share of residents with at least a bachelor’s degree as the neighborhoods visited by people living in similar census block groups without public housing. Finally, we find that people who live in areas with public housing visit neighborhoods with 1% lower household incomes on average than the neighborhoods visited by people who live in comparable areas without public housing. Overall, these results suggest that compared with residents of other census block groups with low incomes, residents of census block groups with public housing may have somewhat more interactions with White individuals and fewer interactions with Black individuals.
Summary
We compare the financial health and visiting patterns of residents of neighborhoods with and without public housing. In general, we find evidence of worse financial health among residents of neighborhoods with public housing, as indicated not only by these areas’ greater shares of individuals with subprime credit scores, loan delinquencies, and bills referred to third-party collection agencies, but also by their lower rates of auto loans and home mortgages. These results suggest that areas with public housing may face persistent differences in financial health and economic opportunity relative to similar areas without public housing. Residents of neighborhoods with public housing move about cities in ways that may result in them having fewer interactions with Black individuals and more interactions with White individuals than residents of other neighborhoods with low incomes. This may be due to the fact that some neighborhoods near those with public housing developments have experienced gentrification; the relative proximity of neighborhoods with public housing to central business districts and public transportation could also be contributing factors. We are limited to just describing these differences given the nature of our data; thus, we do not consider these results as reflecting the causal effects of public housing. Instead, the differences we record may also reflect the composition of individuals who choose to live in public housing units or the lack of access to credit and financial resources that happens to exist in areas with public housing for other reasons—and the policy implications differ for these two possible drivers of the differences we’ve documented. There is much room for future work to examine the mechanisms that drive the differences in access to financial resources and credit in economically similar areas with and without public housing.
Notes
1 The literature on public housing encompasses studies on residents of public housing as well as those living in neighborhoods containing public housing units. For example, see Edgar O. Olsen and Jeffrey E. Zabel, 2015, “Chapter 14 - US housing policy,” in Handbook of Regional and Urban Economics, Vol. 5, Gilles Duranton, J. Vernon Henderson, and William C. Strange (eds.), Amsterdam: Elsevier / North-Holland, pp. 887–986, Crossref; Eric Chyn, 2018, “Moved to opportunity: The long-run effects of public housing demolition on children,” American Economic Review, Vol. 108, No. 10, October, pp. 3028–3056, Crossref; Dionissi Aliprantis and Daniel Hartley, 2015, “Blowing it up and knocking it down: The local and city-wide effects of demolishing high concentration public housing on crime,” Journal of Urban Economics, Vol. 88, July, pp. 67–81, Crossref; and Henry O. Pollakowski, Daniel H. Weinberg, Fredrik Andersson, John C. Haltiwanger, Giordano Palloni, and Mark J. Kutzbach, 2022, “Childhood housing and adult outcomes: A between-siblings analysis of housing vouchers and public housing,” American Economic Journal: Economic Policy, Vol. 14, No. 3, August, pp. 235–272, Crossref.
2 A regression model is a statistical method that estimates the strength of relationships between variables. A regression coefficient represents the expected change in the dependent variable for a one-unit change in the independent variable (while holding constant any other independent variables). In our case, the key independent variable is an indicator variable that takes on the value 1 if an area has a public housing unit and the value 0 otherwise.


