

In this second part of our Chicago Fed Letter series on life insurers’ investments in private placements, we use novel data to assess the growing complexity and liquidity of these investments.1 We start by documenting that these investments have shifted toward issuers in financial and real estate sectors. We then show that this shift reflects more lending to asset managers, including private direct lending funds. One reason for this shift to financial issuers is that these private placements tend to be more complex and less liquid, resulting in higher yields. Lastly, we show that, while private placements can be sold in the secondary market, liquidity in this secondary market is significantly lower than in the secondary market for publicly traded corporate bonds. The growing investment in this less liquid asset class therefore increases the risk of fire sales during times of crisis. This article sheds light on the changing nature of this growing asset class on life insurers’ balance sheets and outlines some potential ramifications for financial stability.
In the first part of this two-part Chicago Fed Letter series, we showed that life insurers have significantly increased their private placement investment in recent years, reaching 12% of their general account assets in 2022. We argue that this growth can be partially explained by the broader growth in what market participants refer to as “esoteric credit.”2 This is an asset class that combines structural aspects of private corporate and asset-backed securities (ABS), often through a special purpose vehicle or with receivables-based financing. A 2022 insurance roundtable report described it as follows: “It is not just pure corporate. It is not a multi-tranche ABS; it combines the structural aspects of both ABS and corporate credit.” These securities can be difficult to source and originate, as investor demand for this novel asset class is still developing, so they offer 1) a complexity premium and 2) an illiquidity premium to traditional private credit. The complexity premium is the additional spread needed to compensate investors for nonstandard deal structures or borrowing terms (e.g., unconventional collateral in ABS). The illiquidity premium relates to the difficulty in quickly selling the asset without incurring a discount, especially during periods of distress. Empirically, it is difficult to disentangle the two premiums as more complex assets tend to have a smaller investor base, which in turn reduces their liquidity in the secondary market. That said, the fact that private placement debt is priced up to 40 basis points above comparable publicly traded corporate bonds suggests that the premiums are sizable. Next, we provide evidence that life insurers have invested more in these higher yielding, but more complex, private placements and that these investments are significantly less liquid than public corporate bonds.
Figure 1 shows the industry composition of private placements issued by public and private issuers for which industry information is available, excluding foreign-issuer private placements. The figure indicates that the growth in private placement investment was accompanied by a sizable private placement portfolio reallocation between 2016 and 2022. Specifically, we observe a 10 percentage point increase across financial, real estate, and ABS private placements. A significant share of these investments are part of the esoteric credit asset class. Simultaneously, we find an equivalent decline across nonfinancial and infrastructure private placements. This reallocation is the first piece of suggestive evidence that private placements in life insurers’ portfolios have become more complex, on average.
1. Private placement industry composition: Public and private issuers
| Public issuers (%) | Private issuers (%) | Total | |||||||
|---|---|---|---|---|---|---|---|---|---|
| 2016 | 2022 | 2016 | 2022 | 2016 | 2022 | 2022–16 | |||
| Financial | 9.5 | 9.7 | 15.8 | 21.7 | 13.5 | 18.1 | 4.5 | ||
| Real estate | 2.2 | 5.4 | 5.0 | 8.9 | 4.0 | 7.9 | 3.9 | ||
| ABS | 8.6 | 12.7 | 30.3 | 28.8 | 22.5 | 24.0 | 1.5 | ||
| Nonfinancial | 44.4 | 35.1 | 31.6 | 26.8 | 36.2 | 29.3 | –7.0 | ||
| Utility and infrastructure | 35.4 | 37.0 | 17.2 | 13.8 | 23.7 | 20.8 | –3.0 | ||
Sources: NAIC statutory filings via S&P Global Market Intelligence, S&P Capital IQ Pro database, and authors’ calculations.
Within this shift toward financial issuers, the reallocation toward private financial issuers gaining six percentage points stands out. The growing issuers include a range of companies: Madison Capital Funding, a New York Life subsidiary focused on direct lending to private equity-backed middle-market companies; unaffiliated private asset funds, such as Cliffwater Corporate Lending, Vanguard Group, Bain Capital, and Warburg Pincus; Cayman Island-domiciled special purpose vehicles; Thrivent Education Funding, a private financial service and asset management company; Hardwood Funding LLC, the National Basketball Association’s league-wide credit facility that issues debt backed by NBA media revenue; and Clarion Lion Properties Fund, an investment manager in the real estate sector (see figure 2). These issuers tend to issue highly complex, structured products that life insurers invest in.
2. Growing private placement holdings of financial company issuers (2016 to 2022)
| Dollars in billions | % of total financial company holdings | |||
| 2016 | 2022 | 2022 | ||
| Madison Capital Funding LLC | 0.0 | 5.8 | 3.8 | |
| Cliffwater Corporate Lending Fund | 0.0 | 2.3 | 1.5 | |
| Vanguard Group Inc | 0.6 | 2.5 | 1.6 | |
| Bain Capital LP | 0.0 | 1.9 | 1.2 | |
| Cayman Universe Holdings LLC | 0.0 | 1.8 | 1.1 | |
| SVF II Finco Cayman LP | 0.0 | 1.7 | 1.1 | |
| Thrivent Education Funding LLC | 0.0 | 1.7 | 1.1 | |
| Warburg Pincus LLC | 0.0 | 1.3 | 0.8 | |
| Hardwood Funding, LLC | 1.8 | 3.1 | 2.0 | |
| Clarion Lion Properties Fund Holdings LP | 0.8 | 1.9 | 1.2 | |
| Total financial company holdings | 62.7 | 154.3 | ||
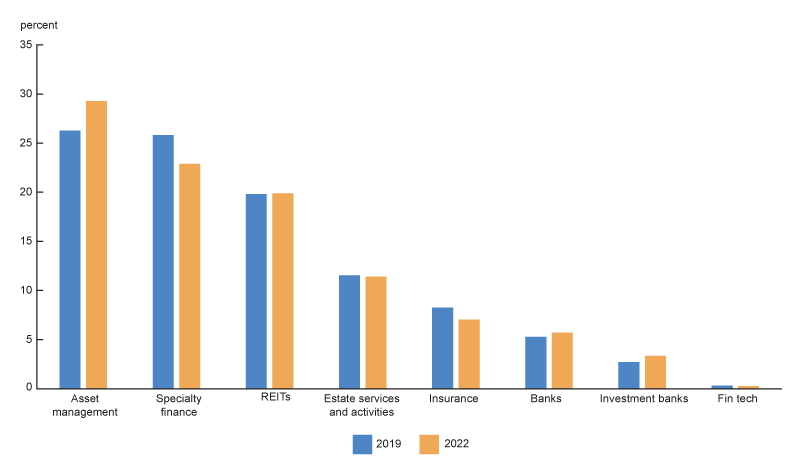
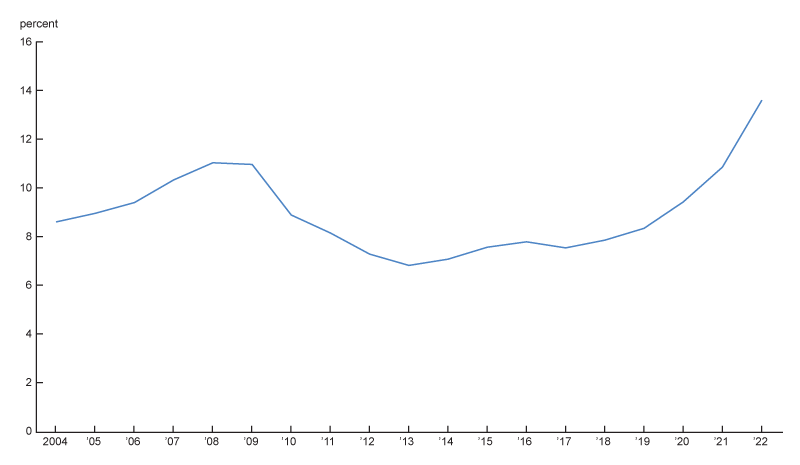
Within the financial sector, life insurers’ investments are concentrated in asset managers, specialty finance, lenders that operate outside of the traditional banking sector and often serve nontraditional business and industries, and real estate entities, including REITs. Since 2020, investments with asset managers have become a relatively larger part of life insurers’ portfolio, while specialty finance has declined slightly (see figure 3). Insurers have also increased allocations toward floating-rate private placements to levels above that of their pre-financial crisis highs (see figure 4). The increase in floating-rate bonds as a share of total private placements coincides with a shift in life insurers’ liability mix toward fixed, indexed annuities—products that offer policyholders a minimum rate guarantee, plus an additional return related to the performance of an asset index, such as the S&P 500 or a proprietary index created by the insurer. Floating-rate bonds can be used by insurers to better track the returns on the index and hence, are a better match for these liabilities. On the supply side, the increase in floating-rate private placements is consistent with the increase in investments in private placements issued by asset managers, including private credit funds.
3. Financial sector private placements by industry, 2019–22
4. Share of total private placement bonds with floating interest rates
Liquidity in the private placement market
Bond liquidity exists on a continuum and is a function of the ability to sell the asset quickly and to do so without impacting the asset’s price. The illiquidity premium compensates investors for potential discounts if the need for an immediate sale arises. Private placements generally have a smaller investor base than public bonds and hence, tend to be less liquid. However, industry professionals are quick to point out that liquidity does exist in the private placement market. While the public bond market is generally more liquid, an industry roundtable report noted that: “Some off-the-run public bonds [are] less liquid than well-known, high quality private placement issues.” While liquidity is a notoriously difficult concept to measure, to better gauge the (il)liquidity of the private placement market, we look at how insurers’ sales of private placements and public bonds differ.
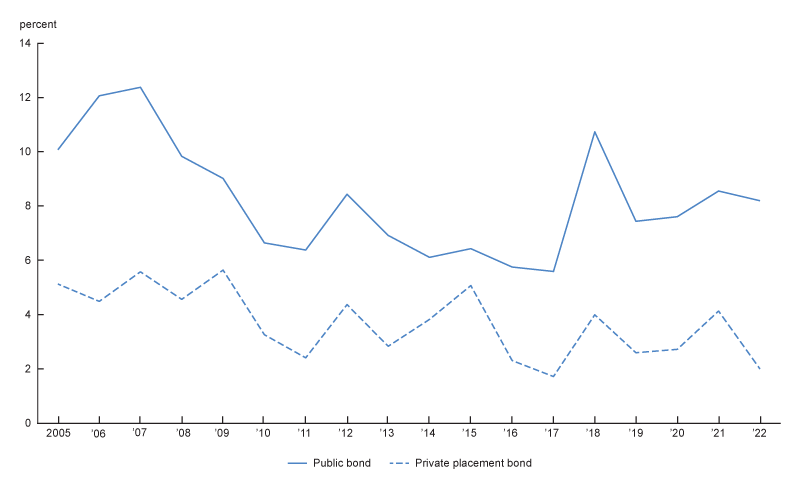
Life insurers’ sell private placements but do so less frequently than their public equivalents. Sales of life insurer private placement holdings have been less than half of that of their public equivalents (see figure 5). On average, life insurers sold 8.7% of their public bond holdings per year in 2005–22, compared to 4.1% for private placement bonds. As seen in figure 6, the lower sales rate for private placements holds across remaining maturity buckets. So, the lower sales rate appears driven by differences in liquidity rather than by insurers holding more short-duration private placements. Additionally, while private placements trade less often, they are also sold through different channels than public bonds.
5. Average sales rate 2005 to 2022, public versus private placement bonds
| Remaining maturity, in years | Average annual sales rate | Share of sales | ||||
| Public | Private | Public | Private | |||
| 1 to 5 | 11.5 | 5.6 | 26 | 37 | ||
| 5 to 10 | 9.1 | 3.6 | 40 | 41 | ||
| 10 to 15 | 4.3 | 1.7 | 6 | 8 | ||
| 15 to 20 | 6.6 | 2.9 | 6 | 4 | ||
| 20+ | 6.3 | 3.2 | 22 | 10 | ||
| Total | 8.7 | 4.1 | ||||
6. Sales rate, public versus private placement bonds
Sources: NAIC statutory filings via S&P Global Market Intelligence and authors’ calculations.
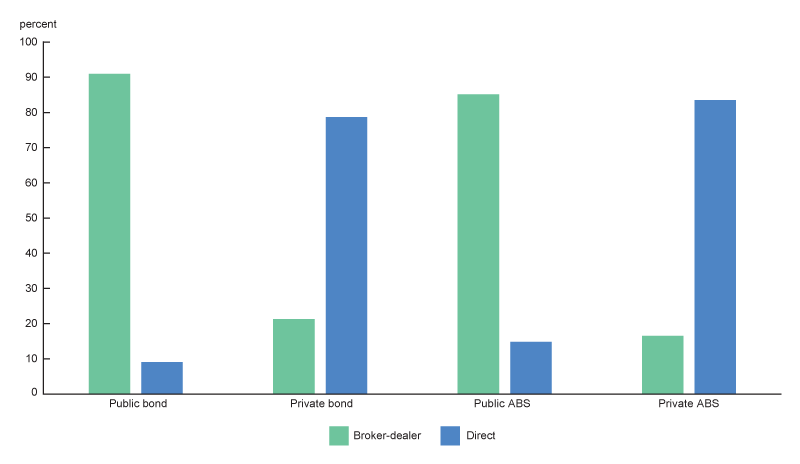
Public bonds are typically exchanged through bank broker-dealers, while the private placement market is far more specialized. Almost 90% of life insurers’ sales of public corporate bonds and ABS are done through a broker-dealer, and typically bank broker-dealers, such as Citibank or JP Morgan Chase (green bars in figure 7). In these transactions, broker-dealers act as liquidity providers by holding securities on their balance sheet or by finding buyers for the bond that the insurer wishes to sell. The prevalence of bank broker-dealers in these transactions reflects the strong secondary market for public corporate bonds, as bank broker-dealers are typically unwilling to purchase bonds that may need to be held on their books for a significant time due to capital costs.3 In contrast, 80% of life insurers’ sales of private placements are done as direct transactions (blue bars in figure 7).
7. Sales from broker-dealer or direct transactions by bond type
Sources: NAIC statutory filings via S&P Global Market Intelligence and authors’ calculations.
In sales of private placements, the life insurer must find another institutional investor—such as another life insurer, a pension fund, or even the originator of the deal—who wishes to purchase the bond and then arrange the terms of sale. We can say these transactions are “less liquid” than transacting with a bank broker-dealer, as more time must be spent to arrange the trade. And when private placements are sold through a broker-dealer, they are almost exclusively sold through a specialized nonbank broker-dealer such as StoneCastle Securities or the Seaport Group. These nonbank broker-dealers do not face the same capital requirements for holding securities, which may allow them to hold more illiquid bonds. The lack of bank broker-dealers involved in private placement transactions likely reflects a thinner secondary market for these securities. However, even in the midst of the financial crisis in 2008 and 2009, life insurers were able to successfully offload some private placement bonds, although at much lower rates than their public equivalents. As seen in figure 6, sales of private placements remained flat during the financial crisis and well below public bond sales. Taken together, while a secondary market for private placement exists, these assets may still have limited liquidity as trading relies on smaller broker-dealers or direct transactions with other life insurers or similar investors.
Conclusion
Life insurers have significantly increased their holdings of private placements and within private placements, have shifted investments toward more complex issuances. While private placements can be traded, they typically are less liquid than public bonds. Moreover, the investor base is limited for some private placements as the terms of deals are tailored to life insurers with their unique long-duration liabilities. These concerns are particularly salient for more complex private placements, which tend to have an even smaller investor base and as a result, tend to have even lower liquidity than other private placements. Hence, while a life insurer may be able to sell some private placements without large discounts when facing an idiosyncratic liquidity need, the liquidity of private placements, especially for more complex issuances, is likely to diminish during an economy-wide liquidity shock affecting all life insurers. From a systemic risk perspective, continued increases in private placement holdings, and especially in more complex securities, raises concerns about life insurers’ liquidity position in times of stress.
Notes
1 For a complete description of the data sources and data construction methods used in the two articles in this series, please see the online data appendix.
2 The growth of esoteric credit as an asset class has occurred as insurers have replaced banks in private credit markets and as more private equity-backed insurers with asset origination capabilities have entered the market.
3 The Volcker Rule, established as part of the Dodd–Frank Act, increased capital costs of bank broker-dealers and decreased their willingness to hold bonds on their balance sheet without pre-arranging an offsetting trade.


