After the global financial crisis of 2008–09, regulators across the globe enacted regulations to repair and strengthen financial markets. Part of the regulations were to mandate that more financial market contracts are cleared through central counterparties (CCPs). CCPs are financial institutions that guarantee performance of a financial contract—typically the buying and selling of contracts related to securities or derivatives. In the United States, the regulations for central clearing were established by the Dodd–Frank Act in 2010 and further promulgated by rules enacted by the Commodity Futures Trading Commission (CFTC) and the U.S. Securities and Exchange Commission (SEC).
While there may be some economies of scale by concentrating clearing activities, concentration generally implies limited options for market participants to access clearing. Moreover, when a financial market is concentrated in a small number of firms, a failure of one or more firms can create systemic risk and potential financial stability concerns. To get a better sense of the level of the potential concentration in the clearing ecosystem, in this Chicago Fed Letter I provide a multidimensional view of concentration for U.S. CCPs. I start by providing a general overview of the ecosystem. I then explain the landscape of the major CCPs in the U.S., the growth of clearing over the past decades, and how that growth has driven changes to the composition of the most important CCPs. Finally, I provide an overview of the major clearing participants in the U.S. and how changes to their market share have impacted clearing risk-management conditions.
I find that the ecosystem is indeed concentrated—and more concentrated than in 2007, i.e., prior to the global financial crisis of 2008–09. I also find evidence that concentration is elevated across multiple dimensions and that the broader ecosystem is concentrated around a subset of global systemically important banks (GSIBs) as collateral requirements have increased and with the exodus of other financial firms supporting the ecosystem.
What is the clearing ecosystem?
In order to mitigate the credit risk of a counterparty defaulting on the financial performance of a derivatives or securities contract, market participants can have contracts guaranteed by a CCP.1 Once a contract has been guaranteed by a CCP, it is deemed to be cleared by the CCP. When a CCP clears a contract, it institutes risk management measures to help ensure that contractual obligations are met. One of the most important measures, and the one we’re focusing on here, is collateral, or more specifically, initial margin (IM).
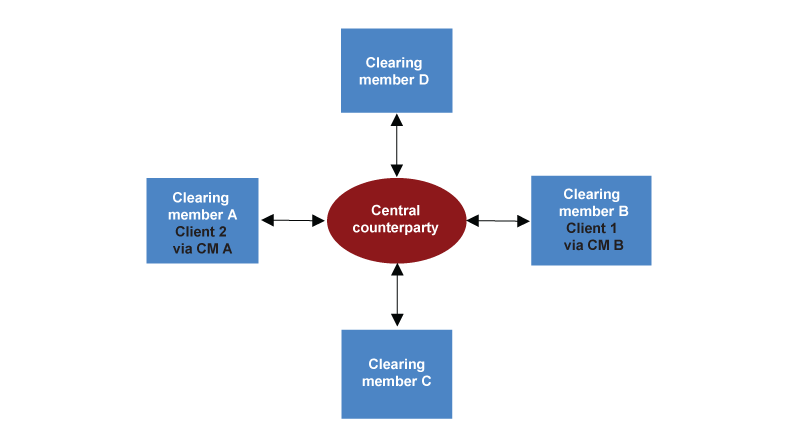
Market participants can clear contracts either directly as clearing members2 (CMs) or indirectly as clients of CMs. Not all CMs clear clients, but the ones that clear for CFTC-regulated products are registered as futures commission merchants (FCMs), while the CMs that clear for SEC-regulated products are registered as broker-dealers. An illustration of the clearing ecosystem is depicted in figure 1, where CM A and CM B clear for clients while CM C and CM D do not.3
1. Clearing ecosystem
Who are the CCPs in the U.S. (and which products do they clear)?
- Chicago Mercantile Exchange (CME) clears trades in futures and options referencing physical commodities, equity indexes, foreign exchange rates, and interest rates, as well as over-the-counter (OTC) interest rate swaps and swaptions.
- Fixed Income Clearing Corporation (FICC) clears trades and repurchase agreements (repos) on U.S. Treasury securities through its Government Securities Division (GSD) and trades on mortgage-backed securities through its Mortgage-Backed Securities Division (MBSD). FICC is a subsidiary of the Deposit Trust and Clearing Corporation (DTCC).
- ICE Clear Credit (ICC) clears trades for OTC credit default swaps.
- ICE Clear U.S. clears trades in futures and options referencing physical commodities, equity indexes, foreign exchange rates, and interest rates.
- Minneapolis Grain Exchange (MGX) clears trades in futures and options referencing physical commodities and crypto currencies.
- Nodal Clear clears derivatives referencing environmental, energy, and crypto currencies.
- National Securities Clearing Corporation (NSCC) clears securities trading for equities, corporate bonds, and municipal bonds. NSCC is a subsidiary of the DTCC.
- The Options Clearing Corporation (OCC) clears options on equity securities and futures referencing volatility indexes.
How much risk do the CCPs manage?
In order to cover potential future risk exposures, CCPs require collateral covering the potential loss in the event of a CM defaulting. The requirement is referred to as IM and is set large enough to cover changes in valuations with 99% or higher probability. To forecast the risk, CCPs use a variety of risk models.4 The CM will use the IM set by the CCP and require this along with any add-ons it deems appropriate for clients as their collateral requirements.5
Given the importance of IM, I used it to compare how much risk each of the U.S. CCPs manages in figure 2. Figure 2 also delineates which CCPs have been designated as systemically important financial market utilities (SIFMUs) by the Financial Stability Oversight Council.
2. Initial margin (IM) required and percentage share of each U.S. central counterparty (CCP), as of December 2023
A. IM required at U.S. CCPs (millions)

B. Percentage of IM held by each CCP

Source: Public quantitative disclosures by central counterparties via Clarus Financial Technology.
Based on figure 2, it is evident that CME, with slightly above 50% share among the U.S. CCPs, manages the most risk at roughly $220 billion in IM requirements. OCC and ICE Clear Credit rank second and third, respectively. All three reside in the Federal Reserve’s Seventh District and collectively represent about 80% of the total IM required in the U.S. To gauge the concentration of U.S. CCPs, I use the Herfindahl–Hirschman Index (HHI) methodology, which has been used to gauge concentration in other industries, including banking (DeYoung, 1999). The HHI level would be 3,179.60 for the IM requirements at the end of 2023, which implies a high level of concentration. However, there are scale and scope benefits when market participants concentrate clearing of different products and asset classes at a given CCP, which may offset some of the implicit, higher costs with a concentrated market, as well as aforementioned potential financial stability concerns. Moreover, since the market of tradable securities and derivatives is not purely a domestic market, the HHI levels would need to be adjusted to exclude foreign risk exposures that are managed by these CCPs and U.S. risk exposures that are cleared through foreign CCPs. Unfortunately, this adjustment cannot be done with publicly disclosed data.
To provide a better sense of the growth of IM requirements, I used the annual reports of parent entities of the CCPs (where available) to compare how initial margin has increased since the end of 2007. In figure 3, I show the 2007 levels of IM and compare them to the levels of IM required at the end of 2023. It is evident that the IM levels have increased by over 200% for the two derivative CCPs, while clearing of securities saw nearly a doubling of IM. As a comparison, during this same time macrofinancial indicators as measured by the Consumer Price Index (CPI), nominal gross domestic product (GDP), and the S&P 500 increased by approximately 47%, 89%, and 211%, respectively.
3. Change in initial margin (IM) since 2007
| December 31, 2007 | December 31, 2023 | Increase | |
|---|---|---|---|
| ( - - - - - - millions of dollars - - - - - - ) | (percent) | ||
| CME Group | 57,165.50 | 240,050 | 203 |
| New York Mercantile Exchange | 22,138.40 | ||
| Depository Trust and Clearing Corporation (Government Securities Division and National Securities Clearing Corporation)
|
29,854.82 | 56,468 | 89 |
| New York Board of Trade/ICE Clear U.S. | 4,747.91 | 15,850 | 234 |
Who are the CMs at the CCPs?
While CCPs are important to the clearing ecosystem, and in some cases deemed systemically important to the financial system, there are other constituents in the ecosystem. As mentioned previously, CMs are the direct counterparties to the CCPs. Since the banks that are deemed systemically important globally tend to have a U.S. presence, I used the 2023 GSIB list to cross-reference CCP clearing membership in figure 4. The figure shows that except for a few Chinese banks, the GSIBs have direct connections to one or more U.S. CCPs.
4. Global systemically important bank (GSIB) clearing membership at U.S. clearing services
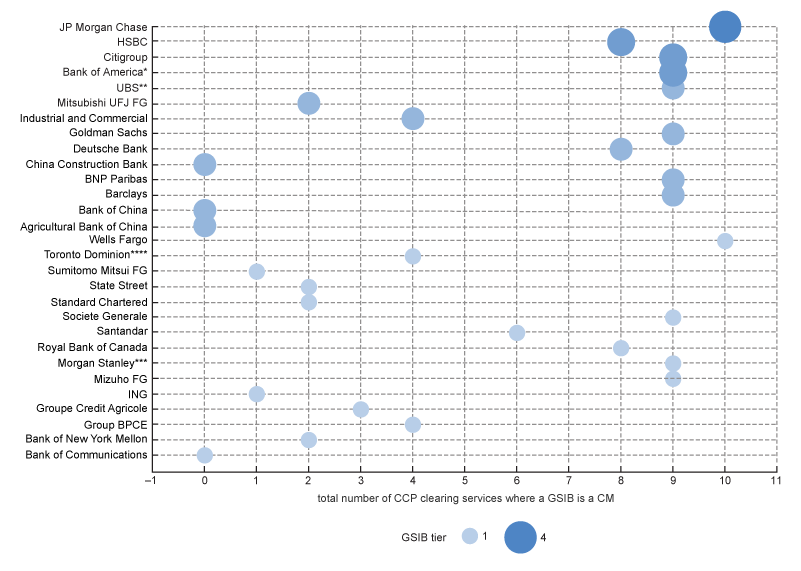
Sources: Financial Stability Board and CCP websites as of January 2024.
How much risk do the CMs manage?
As mentioned previously, CMs clear their proprietary trades, often referred to as “house,” and may clear trades on behalf of third-party clients as FCMs or broker-dealers.
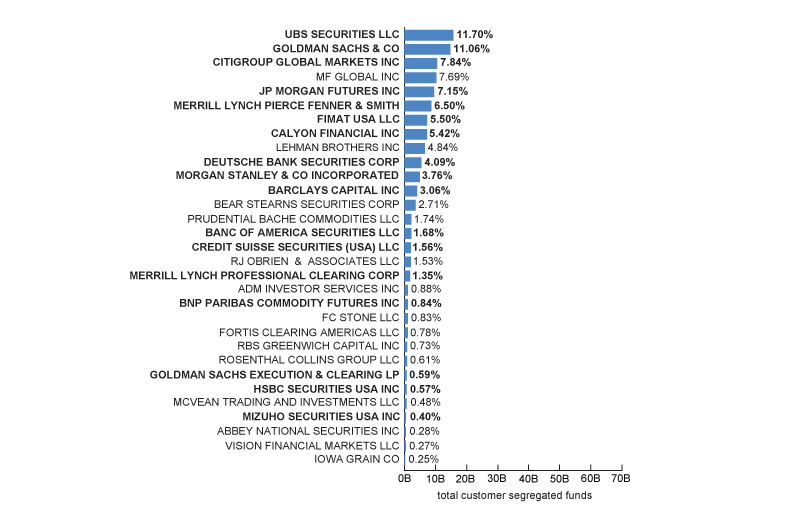
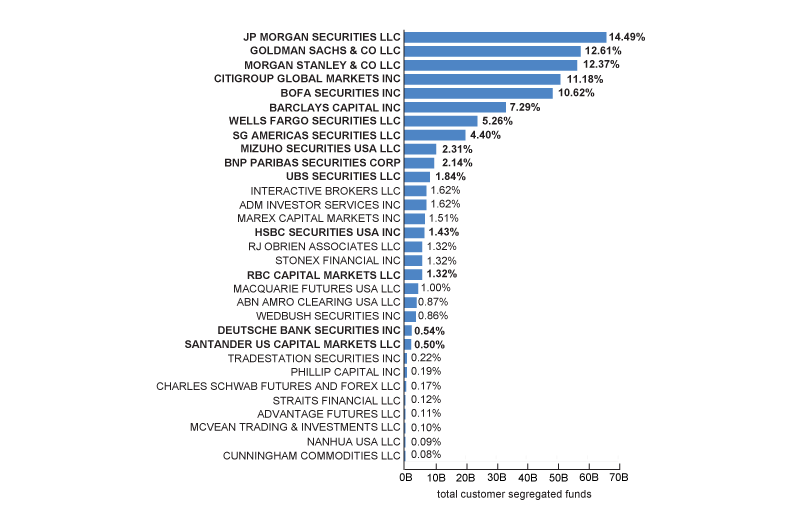
For FCMs, the CFTC provides a public report of monthly client segregated assets (typically used for IM requirements for cleared derivatives) for each FCM. Using data from December 2007 and December 2023, figure 5 shows the aggregate client assets held by FCMs. It is apparent that total customer funds have increased dramatically and the relative share of the top ten FCMs has also increased. The client assets have increased by around 240%, which is higher than the increases in the CPI and nominal GDP of roughly 49% and 89%, respectively. Moreover, as of 2023, the top ten are subsidiaries of the GSIBs that have comparable (and in some cases higher) IM amounts in December 2023 to CCP IM amounts in 2007 as listed in figure 3.
5. Futures commission merchants (FCMs) client assets 2007 versus 2023 showing total assets for a given FCM and percentage of total for each FCM
A. FCM client segregated funds, December 2007
B. FCM client segregated funds, December 2023
Source: Commodity Futures Trading Commission financial data for FCMs.
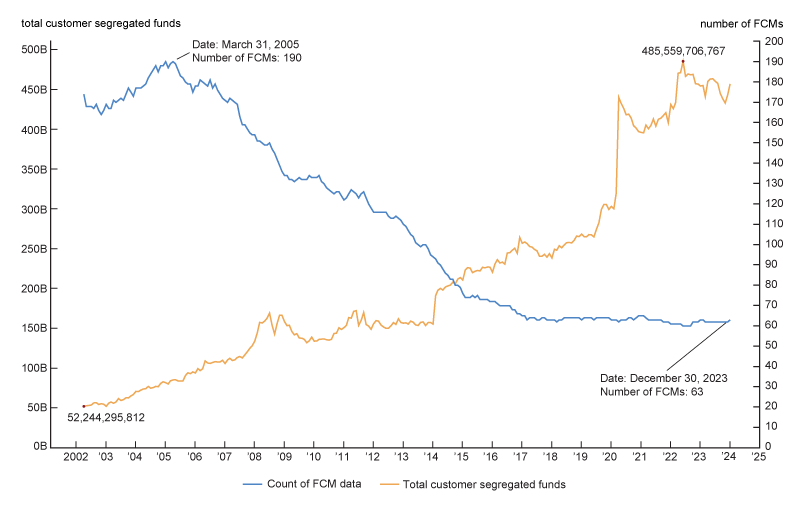
To gauge concentration, I again used the HHI methodology. The HHI level for customer funds held by FCMs is 891.1 for December 2023, implying a lower level of concentration, but higher than 621.8 level for December of 2007. Nevertheless, there are still concerns about the limited number of FCMs serving the U.S. markets. Specifically, as mentioned in the Federal Reserve’s Financial Stability Report, the amount of concentration “could make transferring client positions to other clearing members challenging if it were ever necessary,” particularly as the number of FCMs has decreased from a peak of 190 in March of 2005 to 63 in December of 2023, as shown in figure 6. Moreover, the figure demonstrates that the clearing ecosystem is increasing in concentration as firms exit the ecosystem.
6. Client assets versus number of futures commission merchants (FCMs)
How concentrated are the client clearing activities of the CMs at the U.S. CCPs?
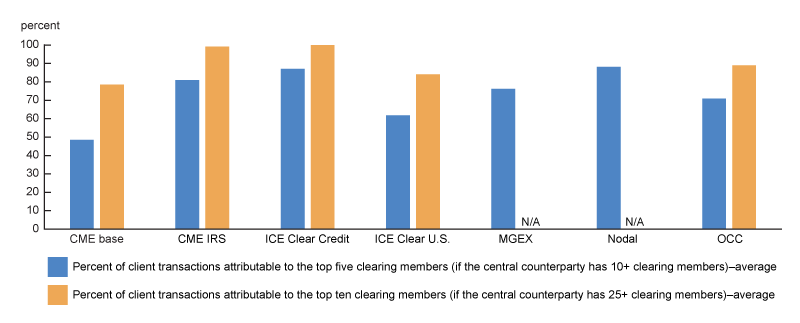
Given my earlier analysis was separately focused on CCPs and CMs, I take a look at how concentrated the client risk exposures via the CMs are at the U.S. CCPs as another way of assessing concentration. Using the percentage of client transactions cleared, figure 7 provides the level cleared by the top five and top ten CMs.6 Here again, it is evident that market share is concentrated in a subset of CMs. Specifically, the top five CMs cleared 48.5% to 88% of client transactions, while the top ten cleared 78.44% to 100%. It is worth noting that the clearing services for OTC interest rate swaps and credit default swaps both have over 99% of the client transactions cleared by the top 10 CMs.
7. Share of client transactions cleared by top five and top ten clearing members
Conclusion
In this article, I demonstrate that the clearing ecosystem is indeed concentrated—and more concentrated than in 2007 (i.e., prior to the global financial crisis). Moreover, when considering the SEC’s new 2023 rule calling for additional clearing of U.S. Treasury securities to be completed in the cash market by the end of 2025 and in the repo market by mid-2026, the level of concentration risk in the ecosystem could continue to increase. While concentration among a few CCPs with an ecosystem centered around large GSIBs may raise concerns about clearing capacity and potential liquidity risk for market participants to meet settlement obligations at CCPs,7 there are clear systemic credit risk benefits from the increased transparency and the risk-management standards employed within the clearing ecosystem.
I would like to thank Tim Fawls for his research data assistance. I would like to thank Geoff Harris, Cindy Hull, Michael O’Connell, and Robert Steigerwald of the Federal Reserve Bank of Chicago, Shengwu Du of the Federal Reserve Board, Teo Floor of CCP Global, Aaron Brown of Citibank, Michael Leibrock of Columbia University, and Ulrich Karl of ISDA for their helpful comments.
Notes
1 For more information on central clearing, see Understanding Derivatives, Chapter 2.
2 Some CCPs use the term clearing participants instead of clearing members.
3 Please note the illustration is simplistic as a CM may have more than one client and a given client may use multiple CMs to clear contracts.
4 For example, haircuts, historic simulations, Monte Carlo simulations, or standard portfolio analysis of risk (SPAN). See CCP12 (2018), section 5.1, for more details.
5 There are cases where CMs require additional collateral above the CCP IM calculation. See FIA (2022) for more details. There are also cases where the CMs use a different IM model when calculating the collateral requirements for clients to clear trades.
6 MGEX and Nodal do not disclose the number of client transactions cleared by the top ten as they had fewer than 25 CMs as of December 2023.
7 See Financial Stability Oversight Council, Annual Report 2023, p. 72.


