

In the United States, cars are both ubiquitous and essential: More than 90% of U.S. households have at least one vehicle, and more than 92% of commuters rely on cars to get to work.1 Even during the Covid-19 pandemic, the average driver in the United States traveled around 31 miles in their vehicle each day.2 Owning a car is especially important in communities where most households have low and moderate incomes (LMI households).3 In such neighborhoods or towns, vehicles enable their residents to access not only places of employment, but also places to get food, medical care, and other resources that are located far away from their homes.
Vehicles, along with the loans used to obtain them, play an outsized role in the financial lives of LMI households. Since homeownership and college attendance rates are lower for people in these households, an auto loan is often the largest loan an LMI household will ever take out and may be its primary connection to financial markets. Because the average time a household owns a particular car is just six years,4 many people will take out several car loans over the course of their lives. This means not only that auto loans make up a large portion of the debt carried by LMI households at any point in time, but also that auto loans’ cumulative impact on these households is larger than any single loan would imply. In addition to playing an outsized role on the debt side of LMI households’ balance sheets, autos frequently represent the largest source of wealth for these households.5 Given the role autos play for many LMI households, any disparities in the costs of auto loans by demographic characteristics could have significant and long-lasting effects on the wealth and financial well-being of LMI households. Roughly 60% of Black households and about half of Hispanic households in the United States are LMI households, so racial discrimination in the auto loan market could be particularly harmful to Black and Hispanic communities.
In my recent paper using Consumer Financial Protection Bureau (CFPB) data on millions of auto loans, I found strong evidence of racial and ethnic discrimination when auto financing is arranged through auto dealers: Auto loans obtained in this way—which are called “indirect” auto loans—for Black, Hispanic, and Asian borrowers have higher interest rates than those for non-Hispanic White borrowers.6 This disparity in rates results in Black, Hispanic, and Asian borrowers often paying hundreds—or sometimes even thousands—of extra dollars in loan payments relative to their White counterparts. My analysis specifically shows that Black borrowers disproportionately pay what is generally the highest allowable interest rate markup—2.0 percentage points—which results in nearly $1,400 in additional interest over the lifetime of a typical auto loan from the 2008–13 data set I used for my paper.7 In my paper, I focused on markups, rather than buy rates, because I found that the differences in markups almost completely drove the disparities in indirect auto loans’ interest rates.
For this ProfitWise News and Views article, I summarize Lanning (2021), which provides evidence that auto dealers’ prejudice against Black (and other non-White) borrowers is the likely cause of their paying higher interest rates on indirect auto loans, compared with their White counterparts. In the next section, I describe the mechanics of indirect auto loans and some institutional details pertaining to interest rate markup. Subsequently, I explain how I detected disparities in the indirect auto loan market mainly by using racial and ethnic proxies based on both surnames and geographic locations with an administrative data set from the CFPB. Then I describe how I identified racial animus among auto dealers as the likely source of higher interest rates paid by Black borrowers while ruling out alternative sources with empirical tests of three representative models of economic discrimination. Finally, I discuss some of the implications of my research for policymakers, financial institutions, and consumer advocates concerned about discrimination in lending markets—including which types of policies they might want to target to reduce lending disparities by race and ethnicity.
Indirect loans: How dealerships earn money through loan markups
When an individual buys a car from a dealership, they often work with the dealer to arrange for a loan from a bank or other external financial institution. Loans obtained through dealers are called indirect auto loans, and estimates suggest that of all auto loans in the United States (worth $1.4 trillion), 80% are indirect loans.8
When an auto dealer arranges an indirect loan, the lender often allows the dealer to charge the buyer a markup on top of the rate at which the lender is willing to make the loan (i.e., the buy rate) and keep a percentage of the additional revenue the markup generates. Typically, a contract between the dealer and the lender caps the markup at between 2.0 and 2.5 percentage points.9 For reference, marking up a typical new car loan in 2021 by 2 percentage points would result in a borrower paying more than $3,100 in additional interest—with a dealer receiving nearly $2,200 in additional revenue.10
Allowing dealers to keep a percentage of the markup compensates them for arranging the loan—which most borrowers prefer to securing a loan themselves. Empowering the dealers to determine the markup can allow them to vary their compensation in proportion to the difficulty of obtaining the loan. However, there is little evidence that markups vary in proportion to the difficulty of securing a loan; actually, the amount of allowable markup often contradicts this justification, as lenders often disallow or substantially limit markups on subprime auto loans (often the most difficult loans to obtain).
While dealers have full knowledge of the markup, there is no requirement for them to disclose the markup to their customers—in fact, many lenders actively discourage revealing the existence or amount of markup to borrowers. As such, most dealers face little resistance in marking up auto loans, and most borrowers never know whether their loan includes a markup or by how much the markup increased the interest rate. Given this common practice of nondisclosure of markups, it is unsurprising that dealers’ finance and insurance operations have traditionally been responsible for as much profit as—or even more profit than—vehicle sales.
The opportunity to increase revenues by applying auto loan markups that are not visible to car buyers can lead to an environment with interest rate disparities (even for borrowers with similar credit profiles). While it is reasonable to think disparities in interest rates may be attributable to differences in default risk and negotiating skills across borrowers, it is also possible that disparities result from some form of discrimination. In general, illegal discrimination occurs when the loan markup paid by two otherwise identical borrowers differs based on a characteristic such as race, ethnicity, or gender. But identifying whether illegal discrimination (particularly racial or ethnic discrimination) is causing disparities poses a specific and significant challenge because auto loan data generally do not include any information on borrowers’ demographic characteristics.
Using proxies to identify disparities by race and ethnicity in the indirect auto loan market
Measuring disparities in auto loan markups by race and ethnicity is challenging because antidiscrimination lending laws prevent financial institutions from including such demographic characteristics in auto loan applications. Under the current lending laws, directly observing the borrower’s race or ethnicity is simply not possible. To try to overcome this challenge in Lanning (2021), I employed a new proxy method that relies on publicly available information about a person’s name and location to make inferences about their race or ethnicity.
Specifically, I employed the Bayesian Improved Surname Geocoding (BISG) proxy method—which uses an individual’s surname and geography to impute their race or ethnicity. Regulators have traditionally used a person’s surname or geographic location—but not both—to identify these demographic characteristics and to check if disparities in lending terms on the basis of race or ethnicity exist at the financial institutions they supervise and examine.11 This BISG approach is described in detail in a 2014 CFPB paper that provides guidance to financial institutions to help them construct proxies for race and ethnicity to monitor their loan portfolios for fair lending risk.12
In Lanning (2021), I began by relating a borrower’s name to the 2010 U.S. Census list of frequently occurring surnames to develop a baseline probability that a borrower would self-identify as Hispanic, White, Black, Asian and Pacific Islander (API), American Indian/Alaska Native (AIAN), or multiracial. This created a baseline estimate of the chances a borrower belonged to each of these racial/ethnic groups. To further strengthen the proxy, I then proceeded to build on these estimates with geographic data. Specifically, I relied on a borrower’s address to match them to their Census block group and used the proportion of all people who live in that geographic area who self-report as a given race and the Bayes’ rule to update the proxy with the additional information.13
Because the proxy relies on population-level data, its accuracy depends on how similar the borrowers taking out auto loans are to the general population used to construct the proxy. Fortunately, the proxy’s calibration to the general population appears well suited for analyzing the market for auto loans.
Auto ownership rates exceed 90% of the general population (as I noted earlier in this article), and the rates of car ownership are comparatively similar across White, Black, and other households.14 Because auto loans are so prevalent and the rate of auto borrowing appears similar across racial and ethnic groups, there is little room for selection bias (or nonrepresentative sampling) to limit the efficacy and accuracy of the BISG proxy in my research.
The tools and techniques to proxy for borrowers’ race or ethnicity described in this section can also be used for other credit markets where, as in the auto loan market, there are no data on such demographic characteristics of borrowers. See box 1 for further discussion of using these tools and techniques to analyze potential disparities by race and ethnicity in other credit markets.
Black, Hispanic, and Asian borrowers pay a higher average markup than do their non-Hispanic White counterparts
To document the existence of these disparities, I present in the first row of figure 1 the unconditional average differences in auto loan markups paid by Black, Hispanic, and Asian borrowers relative to the markups paid by their non-Hispanic White counterparts nationwide (using the proxy estimates of race/ethnicity).15 Figure 1 is adapted from Lanning (2021). The findings in the first row of figure 1 show statistically significant and economically meaningful disparities in the average markup paid by members of each non-White race/ethnicity relative to that paid by their White counterparts, but do not indicate why these disparities exist.
1. Average difference in markup paid by Black, Hispanic, and Asian borrowers relative to markup paid by non-Hispanic White borrowers, by U.S. Census division
| Black | Hispanic | Asian and Pacific Islander | |
| United States/all U.S. Census divisions (All states and DC) |
0.213* | 0.183* | 0.105* |
| East South Central (AL, KY, MS, TN) |
0.399* | 0.396* | 0.124* |
| East North Central (IL, IN, MI, OH, WI) |
0.326* | 0.493* | 0.244* |
| Middle Atlantic (NJ, NY, PA) |
0.304* | 0.411* | 0.263* |
| New England (CT, MA, ME, NH, RI, VT) |
0.207* | 0.283* | –0.014 |
| South Atlantic (DC, DE, FL, GA, MD, NC, SC, VA, WV) |
0.103* | 0.188* | 0.088* |
| West South Central (AR, LA, OK, TX) |
0.064* | 0.082* | –0.003 |
| West North Central (IA, KS, MN, MO, ND, NE, SD) |
0.055* | 0.195* | 0.097* |
| Mountain (AZ, CO, ID, MT, NM, NV, UT, WY) |
–0.006 | 0.105* | –0.017 |
| Pacific (AK, CA, HI, OR, WA) |
–0.122* | –0.006 | 0.039* |
*Statistically significant at the 95% level of confidence.
Notes: The estimates are the difference in markup paid by borrowers belonging to the indicated demographic
group based on a simple, unconditional nationwide regression (first row) or Census-division-specific
regressions (in subsequent rows) (i.e., using only race/ethnicity controls). A map of the U.S. Census
regions and divisions is available
online.
Source: Lanning (2021).
Figure 1 also shows there is substantial variation in the average amounts of markup paid by Black, Hispanic, and Asian borrowers relative to the average amount paid by White borrowers across U.S. Census divisions. Black borrowers face the largest average auto loan markup disparities in the East South Central, East North Central, and Middle Atlantic divisions of the United States and the lowest average markup disparity in the Pacific division. For Hispanic borrowers, there is a similar geographic pattern when it comes to the markup disparities they face. The markup disparities facing Asian borrowers don’t closely track those facing Black and Hispanic borrowers, but for Asian borrowers, there are fairly high markup disparities in the East South Central, East North Central, and Middle Atlantic divisions. Notably, Black, Hispanic, and Asian borrowers in the East North Central division—which includes four of the five states in the Seventh Federal Reserve District served by the Chicago Fed—face markup disparities higher than the national averages. Each of these disparities translates to hundreds of dollars in additional interest paid by a Black, Hispanic, or Asian borrower over the life of their loan relative to what is paid by a non-Hispanic White borrower over the life of theirs.
My analysis from Lanning (2021) also shows that Black borrowers disproportionately pay the highest allowable interest rate markup—typically 2.0 percentage points—which I previously noted translates to almost $1,400 over the lifetime of a typical auto loan in the data used for Lanning (2021). The histogram in figure 2 (also from Lanning, 2021) illustrates this by comparing the share of Black and non-Hispanic White borrowers charged various markup levels: The results favor White borrowers, with a noticeable difference at the 0 percentage point markup level and a pronounced difference at the 2.0 percentage point markup level.16 In fact, the most common outcome for non-Hispanic White borrowers in my paper is to receive no markup, while the most common outcome for Black borrowers is to receive the maximum allowable markup of 2.0 percentage points. That said, zero markup and the maximum markup are the two most common outcomes for each group, suggesting that much of the observed average disparities are differences in the propensity to receive zero versus full markup.
2. Distribution of auto loan interest rate markups: White versus Black borrowers
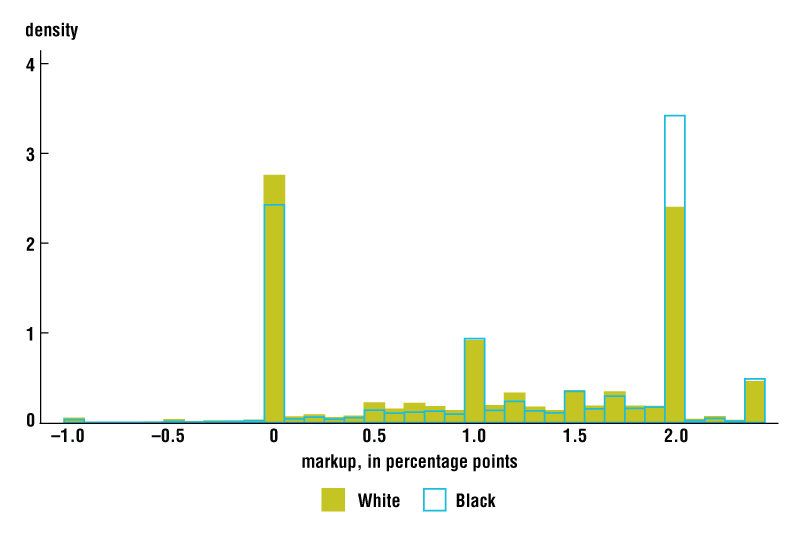
Source: Lanning (2021).
These markup disparities are broadly consistent with the limited existing evidence. For example, a study based on class action lawsuits over the period 1993–2004 shows Black customers paid around $400 in additional markup charges over the life of an auto loan, and public settlements between auto lenders and the Consumer Financial Protection Bureau indicate these patterns of racial disparities in markup persisted into the 2010s.17 Additionally, a recent audit study by the National Fair Housing Alliance—where matched pairs of White and non-White applicants shopped for vehicles and loans—found that non-White customers were frequently charged higher rates than less qualified White customers, potentially costing the former thousands of dollars in additional charges. While not large, this body of evidence is compelling: Disparities exist between the auto loan markup paid by White and non-White customers.
Discrimination appears to drive the observed disparities in markup
Identifying the source of auto loan markup disparities by race/ethnicity is important because this helps us develop policies that are more likely to reduce such disparities. For example, when differences in observed creditworthiness of Black versus White customers create markup disparities, policies that increase Black borrowers’ wealth, income, and other indicators used by lenders to gauge creditworthiness are most likely to reduce such disparities. But when a lack of access to other credit options causes Black borrowers to pay higher markups, different policies—such as those that increase competition among auto dealers—are more likely to reduce disparities. With that said, neither of these policies will be effective when racial prejudice creates auto loan markup disparities.
As a first step in assessing the source of these disparities in Lanning (2021), I asked whether observable indicators of creditworthiness (e.g., credit score, loan amount, and the risk-based interest rate offered), negotiation skills, or financial literacy explain these disparities. If they can, it is possible that “premarket factors”—the specific skills, experiences, etc. that an individual brings with them to the market transaction— are responsible for the disparities. If these observable factors cannot explain the disparities, then the gaps in markups are consistent with discrimination—i.e., when otherwise identical agents receive different treatment in a market based on race, ethnicity, or gender.18
My results in Lanning (2021) are consistent with discrimination driving auto loan markup disparities by race/ethnicity. I showed this by demonstrating that observable differences in borrowers’ attributes are very unlikely to lead to these systematic disparities in markup. As an example, I tested whether Black customers have similar negotiation skills compared with White customers by looking at the average price paid for each specific vehicle in my data set (the same make, model, model year, new or used status, etc.) in a given area (as there may be different market characteristics across geographies). I found that Black customers negotiate virtually identical prices as do White customers, which is consistent with Black and White customers having similar negotiation abilities. This indicates it is highly unlikely that there is a meaningful disparity in the ability to negotiate between Black and White customers that would be reflected in the interest rates on their respective auto loans (especially since very few customers of any race or ethnicity are aware that a markup exists, let alone that it may be negotiable). In a similar fashion I showed that borrowers’ credit indicators and the general characteristics of the sales transaction (e.g., type of vehicle, new versus used status, price, month/year of transaction, and existence of a trade-in) cannot explain the observed disparities in markup. The lack of differences in observable (and nondemographic) characteristics that could have explained the markup disparities strongly suggests the presence of racial discrimination.
What is the source of discrimination in the indirect auto loan market?
Identifying the source of discrimination can be just as important as establishing that this discrimination exists. This is not so much for legal reasons—each of the types of discrimination I’m about to discuss is generally illegal—but for the sake of optimal policy targeting. However, few papers focus much on the source of discrimination, and almost none try to decompose the potential contributions of different types of discrimination to the overall disparity in markups by race/ethnicity.19 In this section, I discuss three representative models of economic discrimination, which are more fully explained in Lanning (2021); explain how certain policies might alleviate or exacerbate these models’ effects; and describe tests of these models in the context of indirect auto loan markups.
There are many competing models of discrimination—each with a specific “root cause” of discrimination. When it comes to economic discrimination, three types of models that have received a great deal attention in the literature are “taste-based” models, statistical discrimination models, and search models with discrimination.
Taste-based models posit that certain economic agents are biased against a particular group, which results in members of this group receiving worse treatment by the prejudiced agents. In the case of indirect auto loans, taste-based discrimination would be indicated if dealers’ (overt or implicit) prejudice against Black customers were to result in those customers getting charged higher average markups than their White counterparts.
Statistical discrimination models posit that when economic agents are not fully informed about other agents (e.g., their customers), they use an individual’s race, ethnicity, gender, etc. as a “rational” proxy for information that is not directly observable. Statistical discrimination would be indicated if the following were to occur in the indirect auto loan market: A dealer believes that a Black customer has less experience and expertise with the financial system compared with a White customer because of differences in average levels of experience across the two racial groups.20 This dealer would discount observed signals that might provide hints about unobservable traits of an individual Black customer because their group’s average characteristics still affect the dealer’s ultimate assessment. For instance, when negotiating the terms of an auto loan, such a dealer would discount the signal of a high credit score for a Black borrower because the dealer believes Black borrowers are likely to have less experience with the financial system than White borrowers (perhaps on account of discrimination in other markets).
Finally, search models with discrimination posit that even an unbiased and fully informed agent would set discriminatory prices when their different customers have different outside options, including loan offers from other dealerships. Search discrimination would be indicated if the following were to happen in the indirect auto loan market: A dealer gives a higher auto loan markup to a Black customer than to a White customer when market conditions suggest that the Black customer is likely to receive a markup rate at least that high at the next dealer, whereas the White customer would be likely to receive a relatively lower rate.21
The policies best used to combat discrimination resulting from each of these sources are different. In fact, an “optimal” policy designed to combat discrimination stemming from one source may exacerbate discrimination stemming from another. For example, interventions that target outcomes—such as requirements that loans be made available with similar terms regardless of the borrowers’ demographics— can alleviate the effects of taste-based discrimination. But these same policies may worsen statistical discrimination. In the presence of statistical discrimination, such interventions can increase the relative uncertainty about the creditworthiness of non-White borrowers conditional on receiving credit, reinforce the negative racial/ethnic stereotypes that may contribute to this uncertainty, and result in higher loan markups for non-White borrowers. Conversely, the prescreening, financial counseling, and credit repair efforts that might address the sources of statistical discrimination are likely to be ineffective at combating taste-based discrimination. In the presence of taste-based discrimination, auto loan markup disparities do not arise from dealers’ uncertainty about non-White borrowers’ financial qualifications; rather, they arise from racial/ethnic animus that is unaffected by the financial profile or literacy of the borrower. Given such considerations and trade-offs, studies that offer a more robust understanding of why discrimination arises are essential to the design of effective policy tools that can work toward mitigating or eliminating bias in credit markets.
In Lanning (2021), I used an administrative data set on indirect auto loans from the CFPB to directly test a model of taste-based discrimination, a model of statistical discrimination, and a search model with discrimination to see what was the driving the observed disparities in auto loan markup between Black and White borrowers. In other words, with the CFPB data set, I empirically tested the different theoretical roots of discrimination (and the predicted results) implied by these three models.
The results of my analysis were strongly inconsistent with the idea that the racial disparity in markup can be explained by models of statistical discrimination (which results from unprejudiced agents acting without full information). An example of statistical discrimination in the indirect auto loan context would be that a dealer offers a higher markup rate to a Black borrower not because the dealer has racial animus against all Black people, but because the dealer believes Black borrowers are less experienced in credit markets on average than White borrowers. To test this, I evaluated not just whether the levels of indicators of financial sophistication (credit score, risk-based buy rate, etc.) differ between Black and White borrowers, but also whether there are asymmetries in how dealers value individual-level signals based on a borrower’s race. I found no evidence in the data that different signals of financial sophistication are treated differently based on race—a finding that strongly contrasts with the predictions of statistical discrimination models.
I also found no support for search discrimination in my tests. I tested whether markup on auto loans arranged through a dealer is based on differences in outside options for auto financing and found markups for Black borrowers are not higher in areas with higher average levels of discrimination; in areas where the Black population is relatively smaller (in such areas, discriminatory preferences in the overall market can be more easily hidden); or in areas where other factors suggested relatively worse outside options for auto financing for Black customers. All of these results suggest that the racial disparity in markup is a result of factors independent of outside opportunities to secure auto financing. This indicates that it is not a “strategic” or opportunistic response to outside discrimination that is driving the observed racial disparity in markups—a finding in stark contrast with what is implied by search models with discrimination.
What I instead found in Lanning (2021) was strong and direct evidence that taste-based discrimination—i.e., race-based bias—is behind the Black–White differences in markup. The data show that the discriminatory markup disparities I observed closely track levels of prejudice across states. Moreover, the test was highly specific, showing that racial disparities in loan markups are heavily influenced by the marginal level of prejudice in a given area, but not the average level. Black customers shopping for a car are likely able to avoid the most prejudiced dealerships, but are unlikely to be able to avoid all prejudice in the market. The level of prejudice at the dealer where Black customers buy a car and originate their loan—which determines the actual amount of additional markup these borrowers pay—is the marginal level of prejudice, rather than the average of the prejudice levels across all dealers in a given geographic area. Or, for those familiar with supply and demand models, the price (in this case, markup) is determined by the intersection of supply and demand (the margin), rather than simply the average height of the supply or demand curve.
To test the effects of the marginal and average levels of prejudice, I built state-level indexes of racial prejudice using detailed data on prejudicial attitudes captured by the General Social Survey (GSS) from NORC at the University of Chicago. These indexes measure the differing levels of racial animus Black customers face in each state, with the average level being the state’s mean value of the index and the marginal level given by the percentile value equal to the share of that state’s total population that is Black.22 The analysis suggests that moving to a state that has a marginal prejudice level one standard deviation higher would result in a Black borrower being charged more than $1,500 in additional interest for an average new car loan.23
Taken together, these findings provide strong evidence that Black–White disparities in auto loan markup are best explained by a model of discrimination based on direct racial bias, rather than one based on dealers' asymmetric valuation of individual-level signals or dealers' strategic responses to differences in outside financing opportunities for customers of different racial groups.
Targeting policies to mitigate discrimination in the auto loan market
The analysis in Lanning (2021) suggests policymakers and consumer advocates may want to more specifically target their efforts on policies that mitigate the effects of race-based bias in the indirect auto loan market. Such policies—each of which attempt to address the implications, rather than the sources, of racial bias—might include the following: 1) restricting the discretionary portion of markup (by only allowing compensation for dealers based on objective factors related to credit or perhaps by moving to a flat-fee compensation regime, which Grunewald et al. (2020) show could improve consumer welfare); 2) requiring dealers to disclose the markup they are imposing on loans (so that borrowers can negotiate them just as they do vehicle prices); and 3) borrowing from the lessons of the Home Mortgage Disclosure Act (HMDA) and permitting the collection and analysis of data on race/ethnicity to ensure fair lending practices are being followed in the indirect auto loan market.
Each of these approaches would come with potential costs, in addition to the potential benefit of alleviating prejudice-based disparities. Grunewald et al. (2020) indicate that while a flat-fee compensation regime would likely increase overall consumer welfare, it would also transfer welfare between consumers, making some worse off.24 A disclosure of auto loan markup could result in higher markups for borrowers who are less inclined to negotiate these rates or who are unaware these rates are negotiable at all (the levels of markup may closely track borrowers’ levels of experience with the financial system). Finally, a collection of demographic data could be off-putting to many consumers who are protective of their privacy, and these data could be used for alternative purposes that may be counterproductive to reducing disparities in markups by race and ethnicity. As such, further research and discussion resulting in a comprehensive cost–benefit analysis would be required before suggesting an optimal policy for such demographic data collection.
Conclusion
This article summarizes Lanning (2021)—my recent research documenting that Black, Hispanic, and Asian borrowers have higher interest rates on indirect auto loans than their non-Hispanic White counterparts and that these differences are almost completely attributable to differences in markups (rather than buy rates). In my previous paper, I considered—and ultimately rejected—the possibility that the Black–White disparities in auto loan markups resulted from differences in negotiation abilities and other nonrace factors that are simply associated with race; I also ruled out the possibility that the next best options to secure auto financing facing these different racial groups in the market was the source of Black–White markup disparities. The absence of an explanation other than racial animus might be enough to indicate racial bias is behind the disparities in markup. However, I conducted a specific and sharp test to determine whether prejudice is indeed driving these disparities. My results were robust and consistent with a model of taste-based discrimination. That is, my results showed that the marginal level of prejudice in the market has an economically important and statistically significant effect on the Black–White disparities in markup observed in the indirect auto loan market. This is a troubling finding, not just because it suggests that racial animus affects this market transaction, but also because cars are such an important part of the financial lives of economically vulnerable populations. Cars are all but necessary in American life and play a disproportionately large role in the financial lives of LMI households, where vehicles are often both their most valuable assets and biggest liabilities. Given that approximately 60% of Black households and around one-half of Hispanic households are LMI, these findings imply a substantial risk that racial/ethnic prejudice may significantly limit the economic mobility of non-White LMI households.
By gaining a better understanding of why disparities like the ones discussed in this article exist, community-focused lenders, policymakers, and consumer advocates can better tailor and target programs and policies to help those who are negatively impacted. Future work developing specific interventions and assessing them with an eye on both efficacy and scalability will no doubt be challenging, but this work may become extremely important from an economic development standpoint.
Notes
1 These statistics are based on 2021 American Community Survey (ACS) data from the U.S. Census Bureau and 2021 data from the U.S. Department of Transportation, Bureau of Transportation Statistics. Importantly, the car commuter percentage ignores the nearly 18% of workers who worked from home in 2021—a percentage that more than tripled during the pandemic, according to ACS data.
2 Author’s calculation based on 2019–20 Annual Vehicle Distance Traveled in Miles and Related Data from the U.S. Department of Transportation, Federal Highway Administration.
3 The U.S. Census Bureau defines LMI households as those having income levels lower than 80% of the area median family income; for further details, see Horowitz (2018). However, in this article, I generally use LMI to refer more broadly to multiple conditions closely intertwined with low and moderate income, such as low wealth or low credit scores.
4 2019 automotive data from S&P Global Mobility, R.L. Polk & Co.
5 Although cars are generally the major source of wealth for LMI households, they are not wealth-building assets. Unlike homes, vehicles typically depreciate in value quickly.
6 Jonathan A. Lanning, 2021, “Testing models of economic discrimination using the discretionary markup of indirect auto loans,” paper presented at the Racial Inequality and Disparities in Financial Markets conference, Federal Reserve Bank of Atlanta, October 14, available online.
7 The nearly $1,400 in additional interest is from author’s calculations based on a $25,000 auto loan with a 60-month loan term, a 3.86% buy rate, and 2.00% markup. The extra finance charges paid are likely even higher now because the typical cost, as well as length, of an auto loan has increased since the 2008–13 period—which is when the auto loans in the CFPB data I used for Lanning (2021) were booked.
8 Andreas Grunewald, Jonathan A. Lanning, David C. Low, and Tobias Salz, 2020, “Auto dealer loan intermediation: Consumer behavior and competitive effects,” National Bureau of Economic Research, working paper, No. 28136, November. Crossref
9 While markups of 2.5 percentage points are sometimes allowed, the upper limit depends on the lender, borrower, loan characteristics, and state in which the loan is originated. As such, loans eligible for markups of 2.5 percentage points are uncommon, and 2.0 percentage points is the de facto maximum markup for most loans. See Grunewald et al. (2020) and Lanning (2021).
10 The figure of approximately $3,100 in additional interest is from author’s calculations based on the 2021 average of a $47,000 loan for a new vehicle with a 72-month loan term, a 3.86% buy rate, and a 2.00% markup. The source of the 2021 average auto loan amount is the Kelley Blue Book. I chose the 72-month loan term given the typical terms of recently originated auto loans reported by Edmunds. The additional amount paid by the borrower exceeds the dealer’s revenue because the additional interest paid is split between the dealer and the lender (usually 70:30)—see Grunewald et al. (2020). See Bankrate.com for a convenient auto loan calculator.
11 Alternative approaches to the BISG proxy method are varied, and include the following: determining race by matching individuals to voting or department of motor vehicles (DMV) records; linking credit records to Home Mortgage Disclosure Act (HMDA) data, which contain race/ethnicity information; and, as mentioned in the main discussion, proxying for race/ethnicity based on either name or geography alone. The BISG approach has benefits in that it can be applied across states (unlike methods relying on voting or DMV records), it covers households that do not have a mortgage (including many young, urban, and/or LMI households), and it uses more information than surname- or geography-only proxies alone. Additionally, the BISG proxy is calculated using publicly available surname and geography data from the U.S. Census, making it easier to calculate and apply for policymakers/regulators and supervised institutions.
12 Consumer Financial Protection Bureau, 2014, “Using publicly available information to proxy for unidentified race and ethnicity: A methodology and assessment,” technical report, Washington, DC, Summer, available online.
13 In addition to applying the BISG methodology directly (to derive the probability of a borrower being a member of each racial/ethnic group), I also employed in Lanning (2021) two alternative strategies for estimating race/ethnicity: 1) a maximum a posteriori (MAP) approach that assigns each observation’s most likely race/ethnicity and 2) a repeated imputation approach that takes the average result of 1,000 repetitions of the analysis, where race is randomly (and independently) assigned in each iteration based on the proxy values. Each of these approaches yielded similar qualitative results, though the specific magnitudes of the estimates relying on the different approaches varied.
14 See Lanning (2021, table 4, p. 47).
15 Given that the BISG proxy provides probabilities an individual belongs to a particular racial/ethnic group rather than assigning that individual to one of these groups, the estimates in figure 1 are actually coefficients from a simple regression of auto loan interest rate markup on the racial/ethnic group proxy values. A regression is a statistical exercise that estimates the degree of correlation between a dependent variable (the main factor I am trying to predict) and an independent variable (the factor I think can be used to make the prediction). In this case, the regression coefficients (the numbers reported in figure 1) represent the difference in auto loan markup relative to the markup of a non-Hispanic White borrower (the amount marked up is the dependent variable) that would be expected if a borrower were known to be a member of the demographic group indicated by the race/ethnicity variable (Black, Hispanic, or Asian and Pacific Islander) (which is the independent variable). The data are presented nationwide and also by Census division to highlight the geographic variation in markup differentials.
16 For the purposes of constructing figure 2, I employed the maximum a posteriori method: Specifically, I used the BISG proxy values for each borrower to assign them to the groups they had the highest estimated probability of belonging to.
17 See Mark A. Cohen, 2012, “Imperfect competition in auto lending: Subjective markup, racial disparity, and class action litigation,” Review of Law & Economics, Vol. 8, No. 1, pp. 21–58, Crossref, and CFPB Fair Lending enforcement actions, which are searchable online; previously, I worked on fair lending matters at the CFPB.
18 Premarket explanations for disparities by race/ethnicity do not preclude the existence of discrimination or its influence on market outcomes. It is common for the differences in skills, experiences, education, etc. that an individual brings to a market transaction to be shaped by discrimination and disparities in their premarket experiences. A classic example of this is in the labor market, where even if wages and employment could be solely and objectively based on education and experience, these premarket factors can be shaped by racism in historical redlining, cultural bias in teacher perceptions, and race-based differences in parental resources. Put differently, premarket differences that explain different outcomes in a market transaction may indicate where it is best to look for discrimination, rather than solely document a lack of discrimination in that market.
19 This has happened largely because of the data requirements for directly testing various types of economic discrimination. To directly test the various models, information is needed about the distributions of bias in a market, individual-level signals that are known to be observed and used in price setting, etc. In the absence of these data, most studies that attempt to identify the source of discrimination rely on “outcome tests,” which compare the patterns observed in a market to see if they are consistent with a particular model’s predictions. In effect, this is inferring, rather than directly testing, the source of discrimination.
20 There are a number of problems with statistical discrimination models that have been established. These problems include the following: the “rational” stereotypes may only be rational because the biased assumptions result in outcomes that “justify” them; the modeling underlying statistical discrimination itself may be morally and ethically questionable; and, even if it were to be economically rational, statistical discrimination is typically illegal in the United States. For further discussion, see Coate and Loury (1993), Loury (1998), and Spriggs’s open letter to economists.
21 Note that search models require some type of precipitating disparity between groups in order to propagate discrimination: In the case of indirect auto loans, an auto dealer must reasonably believe that there are different expected outcomes for Black versus White customers somewhere in the market for outside options.
22 For a discussion of this estimation technique, see Kerwin Kofi Charles and Jonathan Guryan, 2008, “Prejudice and wages: An empirical assessment of Becker’s The Economics of Discrimination,” Journal of Political Economy, Vol. 116, No. 5, October, pp. 773–809, Crossref.
23 This figure of $1,500 in additional interest is from author’s calculations based on the 2021 average of a $47,000 loan for a new vehicle with a 72-month loan term, a 3.86% buy rate, and a 0.98% markup. To be clear, the markup rate of 0.98% here represents the additional markup a Black borrower would expect to pay over the life of a typical loan simply from buying the car in a highly racist area.
24 In addition to showing that a flat-fee regime for dealer compensation would increase consumer surplus overall, Grunewald et al. (2020) show that the benefits would be especially concentrated among LMI borrowers (with some welfare being transferred from higher-income borrowers).
Box 1. Using the BISG proxy approach and other tools and techniques to analyze disparities by race and ethnicity in financial markets
The difficulties resulting from limited demographic data are not unique to auto loans and are in fact shared with most credit products.a The lack of demographic data for credit products has created challenges for financial regulators tasked with enforcing the Equal Credit Opportunity Act (ECOA), as well as for financial institutions seeking to proactively monitor their lending operations for disparities on the basis of race and ethnicity. Researchers could use the Bayesian Improved Surname Geocoding approach to proxy for demographic data and apply the techniques to test for the presence and sources of the discrimination on an administrative data set for virtually any credit product. The CFPB chose the BISG method for its supervision efforts in part because this approach relies on publicly available data and can be independently and consistently implemented without access to proprietary or regulatory data that are typically unavailable to the public.
When the demographic characteristics in the relevant credit markets differ substantially from those of the overall population, researchers relying on BISG proxies should consider whether bias correction techniques are appropriate. As noted in the main discussion, the BISG proxies are calibrated to the demographics of the overall population—not the subpopulations participating in various credit markets.
A prominent example of a credit market with substantially different demographic characteristics than the overall population’s is the mortgage market. Non-White borrowers tend to be underrepresented in both national and local mortgage markets in comparison with their shares of the general population. A 2014 CFPB paper (mentioned previously in the main discussion) notes that the BISG proxy will tend to overcount non-White (especially Black) borrowers in Home Mortgage Disclosure Act data while undercounting White borrowers. Although this overcounting could be remedied with a bias correcting adjustment (which I will describe shortly), it is useful to see this inaccuracy not so much as a problem, but as an indication that the BISG proxy is performing as expected.b
The potential for overcounting non-White borrowers may initially give pause to those policymakers, researchers, or financial institutions considering using the BISG proxy method to estimate the demographics of borrowers in home mortgage and other credit markets. That said, this potential limitation of the BISG method in assessing products with borrowers not representative of the general population has possibly been a bit overstated. This miscounting results from the fact that the proxies are calibrated to data describing the names, locations, and race/ethnicity of the overall population— not the sample of the population made up of, say, homeowners when researching home mortgage markets. As such, the BISG proxy will tend to apply general population characteristics to homebuyers in this example. Effectively, this approach assumes homebuying rates are equal across racial and ethnic groups. So, to the extent that the racial and ethnic demographics of homebuyers differ from those of the overall population, the proxy will have some inaccuracy built in. According to U.S. Census Bureau data, the homeownership rate in the United States is 65% for the entire population, 73% for non-Hispanic White Americans, and 42% for Black Americans. Therefore, by adopting a baseline assumption of equal mortgage borrowing rates, the BISG proxies will be calibrated to undercount White borrowers and overcount Black borrowers unless there is near perfect separation of these racial groups based on names and geography (which will obviously not be the case). Despite this, the BISG proxy substantially reduces the miscounting of White and non-White borrowers compared with alternative surname- or geography-only proxies. Using both inputs—surnames and geographic locations—increases the BISG proxies’ predictive power of race and ethnicity. Estimates based on the BISG method are relatively more accurate than those of competing approaches—even for highly nonrepresentative credit markets, such as the mortgage market example noted in that 2014 CFPB paper. In addition, if greater demographic accuracy for homebuyers was the goal of the proxies, it would be fairly easy to apply a bias correction. For example, survey data or U.S. Census data could be used to adjust the estimated probabilities based on the characteristics of homebuyers (as opposed to those of the general population). Once this adjustment is applied (e.g., Black households are X% less likely to own their homes, so reduce the proxy value by X), the resulting estimated counts should approximate the actual counts observed in the credit market data. This approach could apply to any product or market where there is reason to believe nonrepresentative selection could bias estimates. As such, the tools and techniques described in this article can help any agency, institution, or consumer advocacy group looking to monitor a credit market for economic discrimination.
Notes
a Mortgages are a notable exception because the Home Mortgage Disclosure Act requires financial institutions to collect and report information about the ethnicity, race, and gender of mortgage applicants. Additionally, a rule proposed by the Consumer Financial Protection Bureau in 2021 would place requirements similar to those of HMDA on small business loans.
b Note that this should not be an issue for auto loan borrowers. As I noted in the main discussion, auto loans are ubiquitous and fairly evenly distributed across the population. As such, the unadjusted BISG proxy values should provide valid estimates of the race and ethnicity shares of borrowers in this market without any necessary adjustments to account for the differences between the average characteristics of auto loan borrowers and those of the general population.
Biography
Jonathan A. Lanning is a former senior economist in the Community Development and Policy Studies group of the Economic Research Department at the Federal Reserve Bank of Chicago.


