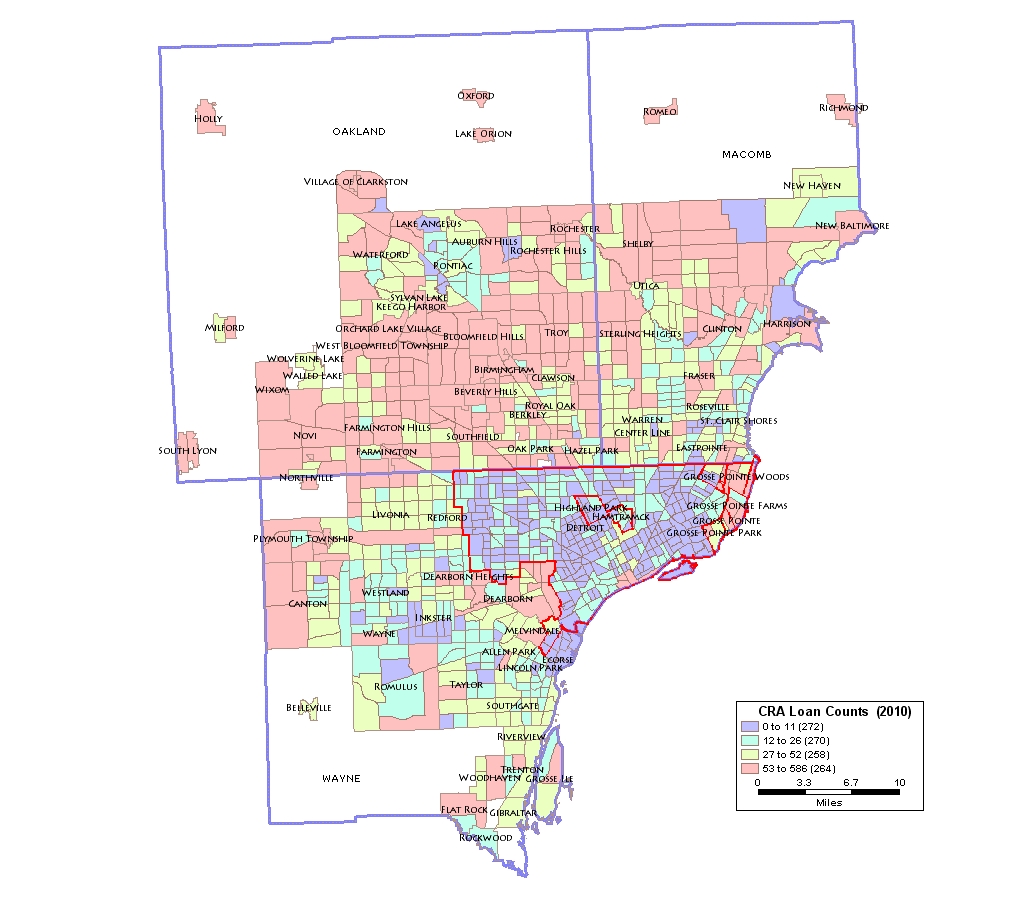
Detroit Area CRA Small Business Lending
Number of CRA-Eligible Small Business Loans, by Census Tract in Macomb, Oakland and Wayne Counties, 2010
Blue = census tracts are in lowest 25 percent of the “small business loan distribution” for the three counties
Green = census tracts are in second lowest (25 – 50 percentile) of the “small business loan distribution” distribution for the three counties
Yellow = census tracts are in second highest (50- 75 percentile) of the “small business loan distribution” distribution for the three counties
Pink = census tracts are in the highest 25 percent of the “small business loan distribution” distribution for the three counties
Sources for the map are Federal Financial Institutions Examination Council (FFIEC), Community Reinvestment Act (CRA) aggregate flat files, and U.S. Census Bureau boundary data as obtained through Maptitude version 5.


 Enlarge Image


