Foreclosure Rate Graphs
Charts on this page reflect the 3-month moving average of the foreclosure inventory, transition and start rates from October 2007 through September 2013.
For a more detailed explanation of these rates as well as an overview of what they mean for communities in the 7th district, please refer to our article in ProfitWise News and Views and guest post on the Midwest Economy Blog.
Cook County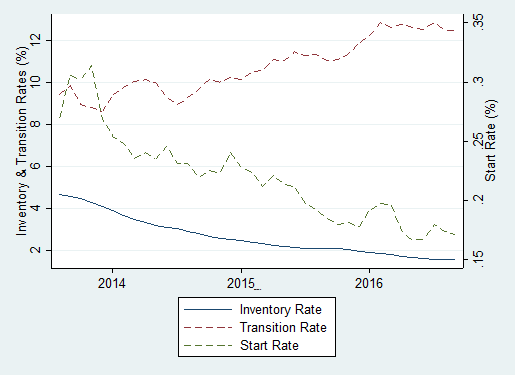 |
Inventory Rate Represents the number of loans in foreclosure as a proportion of active loans. (Usually referred to simply as the "foreclosure rate"). Transition Rate Reflects the rate at which loans exit foreclosure. It is expressed as the number of loans that switched from a foreclosure status to a non-foreclosure status during a particular month as a proportion of loans in foreclosure. Start Rate Reflects the rate at which loans enter foreclosure. It is expressed as the number of loans that switched from a current or delinquent status to a foreclosure status during a particular month as a proportion of actives loans. |
|
Source: LPS Applied Analytics and Federal Reserve Bank calculations. |
Polk County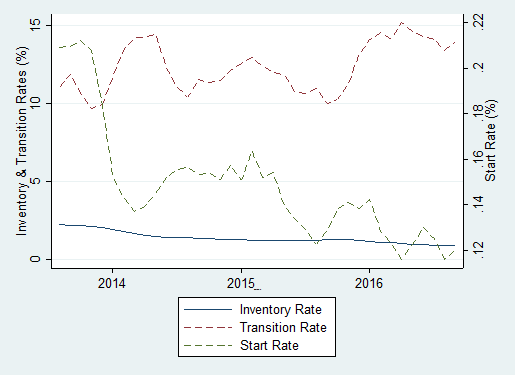 |
Inventory Rate Represents the number of loans in foreclosure as a proportion of active loans. (Usually referred to simply as the "foreclosure rate"). Transition Rate Reflects the rate at which loans exit foreclosure. It is expressed as the number of loans that switched from a foreclosure status to a non-foreclosure status during a particular month as a proportion of loans in foreclosure. Start Rate Reflects the rate at which loans enter foreclosure. It is expressed as the number of loans that switched from a current or delinquent status to a foreclosure status during a particular month as a proportion of actives loans. |
|
Source: LPS Applied Analytics and Federal Reserve Bank calculations. |
Marion County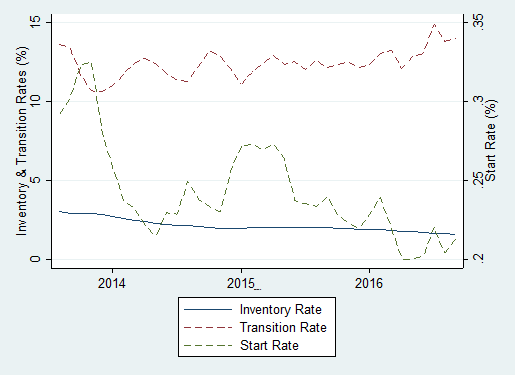 |
Inventory Rate Represents the number of loans in foreclosure as a proportion of active loans. (Usually referred to simply as the "foreclosure rate"). Transition Rate Reflects the rate at which loans exit foreclosure. It is expressed as the number of loans that switched from a foreclosure status to a non-foreclosure status during a particular month as a proportion of loans in foreclosure. Start Rate Reflects the rate at which loans enter foreclosure. It is expressed as the number of loans that switched from a current or delinquent status to a foreclosure status during a particular month as a proportion of actives loans. |
|
Source: LPS Applied Analytics and Federal Reserve Bank calculations. |
Wayne County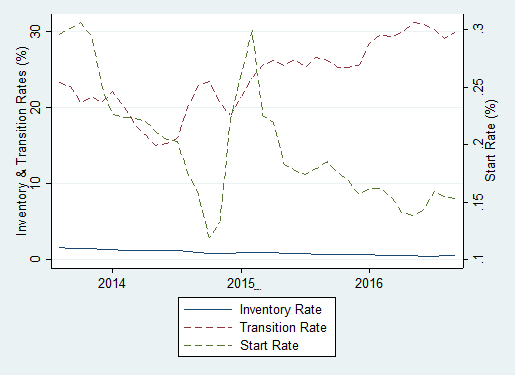 |
Inventory Rate Represents the number of loans in foreclosure as a proportion of active loans. (Usually referred to simply as the "foreclosure rate"). Transition Rate Reflects the rate at which loans exit foreclosure. It is expressed as the number of loans that switched from a foreclosure status to a non-foreclosure status during a particular month as a proportion of loans in foreclosure. Start Rate Reflects the rate at which loans enter foreclosure. It is expressed as the number of loans that switched from a current or delinquent status to a foreclosure status during a particular month as a proportion of actives loans. |
|
Source: LPS Applied Analytics and Federal Reserve Bank calculations. |
Milwaukee County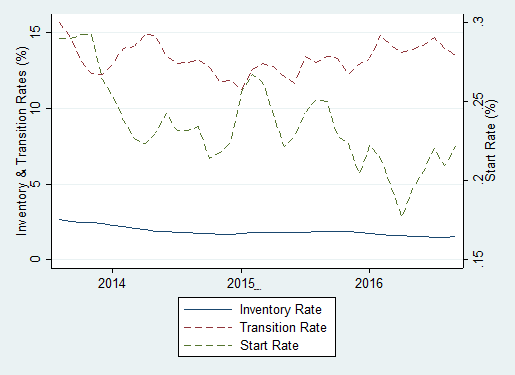 |
Inventory Rate Represents the number of loans in foreclosure as a proportion of active loans. (Usually referred to simply as the "foreclosure rate"). Transition Rate Reflects the rate at which loans exit foreclosure. It is expressed as the number of loans that switched from a foreclosure status to a non-foreclosure status during a particular month as a proportion of loans in foreclosure. Start Rate Reflects the rate at which loans enter foreclosure. It is expressed as the number of loans that switched from a current or delinquent status to a foreclosure status during a particular month as a proportion of actives loans. |
|
Source: LPS Applied Analytics and Federal Reserve Bank calculations. |


